
|
市場調査レポート
商品コード
1666625
指向性エネルギー兵器市場の機会、成長促進要因、産業動向分析、2025~2034年の予測Directed Energy Weapons Market Opportunity, Growth Drivers, Industry Trend Analysis, and Forecast 2025 - 2034 |
||||||
カスタマイズ可能
|
|||||||
| 指向性エネルギー兵器市場の機会、成長促進要因、産業動向分析、2025~2034年の予測 |
|
出版日: 2024年12月14日
発行: Global Market Insights Inc.
ページ情報: 英文 180 Pages
納期: 2~3営業日
|

全表示
- 概要
- 目次
世界の指向性エネルギー兵器市場は大幅な成長を遂げ、2024年には67億米ドルに達し、2025年から2034年までのCAGRは17.6%と、目覚ましい拡大が予測されています。
この急成長は、革新的でハイテクな防衛システムに対する需要の高まりとともに、精密照準の進歩によって後押しされています。高エネルギー・レーザーやマイクロ波ベースのシステムを含むDEWは、脅威を無力化する強力で効率的な手段を提供します。これらのシステムは、比類のない速度と精度を提供し、迅速な反応時間と作戦効率を可能にします。ドローン、ミサイル、先端兵器などの多様な脅威に対抗するための、費用対効果が高く、巻き添え被害の少ないソリューションを提供し、現代の軍事戦略における大きな転換を意味します。世界の安全保障情勢が進化するにつれ、迅速かつ正確な防衛ソリューションの必要性が高まり、DEWは国家安全保障の武器庫に不可欠なツールとなっています。技術革新と強化された軍事能力に対する明確な需要により、この市場は世界的に防衛戦略を変革しようとしています。
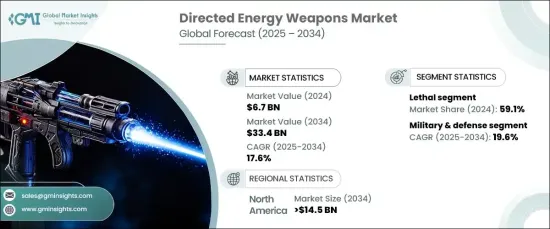
市場は殺傷型と非殺傷型DEWに分けられ、2024年には殺傷型システムが市場シェアの59.1%を占め、この分野を支配します。これらの先進兵器は、巻き添え被害を最小限に抑えながら標的を迅速に排除または無力化するように設計されています。光速で攻撃する致死的DEWの能力は、ドローン、ミサイル、敵対的兵器のような高速で移動する脅威に対抗する上で非常に貴重です。この精度は、軍に現代の戦闘のための信頼性の高い強力なツールを提供しながら、リスクを軽減します。致死性システムはまた、一発あたりの運用コストを削減し、戦略的価値を高めるという点でも際立っています。急速な技術進歩の時代において、迅速な対応能力へのニーズが高まっていることから、致死性セグメントが引き続き主導権を握るでしょう。
| 市場範囲 | |
|---|---|
| 開始年 | 2024 |
| 予測年 | 2025-2034 |
| 開始金額 | 67億米ドル |
| 予測金額 | 334億米ドル |
| CAGR | 17.6% |
用途別では、軍事・防衛分野が最も急成長しており、予測期間中のCAGRは19.6%と予測されています。海軍、地上、航空プラットフォームにわたるDEWsの統合は、軍事作戦に革命をもたらしています。ドローン、精密誘導弾、ミサイル攻撃などの脅威を無力化するこれらのシステムの能力は、軍事に大きな戦術的優位性を与えています。その拡張性、迅速な照準、精度により、攻撃と防御の両方の作戦に不可欠なものとなり、現代の軍事戦略における採用の増加を後押ししています。
北米は、2034年までに145億米ドルの指向性エネルギー兵器の売上を生み出し、世界市場をリードすると予想されています。この優位性は、強力な政府投資、堅調な民間部門、進行中の技術革新によって支えられています。この地域には、指向性エネルギー技術の開発を加速させる主要企業や技術革新の拠点があります。規制当局の支援と国家安全保障へのコミットメントが、北米のこの市場の最前線における地位を確実なものにしています。世界の安全保障上の脅威が進化する中、指向性エネルギー兵器の継続的な進歩は、世界の現代防衛戦略において重要な役割を果たすことを約束します。
目次
第1章 調査手法と調査範囲
- 市場範囲と定義
- 基本推定と計算
- 予測計算
- データソース
- 1次データ
- 2次データ
- 有料情報源
- 公的情報源
第2章 エグゼクティブサマリー
第3章 業界洞察
- エコシステム分析
- バリューチェーンに影響を与える要因
- 利益率分析
- 破壊
- 将来の展望
- メーカー
- 流通業者
- サプライヤーの状況
- 利益率分析
- 主要ニュース
- 規制状況
- 影響要因
- 促進要因
- 先進防衛技術への軍事投資の増加
- 群衆統制のための非致死性武器に対する需要の高まり
- レーザーおよび高エネルギー兵器システムの進歩
- ドローンや無人航空機による脅威の増大
- 新たな世界的脅威に対抗するための戦略的防衛イニシアティブ
- 業界の潜在的リスク&課題
- 開発と配備のための高コストと財政的制約
- 軍事用途における規制上の課題と複雑さ
- 促進要因
- 成長可能性分析
- ポーターの分析
- PESTEL分析
第4章 競合情勢
- イントロダクション
- 企業シェア分析
- 競合のポジショニング・マトリックス
- 戦略展望マトリックス
第5章 市場推計・予測:製品タイプ別、2021年~2034年
- 主要動向
- 致死性
- 非致死性
第6章 市場推計・予測:技術別、2021-2034年
- 主要動向
- 高エネルギーレーザー
- 固体レーザー
- ファイバーレーザー
- 自由電子レーザー
- 化学レーザー
- 液体レーザー
- 高出力高周波
- 狭帯域マイクロ波
- 超広帯域マイクロ波
- 電磁波兵器
- 粒子ビーム兵器
- レーザー誘起プラズマチャンネル(LIPC)
- 音波兵器
第7章 市場推計・予測:プラットフォーム別、2021年~2034年
- 主要動向
- 陸上
- 装甲車
- ハンドヘルド
- 兵器システム
- 空挺
- ヘリコプター
- 戦闘機
- 特殊任務機
- 戦術UAV
- 海軍
- 戦闘艦艇
- 潜水艦
- 無人地上車両
- 宇宙
第8章 市場推計・予測:用途別、2021年~2034年
- 主要動向
- 軍事・防衛
- 国境警備
- 戦術ミサイル防衛
- 海上防衛
- 軍事基地防衛
- 対弾道ミサイル防衛
- 対衛星ミサイル防衛
- 指揮統制情報戦
- 戦場における航空阻止
- 国土安全保障
- 暴動鎮圧
- 空港保護
- 麻薬密輸対策
- 重要インフラ保護
- 化学、生物、放射線、核、爆発物(CBRNE)
第9章 市場推計・予測:地域別、2021年~2034年
- 主要動向
- 北米
- 米国
- カナダ
- 欧州
- 英国
- ドイツ
- フランス
- イタリア
- スペイン
- ロシア
- アジア太平洋
- 中国
- インド
- 日本
- 韓国
- オーストラリア
- ラテンアメリカ
- ブラジル
- メキシコ
- 中東・アフリカ
- 南アフリカ
- サウジアラビア
- アラブ首長国連邦
第10章 企業プロファイル
- BAE Systems PLC
- Elbit Systems Ltd
- Honeywell International Inc
- L3Harris Technologies, Inc
- Leonardo SpA
- Lockheed Martin Corporation
- Moog, Inc.
- Northrop Grumman Corporation
- QinetiQ Limited
- Rafael Advanced Defense Systems Ltd.
- Raytheon Technologies Corporation
- Rheinmetall AG
- Textron, Inc.
- Thales Group
- The Boeing Company
The Global Directed Energy Weapons Market is poised for substantial growth, reaching USD 6.7 billion in 2024, with an impressive projected expansion at a CAGR of 17.6% from 2025 to 2034. This surge is fueled by advancements in precision targeting, along with a rising demand for innovative and high-tech defense systems. DEWs, including high-energy lasers and microwave-based systems, offer a powerful and efficient means of neutralizing threats. These systems provide unmatched speed and precision, allowing for quick reaction times and operational efficiency. They represent a significant shift in modern military strategies, offering cost-effective, low-collateral-damage solutions for countering diverse threats, such as drones, missiles, and advanced weaponry. As the world's security landscape evolves, the growing need for rapid, precise defense solutions is making DEWs an essential tool in national security arsenals. With technological innovations and a clear demand for enhanced military capabilities, the market is set to transform defense strategies globally.
The market is divided into lethal and non-lethal DEWs, with lethal systems dominating the sector in 2024, accounting for 59.1% of the market share. These advanced weapons are designed to swiftly eliminate or disable targets with minimal collateral damage. The ability of lethal DEWs to strike at the speed of light is invaluable in countering fast-moving threats like drones, missiles, and hostile weaponry. This precision reduces risks while providing military forces with a reliable and powerful tool for modern combat. Lethal systems also stand out for their reduced operational costs per shot, enhancing their strategic value. The lethal segment will continue to lead, driven by the increasing need for fast-response capabilities in an era of rapid technological advancements.
| Market Scope | |
|---|---|
| Start Year | 2024 |
| Forecast Year | 2025-2034 |
| Start Value | $6.7 Billion |
| Forecast Value | $33.4 Billion |
| CAGR | 17.6% |
In terms of application, the military and defense sector is the fastest-growing segment of the market, with a projected CAGR of 19.6% during the forecast period. The integration of DEWs across naval, ground, and aerial platforms is revolutionizing military operations. These systems' ability to neutralize threats like drones, precision-guided munitions, and missile attacks gives the armed forces a significant tactical edge. Their scalability, rapid targeting, and precision make them indispensable for both offensive and defensive operations, driving their increasing adoption in modern military strategies.
North America is expected to generate USD 14.5 billion in directed energy weapon sales by 2034, leading the global market. This dominance is supported by strong government investments, a robust private sector, and ongoing technological innovations. The region is home to major players and innovation hubs, which accelerate the development of DEW technologies. Regulatory support and a commitment to national security ensure North America's position at the forefront of this market. As global security threats evolve, the continued advancement of directed energy weapons promises to play a crucial role in modern defense strategies worldwide.
Table of Contents
Chapter 1 Methodology & Scope
- 1.1 Market scope & definitions
- 1.2 Base estimates & calculations
- 1.3 Forecast calculations
- 1.4 Data sources
- 1.4.1 Primary
- 1.4.2 Secondary
- 1.4.2.1 Paid sources
- 1.4.2.2 Public sources
Chapter 2 Executive Summary
- 2.1 Industry synopsis, 2021-2034
Chapter 3 Industry Insights
- 3.1 Industry ecosystem analysis
- 3.1.1 Factor affecting the value chain
- 3.1.2 Profit margin analysis
- 3.1.3 Disruptions
- 3.1.4 Future outlook
- 3.1.5 Manufacturers
- 3.1.6 Distributors
- 3.2 Supplier landscape
- 3.3 Profit margin analysis
- 3.4 Key news & initiatives
- 3.5 Regulatory landscape
- 3.6 Impact forces
- 3.6.1 Growth drivers
- 3.6.1.1 Increasing military investments in advanced defense technologies
- 3.6.1.2 Rising demand for non-lethal weapons for crowd control
- 3.6.1.3 Advancements in laser and high-energy weapon systems
- 3.6.1.4 Growing threats from drones and unmanned aerial vehicles
- 3.6.1.5 Strategic defense initiatives to counter emerging global threats
- 3.6.2 Industry pitfalls & challenges
- 3.6.2.1 High costs and financial constraints for development and deployment
- 3.6.2.2 Regulatory challenges and complexities in military applications
- 3.6.1 Growth drivers
- 3.7 Growth potential analysis
- 3.8 Porter’s analysis
- 3.9 PESTEL analysis
Chapter 4 Competitive Landscape, 2024
- 4.1 Introduction
- 4.2 Company market share analysis
- 4.3 Competitive positioning matrix
- 4.4 Strategic outlook matrix
Chapter 5 Market Estimates & Forecast, By Product Type, 2021-2034 (USD Million)
- 5.1 Key trends
- 5.2 Lethal
- 5.3 Non-lethal
Chapter 6 Market Estimates & Forecast, By Technology, 2021-2034 (USD Million)
- 6.1 Key trends
- 6.2 High energy laser
- 6.2.1 Solid-state laser
- 6.2.2 Fiber laser
- 6.2.3 Free electron laser
- 6.2.4 Chemical laser
- 6.2.5 Liquid laser
- 6.3 High-power Radio Frequency
- 6.3.1 Narrow-band microwave
- 6.3.2 Ultra-wideband microwave
- 6.4 Electromagnetic weapons
- 6.4.1 Particle beam weapons
- 6.4.2 Laser-induced plasma channel (LIPC)
- 6.5 Sonic weapons
Chapter 7 Market Estimates & Forecast, By Platform, 2021-2034 (USD Million)
- 7.1 Key trends
- 7.2 Land
- 7.2.1 Armored vehicles
- 7.2.2 Handheld
- 7.2.3 Weapon systems
- 7.3 Airborne
- 7.3.1 Helicopters
- 7.3.2 Fighter aircraft
- 7.3.3 Special mission aircraft
- 7.3.4 Tactical UAVs
- 7.4 Naval
- 7.4.1 Combat ships
- 7.4.2 Submarines
- 7.4.3 Unmanned surface vehicles
- 7.5 Space
Chapter 8 Market Estimates & Forecast, By Application, 2021-2034 (USD Million)
- 8.1 Key trends
- 8.2 Military & Defense
- 8.2.1 Border protection
- 8.2.2 Tactical missile defense
- 8.2.3 Maritime protection
- 8.2.4 Military base protection
- 8.2.5 Anti-ballistic missile defense
- 8.2.6 Anti-satellite missile defense
- 8.2.7 Command, control, and information warfare
- 8.2.8 Battlefield air interdiction
- 8.3 Homeland security
- 8.3.1 Riot control
- 8.3.2 Airport protection
- 8.3.3 Anti-drug smuggling
- 8.3.4 Critical infrastructure protection
- 8.3.5 Chemical, biological, radiological, nuclear, and explosives (CBRNE)
Chapter 9 Market Estimates & Forecast, By Region, 2021-2034 (USD Million)
- 9.1 Key trends
- 9.2 North America
- 9.2.1 U.S.
- 9.2.2 Canada
- 9.3 Europe
- 9.3.1 UK
- 9.3.2 Germany
- 9.3.3 France
- 9.3.4 Italy
- 9.3.5 Spain
- 9.3.6 Russia
- 9.4 Asia Pacific
- 9.4.1 China
- 9.4.2 India
- 9.4.3 Japan
- 9.4.4 South Korea
- 9.4.5 Australia
- 9.5 Latin America
- 9.5.1 Brazil
- 9.5.2 Mexico
- 9.6 MEA
- 9.6.1 South Africa
- 9.6.2 Saudi Arabia
- 9.6.3 UAE
Chapter 10 Company Profiles
- 10.1 BAE Systems PLC
- 10.2 Elbit Systems Ltd
- 10.3 Honeywell International Inc
- 10.4 L3Harris Technologies, Inc
- 10.5 Leonardo SpA
- 10.6 Lockheed Martin Corporation
- 10.7 Moog, Inc.
- 10.8 Northrop Grumman Corporation
- 10.9 QinetiQ Limited
- 10.10 Rafael Advanced Defense Systems Ltd.
- 10.11 Raytheon Technologies Corporation
- 10.12 Rheinmetall AG
- 10.13 Textron, Inc.
- 10.14 Thales Group
- 10.15 The Boeing Company

