
|
市場調査レポート
商品コード
1797860
エスカレーターおよび動く歩道市場の機会、成長促進要因、産業動向分析、2025年~2034年の予測Escalators and Moving Walkways Market Opportunity, Growth Drivers, Industry Trend Analysis, and Forecast 2025 - 2034 |
||||||
カスタマイズ可能
|
|||||||
| エスカレーターおよび動く歩道市場の機会、成長促進要因、産業動向分析、2025年~2034年の予測 |
|
出版日: 2025年07月24日
発行: Global Market Insights Inc.
ページ情報: 英文 178 Pages
納期: 2~3営業日
|

全表示
- 概要
- 目次
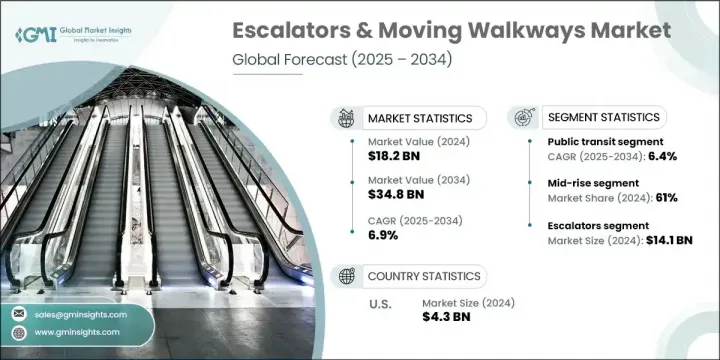
エスカレーターおよび動く歩道の世界市場は、2024年に182億米ドルと評価され、CAGR 6.9%で成長し、2034年には348億米ドルに達すると推定されています。
都市の人口密度が高まり、インフラ整備が加速する中、都市化がこの市場を牽引し続けています。政府や民間開発業者は、都市人口の増加に対応するため、空港、地下鉄駅、公共施設などの交通ハブの拡大に力を入れています。このような交通量の多い環境では、エスカレーターおよび動く歩道は、大量の人々を管理し、混雑を緩和し、縦と横の両空間をスムーズかつ効率的に移動させるために不可欠です。
ショッピングモールやオフィスビルなどの公共スペースでは、階層間のアクセスを向上させるためにエスカレーターおよび動く歩道を採用するケースが増えており、商業施設の建設ラッシュが市場成長の重要な要因となっています。これらの設備は、業務フローに不可欠であるだけでなく、大型商業施設の美観や機能性にも貢献しています。また、アクセシビリティ、安全性、ユニバーサルデザインを確保するシステムに対する需要の高まりも、導入の後押しとなっています。アクセシビリティ・ニーズに対する意識の高まりに伴い、これらのシステムは高齢者や移動障害のある人々に大きな価値を提供し、荷物やベビーカーを持った人々の移動のしやすさも向上させています。
| 市場範囲 | |
|---|---|
| 開始年 | 2024 |
| 予測年 | 2025-2034 |
| 開始金額 | 182億米ドル |
| 予測金額 | 348億米ドル |
| CAGR | 6.9% |
2024年、エスカレーター分野の売上高は141億米ドルで、2034年まで6.6%の成長率で伸び続けると予測されます。エスカレーターは、ショッピングモール、空港、地下鉄駅などの交通量の多い環境で、多数の人の移動を管理するために不可欠です。このような環境では、エスカレーターは不可欠であり、垂直移動が必要な立体構造物にとって重要なサービスを提供しています。
公共交通機関は最大の市場セグメントであり、2024年に大きなシェアを占めました。2034年までのCAGRは6.4%と予測されており、交通機関のハブにおけるエスカレーターおよび動く歩道の需要は高まることが予想されます。これらのシステムは、地下鉄駅、空港、鉄道ターミナルにおけるピーク時の大量の人の流れに対応し、スムーズな通勤の流れを確保し、混雑を緩和するために不可欠です。
米国のエスカレーターおよび動く歩道市場は2024年に79%のシェアを占め、43億米ドルを生み出しました。この優位性は、急速な都市化とインフラへの大規模投資に起因しています。主要都市圏は、交通機関や公共インフラを強化する幅広い取り組みの一環として、垂直移動ソリューションを優先しています。高層ビルや近代的な交通システムに投資する都市は、スマートで環境に優しい建物の動向を考慮し、効果的な垂直移動ソリューションの重要性を高めています。さらに、公共交通システムや空港施設の拡張が、この市場の成長にさらに貢献しています。
エスカレーターおよび動く歩道の世界市場における主要企業は、KONE、三菱電機、日立製作所、ジョンソンリフト、Sicher Elevator、Schindler、フジテック、Stannah、東芝、TKエレベーター、Dazen Elevator、Otis Elevator、現代エレベーター、KLEEMANN、Sigma Elevatorなどです。市場ポジションを強化するために、エスカレーターおよび動く歩道の企業はいくつかの戦略的イニシアチブを採用しています。これには、エネルギー効率の高いモーター、予知保全のためのスマート技術、強化された安全機構などの高度な機能を統合することによる製品ポートフォリオの拡大が含まれます。大規模なインフラ開発業者との提携や協力も主な戦略であり、公開会社は大規模な商業プロジェクトや公共交通プロジェクトの一員となることができます。メーカー各社は、現地生産施設を設立し、費用対効果の高いソリューションを提供することで、新興市場でのプレゼンス拡大に注力しています。さらに、効率的な都市モビリティ・ソリューションに対する需要の高まりに対応するため、より静かで環境にやさしく、より高速なシステムを開発するための研究開発への投資を増やしています。
目次
第1章 調査手法と範囲
第2章 エグゼクティブサマリー
第3章 業界考察
- エコシステム分析
- サプライヤーの情勢
- 利益率
- 各段階での付加価値
- バリューチェーンに影響を与える要因
- 業界への影響要因
- 促進要因
- 業界の潜在的リスク&課題
- 機会
- 成長可能性分析
- 将来の市場動向
- テクノロジーとイノベーションの情勢
- 現在の技術動向
- 新興技術
- 価格動向
- 地域別
- 製品タイプ別
- 規制情勢
- 標準とコンプライアンス要件
- 地域規制枠組み
- 認証基準
- ポーター分析
- PESTEL分析
第4章 競合情勢
- イントロダクション
- 企業の市場シェア分析
- 地域別
- 企業マトリックス分析
- 主要市場企業の競合分析
- 競合ポジショニングマトリックス
- 主な発展
- 合併と買収
- パートナーシップとコラボレーション
- 新製品の発売
- 拡張計画
第5章 市場推計・予測:製品タイプ別、2021年~2034年
- 主要動向
- エスカレーター
- 平行
- マルチパラレル
- その他(ベルト式エスカレーター、ステップ式エスカレーターなど)
- 動く歩道
第6章 市場推計・予測:高さ別、2021年~2034年
- 主要動向
- 低層
- 中層
- 高層
第7章 市場推計・予測:事業別、2021年~2034年
- 主要動向
- 新規設備
- メンテナンス
- 近代化
第8章 市場推計・予測:最終用途別、2021年~2034年
- 主要動向
- 公共交通機関
- 空港
- 小売り
- 公共公益機関
- その他(企業、政府機関の建物など)
第9章 市場推計・予測:地域別、2021年~2034年
- 主要動向
- 北米
- 米国
- カナダ
- 欧州
- ドイツ
- 英国
- フランス
- スペイン
- イタリア
- オランダ
- アジア太平洋地域
- 中国
- 日本
- インド
- オーストラリア
- 韓国
- ラテンアメリカ
- ブラジル
- メキシコ
- アルゼンチン
- 中東・アフリカ
- 南アフリカ
- サウジアラビア
- アラブ首長国連邦
第10章 企業プロファイル
- Dazen Elevator
- Fujitec
- Hitachi
- Hyundai Elevator
- Johnson Lifts
- KLEEMANN
- KONE
- Mitsubishi Electric
- Otis Elevator
- Schindler
- Sicher Elevator
- Sigma Elevator
- Stannah
- TK Elevator
- Toshiba
The Global Escalators & Moving Walkways Market was valued at USD 18.2 billion in 2024 and is estimated to grow at a CAGR of 6.9% to reach USD 34.8 billion by 2034. Urbanization continues to drive this market as cities become more densely populated and infrastructure development accelerates. Governments and private developers are focusing heavily on expanding transportation hubs such as airports, metro stations, and public buildings to accommodate the growing urban populace. In these high-traffic environments, escalators and moving walkways are essential for managing large volumes of people, reducing congestion, and providing smooth and efficient transit across both vertical and horizontal spaces.
The surge in commercial property construction is a key factor in the market's growth, as shopping malls, office buildings, and other public spaces increasingly rely on escalators and moving walkways to improve access between levels. These installations are not only essential for operational flow but also contribute to the aesthetics and functionality of large commercial buildings. The increasing demand for systems that ensure accessibility, safety, and universal design is also driving adoption. With growing awareness of accessibility needs, these systems provide immense value for seniors and people with mobility impairments, enhancing ease of movement for people with luggage or strollers as well.
| Market Scope | |
|---|---|
| Start Year | 2024 |
| Forecast Year | 2025-2034 |
| Start Value | $18.2 Billion |
| Forecast Value | $34.8 Billion |
| CAGR | 6.9% |
In 2024, the escalators segment generated USD 14.1 billion and is expected to continue growing at a rate of 6.6% through 2034. Escalators are essential in high-traffic environments such as shopping malls, airports, and metro stations, where they manage the movement of large numbers of people. In these settings, escalators are indispensable, offering a crucial service for multi-level structures where vertical transportation is required.
The public transit segment represented the largest market segment, accounting for a significant share in 2024. With a projected CAGR of 6.4% through 2034, the demand for escalators and moving walkways in transit hubs is expected to rise. These systems are vital for handling the massive foot traffic during peak hours at metro stations, airports, and railway terminals, ensuring smooth commuter flow and reducing congestion.
United States Escalators & Moving Walkways Market held a 79% share in 2024, generating USD 4.3 billion. This dominance can be attributed to rapid urbanization and significant investments in infrastructure. Major metropolitan areas are prioritizing vertical mobility solutions as part of broader efforts to enhance transportation and public infrastructure. Cities investing in high-rise buildings and modern transit systems have placed increasing importance on effective vertical mobility solutions, considering smart and eco-friendly building trends. Additionally, the expansion of public transit systems and airport facilities has further contributed to this market growth.
Key players in the Global Escalators & Moving Walkways Market include KONE, Mitsubishi Electric, Hitachi, Johnson Lifts, Sicher Elevator, Schindler, Fujitec, Stannah, Toshiba, TK Elevator, Dazen Elevator, Otis Elevator, Hyundai Elevator, KLEEMANN, and Sigma Elevator. To enhance their market position, companies in the escalators and moving walkways are adopting several strategic initiatives. These include expanding their product portfolios by integrating advanced features like energy-efficient motors, smart technology for predictive maintenance, and enhanced safety mechanisms. Partnerships and collaborations with large infrastructure developers are also a key strategy, enabling companies to become a part of large-scale commercial and public transit projects. Manufacturers are focusing on expanding their presence in emerging markets by establishing local production facilities and offering cost-effective solutions. Additionally, they are increasing investments in R&D to develop quieter, more environmentally friendly, and faster systems to meet the growing demand for efficient urban mobility solutions.
Table of Contents
Chapter 1 Methodology and scope
- 1.1 Market scope and definition
- 1.2 Research design
- 1.2.1 Research approach
- 1.2.2 Data collection methods
- 1.3 Data mining sources
- 1.3.1 Global
- 1.3.2 Regional/country
- 1.4 Base estimates and calculations
- 1.4.1 Base year calculation
- 1.4.2 Key trends for market estimation
- 1.5 Primary research and validation
- 1.5.1 Primary sources
- 1.6 Forecast model
- 1.7 Research assumptions and limitations
Chapter 2 Executive summary
- 2.1 Industry 3600 synopsis
- 2.2 Key market trends
- 2.2.1 Regional
- 2.2.2 By product type
- 2.2.3 By height
- 2.2.4 By business
- 2.2.5 By end use
- 2.3 CXO perspectives: strategic imperatives
- 2.3.1 Key decision points for industry executives
- 2.3.2 Critical success factors for market players
- 2.4 Future outlook and strategic recommendations
Chapter 3 Industry insights
- 3.1 Industry ecosystem analysis
- 3.1.1 Supplier landscape
- 3.1.2 Profit margin
- 3.1.3 Value addition at each stage
- 3.1.4 Factor affecting the value chain
- 3.2 Industry impact forces
- 3.2.1 Growth drivers
- 3.2.2 Industry pitfalls & challenges
- 3.2.3 Opportunities
- 3.3 Growth potential analysis
- 3.4 Future market trends
- 3.5 Technology and innovation landscape
- 3.5.1 Current technological trends
- 3.5.2 Emerging technologies
- 3.6 Price trends
- 3.6.1 By region
- 3.6.2 By product type
- 3.7 Regulatory landscape
- 3.7.1 Standards and compliance requirements
- 3.7.2 Regional regulatory frameworks
- 3.7.3 Certification standards
- 3.8 Porter's analysis
- 3.9 PESTEL analysis
Chapter 4 Competitive landscape, 2024
- 4.1 Introduction
- 4.2 Company market share analysis
- 4.2.1 By region
- 4.2.1.1 North America
- 4.2.1.2 Europe
- 4.2.1.3 Asia Pacific
- 4.2.1.4 Latin America
- 4.2.1.5 MEA
- 4.2.1 By region
- 4.3 Company matrix analysis
- 4.4 Competitive analysis of major market players
- 4.5 Competitive positioning matrix
- 4.6 Key developments
- 4.6.1 Mergers & acquisitions
- 4.6.2 Partnerships & collaborations
- 4.6.3 New product launches
- 4.6.4 Expansion plans
Chapter 5 Market Estimates & Forecast, By Product type, 2021 - 2034 ($Billion, Million Units)
- 5.1 Key trends
- 5.2 Escalators
- 5.2.1 Parallel
- 5.2.2 Multi-parallel
- 5.2.3 Others (belt-type escalators, step type escalators, etc.)
- 5.3 Moving walkways
Chapter 6 Market Estimates & Forecast, By Height, 2021 - 2034 ($Billion, Million Units)
- 6.1 Key trends
- 6.2 Low-rise
- 6.3 Mid-rise
- 6.4 High-rise
Chapter 7 Market Estimates & Forecast, By Business, 2021 - 2034 ($Billion, Million Units)
- 7.1 Key trends
- 7.2 New equipment
- 7.3 Maintenance
- 7.4 Modernization
Chapter 8 Market Estimates & Forecast, By End Use, 2021 - 2034 ($Billion, Million Units)
- 8.1 Key trends
- 8.2 Public transit
- 8.3 Airports
- 8.4 Retail
- 8.5 Institutional
- 8.6 Others (corporate, government buildings, etc.)
Chapter 9 Market Estimates & Forecast, By Region, 2021 - 2034 ($Billion, Million Units)
- 9.1 Key trends
- 9.2 North America
- 9.2.1 U.S.
- 9.2.2 Canada
- 9.3 Europe
- 9.3.1 Germany
- 9.3.2 UK
- 9.3.3 France
- 9.3.4 Spain
- 9.3.5 Italy
- 9.3.6 Netherlands
- 9.4 Asia Pacific
- 9.4.1 China
- 9.4.2 Japan
- 9.4.3 India
- 9.4.4 Australia
- 9.4.5 South Korea
- 9.5 Latin America
- 9.5.1 Brazil
- 9.5.2 Mexico
- 9.5.3 Argentina
- 9.6 MEA
- 9.6.1 South Africa
- 9.6.2 Saudi Arabia
- 9.6.3 UAE
Chapter 10 Company Profiles
- 10.1 Dazen Elevator
- 10.2 Fujitec
- 10.3 Hitachi
- 10.4 Hyundai Elevator
- 10.5 Johnson Lifts
- 10.6 KLEEMANN
- 10.7 KONE
- 10.8 Mitsubishi Electric
- 10.9 Otis Elevator
- 10.10 Schindler
- 10.11 Sicher Elevator
- 10.12 Sigma Elevator
- 10.13 Stannah
- 10.14 TK Elevator
- 10.15 Toshiba

