
|
市場調査レポート
商品コード
1721502
乗馬用アパレルの市場機会、成長促進要因、産業動向分析、2025年~2034年予測Equestrian Apparel Market Opportunity, Growth Drivers, Industry Trend Analysis, and Forecast 2025 - 2034 |
||||||
カスタマイズ可能
|
|||||||
| 乗馬用アパレルの市場機会、成長促進要因、産業動向分析、2025年~2034年予測 |
|
出版日: 2025年04月04日
発行: Global Market Insights Inc.
ページ情報: 英文 134 Pages
納期: 2~3営業日
|

全表示
- 概要
- 目次
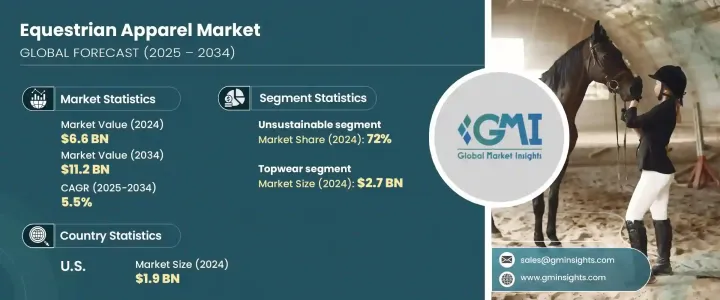
世界の乗馬用アパレル市場は、2024年には66億米ドルとなり、CAGR5.5%で成長し、2034年までには112億米ドルに達すると推定されています。
この成長は、ライフスタイルの変化、レクリエーション活動の増加、農村部と都市部の両方における乗馬への再関心の高まりを反映しています。メディア報道やソーシャルプラットフォームを通じて馬術スポーツが広く知られるようになるにつれ、プロのアスリートから趣味や若い愛好家まで、より多くの人々がこの種目に引き付けられるようになっています。このスポーツの文化的な魅力は、野外での活動や健康への欲求と相まって、性能、機能性、ファッション性を融合させた特殊なウェアに対する消費者の強い欲求を煽っています。さらに、乗馬ウェアは、実用性と洗練性を融合させることで、主流のファッションに影響を与え、乗馬サークルの枠を超えて人気を博しています。その結果、メーカーやデザイナーは、伝統的なライダーとライフスタイル消費者の両方に対応するコレクションを拡大しています。快適性、耐久性、スタイルが最優先事項として浮上する一方、ブランドは環境意識の高いバイヤーにアピールするため、持続可能性の目標に沿い続けています。
乗馬スポーツへの参加者の増加、アウトドアアクティビティの急増、レクリエーションライダーの増加が市場需要の主な促進要因となっています。乗馬を趣味や競合の追求として取り入れる人が増えるにつれ、トップス、ボトムス、アウターウェア、グローブ、ブーツ、ヘルメットなど、高機能かつスタイリッシュなウェアの需要が顕著に高まっています。女性ライダーが市場を独占していることに変わりはありませんが、若いライダーや男性市場参入企業の存在感が増すにつれ、業界の人口層は拡大しています。バイヤーは現在、快適性とデザインのバランスが取れたギアを求めており、機動性、通気性、ライダーの安全性を優先した製品革新につながっています。
| 市場範囲 | |
|---|---|
| 開始年 | 2024年 |
| 予測年 | 2025年~2034年 |
| 開始金額 | 66億米ドル |
| 予測金額 | 112億米ドル |
| CAGR | 5.5% |
トップウェア分野だけでも、競合とレジャーライディングのニーズによって、2024年には27億米ドルが生み出されました。ショー用シャツは、吸湿発散性に優れ、競技中に長時間着用しても快適であることから、プロのライダーの間で依然として人気があります。多用途で知られるポロシャツは、カジュアルウェアと機能的な乗馬ウェアの両方の役割を果たします。一方、柔軟で通気性のある生地で作られたショージャケットは、洗練された外観と実用的な快適性の両方を提供することで、様々なレベルで競うライダーにとって不可欠なものとなっています。
サステナブルアパレルは牽引力を増していますが、2024年の市場シェアはサステナブルでない分野が72%と圧倒的であり、2034年までのCAGRは4.3%で成長すると予想されます。環境面での欠点があるにもかかわらず、手頃な価格が合成素材や石油ベースのテキスタイルの使用を後押しし続けています。ファストファッションは依然として優勢で、リサイクル不可能な部品や有害な化学物質に頼ることが多いです。しかし、持続可能な乗馬用アパレルに対する需要は高まっており、消費者がオーガニックコットン、リサイクル素材、倫理的に生産された選択肢を求めるにつれて、この分野は18億米ドルに達すると予想されます。
米国の乗馬用アパレル市場だけでも、2024年には19億米ドルに達しました。耐久性、快適性、革新性を重視した、プレミアムでパフォーマンス志向の衣料品に対する需要は依然として強いです。アメリカの消費者は、環境に優しいブランドへの傾倒を強めています。オンラインプラットフォームがショッピングの利便性を高める一方で、専門店はカスタムメイドのフィッティングや専門家によるコンサルティングを通じて価値を提供し続けています。
乗馬用アパレル業界の主要企業には、Equi-Star、Ariat International、Samshield、Charles Owen、Dublin、Eskadron、Goode Rider、Kingsland Equestrian、Helite、Horse、Kentucky Horsewear、Pikeur、Riders International、Tredstep Irelandなどがあります。市場での存在感を高めるため、これらのブランドはアパレルの機能性を高める高度な研究開発を優先しています。また、進化する消費者の期待に応え、長期的なブランドロイヤリティを強化するため、持続可能な素材や倫理的な生産プロセスを採用しているところも多いです。
目次
第1章 調査手法と範囲
第2章 エグゼクティブサマリー
第3章 業界考察
- 業界エコシステム分析
- バリューチェーンに影響を与える要因
- 利益率分析
- ディスラプション
- 将来の展望
- 製造業者
- 販売代理店
- サプライヤーの情勢
- 利益率分析
- 主なニュースと取り組み
- 規制情勢
- 業界への影響要因
- 成長促進要因
- 乗馬活動への関心の高まりにより、専用のアパレルや用具の需要が高まっています
- 消費者は、環境に優しく倫理的に調達された乗馬用アパレルを求める傾向が高まっています
- 吸湿発散性や通気性に優れた素材などの高性能生地の革新により、快適性と機能性が向上します
- 業界の潜在的リスク・課題
- ハイエンドの乗馬用アパレルは高価なため、予算を重視する消費者にとっては入手が困難です
- 乗馬用アパレルの売上は、天候や乗馬イベントの季節的な変化によって影響を受ける可能性があります
- 成長促進要因
- 成長可能性分析
- ポーターの分析
- PESTEL分析
第4章 競合情勢
- イントロダクション
- 企業の市場シェア分析
- 競合ポジショニングマトリックス
- 戦略的展望マトリックス
第5章 市場推計・予測:製品タイプ別、2021年~2034年
- 主要動向
- トップウェア
- ショーシャツ
- ポロシャツ
- ショージャケット
- その他(アウターなど)
- ボトムウェア
- 乗馬ズボン
- タイツ
- その他(サーマルなど)
- その他(靴下など)
第6章 市場推計・予測:アパレル別、2021年~2034年
- 主要動向
- 持続可能
- 持続不可能
第7章 市場推計・予測:カテゴリー別、2021年~2034年
- 主要動向
- プロライダー
- レクリエーションライダー
第8章 市場推計・予測:消費者グループ別、2021年~2034年
- 主要動向
- 男性
- 女性
- 子供
第9章 市場推計・予測:価格帯別、2021年~2034年
- 主要動向
- 低
- 中
- 高
第10章 市場推計・予測:流通チャネル別、2021年~2034年
- 主要動向
- オンライン
- Eコマースウェブサイト
- 企業のウェブサイト
- オフライン
- 専門店
- ハイパーマーケット・スーパーマーケット
- その他(百貨店など)
第11章 市場推計・予測:地域別、2021年~2034年
- 主要動向
- 北米
- 米国
- カナダ
- 欧州
- ドイツ
- 英国
- フランス
- スペイン
- イタリア
- オランダ
- アジア太平洋
- 中国
- インド
- 日本
- オーストラリア
- 韓国
- ラテンアメリカ
- ブラジル
- メキシコ
- アルゼンチン
- 中東・アフリカ
- サウジアラビア
- 南アフリカ
- アラブ首長国連邦
第12章 企業プロファイル
- Ariat International
- Charles Owen
- Dublin
- Equi-Star
- Eskadron
- Goode Rider
- Helite
- Horze
- Kentucky Horsewear
- Kingsland Equestrian
- Pikeur
- Riders International
- Samshield
- Tredstep Ireland
The Global Equestrian Apparel Market was valued at USD 6.6 billion in 2024 and is estimated to grow at a CAGR of 5.5% to reach USD 11.2 billion by 2034. This growth reflects a combination of lifestyle shifts, increased recreational activity, and a renewed interest in horseback riding across both rural and urban communities. As equestrian sports gain broader visibility through media coverage and social platforms, more people are being drawn to the discipline-ranging from professional athletes to hobbyists and young enthusiasts. The sport's cultural appeal, combined with the desire for outdoor engagement and wellness, is fueling a strong consumer appetite for specialized apparel that blends performance, functionality, and fashion. Moreover, equestrian clothing is gaining popularity beyond riding circles as it influences mainstream fashion with its blend of utility and sophistication. As a result, manufacturers and designers are expanding their collections to cater to both traditional riders and lifestyle consumers. Comfort, durability, and style are emerging as top priorities, while brands continue to align themselves with sustainability goals to appeal to the eco-conscious buyer.
Rising participation in equestrian sports, a surge in outdoor activities, and a growing base of recreational riders are the primary drivers of market demand. As more individuals embrace horseback riding as a hobby or competitive pursuit, there is a notable rise in demand for high-performance yet stylish apparel such as tops, bottoms, outerwear, gloves, boots, and helmets. Female riders continue to dominate the market, though the increasing presence of younger riders and male participants is expanding the industry's demographic reach. Buyers are now seeking gear that offers a balance of comfort and design, leading to product innovations that prioritize mobility, breathability, and rider safety.
| Market Scope | |
|---|---|
| Start Year | 2024 |
| Forecast Year | 2025-2034 |
| Start Value | $6.6 Billion |
| Forecast Value | $11.2 Billion |
| CAGR | 5.5% |
The topwear segment alone generated USD 2.7 billion in 2024, driven by competitive and leisure riding needs. Show shirts remain a favorite among professional riders for their moisture-wicking capabilities and long-wear comfort during events. Polo shirts, known for their versatility, serve as both casual wear and functional riding apparel, while show jackets, crafted with flexible and breathable fabrics, have become essential for riders competing at various levels by offering both a polished look and practical comfort.
Although sustainable apparel is gaining traction, the unsustainable segment held a dominant 72% market share in 2024 and is expected to grow at a CAGR of 4.3% through 2034. Affordability continues to drive the use of synthetic materials and petroleum-based textiles despite environmental drawbacks. Fast fashion practices still prevail, often relying on non-recyclable components and harmful chemicals. However, demand for sustainable equestrian apparel is rising, with the segment expected to reach USD 1.8 billion as consumers seek organic cotton, recycled fabrics, and ethically produced options.
The U.S. equestrian apparel market alone generated USD 1.9 billion in 2024. Demand remains strong for premium, performance-oriented clothing that emphasizes durability, comfort, and innovation. American consumers are increasingly gravitating toward eco-friendly brands. While online platforms enhance shopping convenience, specialty stores continue to deliver value through custom fittings and expert consultations.
Leading companies in the equestrian apparel industry include Equi-Star, Ariat International, Samshield, Charles Owen, Dublin, Eskadron, Goode Rider, Kingsland Equestrian, Helite, Horze, Kentucky Horsewear, Pikeur, Riders International, and Tredstep Ireland. To strengthen their market presence, these brands are prioritizing advanced R&D to enhance apparel functionality. Many are also adopting sustainable materials and ethical production processes to meet evolving consumer expectations and reinforce long-term brand loyalty.
Table of Contents
Chapter 1 Methodology and Scope
- 1.1 Market scope and definitions
- 1.2 Base estimates & calculations
- 1.3 Forecast calculation
- 1.4 Data sources
- 1.4.1 Primary
- 1.4.2 Secondary
- 1.4.2.1 Paid sources
- 1.4.2.2 Public sources
Chapter 2 Executive Summary
- 2.1 Industry 3600 synopsis
Chapter 3 Industry Insights
- 3.1 Industry ecosystem analysis
- 3.1.1 Factor affecting the value chain
- 3.1.2 Profit margin analysis
- 3.1.3 Disruptions
- 3.1.4 Future outlook
- 3.1.5 Manufacturers
- 3.1.6 Distributors
- 3.2 Supplier landscape
- 3.3 Profit margin analysis
- 3.4 Key news & initiatives
- 3.5 Regulatory landscape
- 3.6 Industry impact forces
- 3.6.1 Growth drivers
- 3.6.1.1 Increased interest in equestrian activities is driving demand for specialized apparel and gear.
- 3.6.1.2 Consumers are increasingly seeking eco-friendly and ethically sourced equestrian apparel.
- 3.6.1.3 Innovation in performance fabrics, such as moisture-wicking and breathable materials, enhances comfort and functionality.
- 3.6.2 Industry pitfalls and challenges
- 3.6.2.1 The expensive nature of high-end equestrian apparel limits accessibility for budget-conscious consumers.
- 3.6.2.2 Equestrian apparel sales can be affected by seasonal variations in weather and riding events.
- 3.6.1 Growth drivers
- 3.7 Growth potential analysis
- 3.8 Porter’s analysis
- 3.9 PESTEL analysis
Chapter 4 Competitive Landscape, 2024
- 4.1 Introduction
- 4.2 Company market share analysis
- 4.3 Competitive positioning matrix
- 4.4 Strategic outlook matrix
Chapter 5 Market Estimates and Forecast, By Product type, 2021 - 2034 (USD Bn) (Million Units)
- 5.1 Key trends
- 5.2 Topwear
- 5.2.1 Showshirts
- 5.2.2 Poloshirts
- 5.2.3 Showjackets
- 5.2.4 Other (outwear, etc)
- 5.3 Bottomwear
- 5.3.1 Breeches/riding pants
- 5.3.2 Tights
- 5.3.3 Other (thermal etc.)
- 5.4 Other (socks etc)
Chapter 6 Market Estimates and Forecast, By Apparel, 2021 - 2034 (USD Bn) (Million Units)
- 6.1 Key trends
- 6.2 Sustainable
- 6.3 Unsustainable
Chapter 7 Market Estimates and Forecast, By Category, 2021 - 2034 (USD Bn) (Million Units)
- 7.1 Key trends
- 7.2 Professional rider
- 7.3 Recreational rider
Chapter 8 Market Estimates and Forecast, By Consumer Group 2021 - 2034 (USD Bn) (Million Units)
- 8.1 Key trends
- 8.2 Male
- 8.3 Female
- 8.4 Children
Chapter 9 Market Estimates and Forecast, By Price Range 2021 - 2034 (USD Bn) (Million Units)
- 9.1 Key trends
- 9.2 Low
- 9.3 Mid
- 9.4 High
Chapter 10 Market Estimates and Forecast, By Distribution Channel 2021 - 2034 (USD Bn) (Million Units)
- 10.1 Key trends
- 10.2 Online
- 10.2.1 E-Commerce websites
- 10.2.2 Company websites
- 10.3 Offline
- 10.3.1 Speciality stores
- 10.3.2 Hypermarkets & supermarkets
- 10.3.3 Others (departmental stores, etc.)
Chapter 11 Market Estimates and Forecast, By Region, 2021 - 2034 (USD Bn) (Million Units)
- 11.1 Key trends
- 11.2 North America
- 11.2.1 U.S.
- 11.2.2 Canada
- 11.3 Europe
- 11.3.1 Germany
- 11.3.2 UK
- 11.3.3 France
- 11.3.4 Spain
- 11.3.5 Italy
- 11.3.6 Netherlands
- 11.4 Asia Pacific
- 11.4.1 China
- 11.4.2 India
- 11.4.3 Japan
- 11.4.4 Australia
- 11.4.5 South Korea
- 11.5 Latin America
- 11.5.1 Brazil
- 11.5.2 Mexico
- 11.5.3 Argentina
- 11.6 Middle East and Africa
- 11.6.1 Saudi Arabia
- 11.6.2 South Africa
- 11.6.3 UAE
Chapter 12 Company Profiles
- 12.1 Ariat International
- 12.2 Charles Owen
- 12.3 Dublin
- 12.4 Equi-Star
- 12.5 Eskadron
- 12.6 Goode Rider
- 12.7 Helite
- 12.8 Horze
- 12.9 Kentucky Horsewear
- 12.10 Kingsland Equestrian
- 12.11 Pikeur
- 12.12 Riders International
- 12.13 Samshield
- 12.14 Tredstep Ireland

