
|
市場調査レポート
商品コード
1666537
医用画像サービスの市場機会、成長促進要因、産業動向分析、2024年~2032年予測Medical Imaging Services Market Opportunity, Growth Drivers, Industry Trend Analysis, and Forecast 2024 - 2032 |
||||||
カスタマイズ可能
|
|||||||
| 医用画像サービスの市場機会、成長促進要因、産業動向分析、2024年~2032年予測 |
|
出版日: 2024年12月19日
発行: Global Market Insights Inc.
ページ情報: 英文 130 Pages
納期: 2~3営業日
|

全表示
- 概要
- 目次
世界の医用画像サービス市場は、2024年に6,489億米ドルとなり、2025年から2034年にかけてCAGR5.2%で拡大すると予測されています。
この力強い成長の原動力は、いくつかの重要な要因に起因しています。世界人口の急速な高齢化とともに慢性疾患の蔓延が進み、医用画像サービスに対するかつてない需要が生まれています。ヘルスケアプロバイダーが幅広い疾患の診断と治療のより正確で効率的な方法を求めているため、先進的な画像技術の採用が加速すると予想されます。さらに、ヘルスケアシステムの近代化が進み、疾病の早期発見と予防に重点が置かれるようになるにつれ、医用画像サービス市場は世界のヘルスケア情勢においてますます重要な役割を果たすようになります。
同市場は、X線、MRI、超音波、コンピュータ断層撮影(CT)、核医学イメージング、マンモグラフィなど、さまざまな画像モダリティにまたがっており、それぞれが独自の方法で市場全体の拡大に貢献しています。なかでもX線画像は、2024年の市場で大きなシェアを占め、支配的な地位を維持しています。X線技術は、骨折から歯科疾患、肺疾患まで、さまざまな疾患の診断における要であり続けています。手ごろな価格で信頼性が高く、大病院から小規模クリニックまでヘルスケア現場で広く利用できることから、好んで選ばれています。世界中でアクセスしやすく使いやすいことが、X線の普及を促進する重要な要素であり、医療診断におけるX線の継続的な関連性を保証しています。
| 市場範囲 | |
|---|---|
| 開始年 | 2023年 |
| 予測年 | 2024年~2032年 |
| 開始金額 | 6,489億米ドル |
| 予測金額 | 1兆700億米ドル |
| CAGR | 5.2% |
エンドユーザー別では、市場は病院、診断センター、クリニック、外来手術センターに区分されます。2024年の医用画像サービス市場では、病院が46%という驚異的なシェアを占め、最大の部分を占めています。これらの施設は、X線装置、MRIスキャナー、CTスキャナー、核画像装置など、広範な画像技術を備えており、総合的な診断能力を可能にしています。病院は、救命処置や外傷治療、手術に高度な画像診断が不可欠なことが多い、複雑で緊急性の高い症例に対応する上で重要な役割を担っています。迅速かつ正確な画像診断サービスを提供できる病院は、ヘルスケアのエコシステムにおいて重要な役割を担っています。
米国では、医用画像サービス市場は2024年に2,169億米ドルに達し、世界市場における同国の主導的地位を確固たるものにしています。この優位性は、多額の医療投資、有利な政府政策、ヘルスケアにおける医用画像の重要性に対する国民の意識の高まりによってもたらされました。米国は、革新的な画像技術の承認と上市を促進する強力な規制枠組みの恩恵を受けています。高齢者人口の増加と継続的なヘルスケア改革により、米国市場はさらなる拡大が見込まれており、医用画像処理サービス分野は今後数年間で有望な見通しとなっています。
目次
第1章 調査手法と調査範囲
第2章 エグゼクティブサマリー
第3章 業界洞察
- 業界エコシステム分析
- 業界への影響要因
- 成長促進要因
- 医用画像処理技術の革新と進歩の増加
- ヘルスケア支出の増加
- 高齢者人口の急増に伴う疾病負担の増加
- 放射線学における人工知能の出現と採用
- 政府の積極的な取り組み
- 業界の潜在的リスク・課題
- 高額な画像処理費用
- 償還政策の変化
- 成長促進要因
- 成長可能性分析
- 規制状況
- 米国
- 欧州
- 償還シナリオ
- 技術情勢
- 今後の市場動向
- ギャップ分析
- ポーター分析
- PESTEL分析
第4章 競合情勢
- イントロダクション
- 企業市場シェア分析
- 企業マトリックス分析
- 主要市場企業の競合分析
- 競合のポジショニングマトリックス
- 戦略ダッシュボード
- 戦略展望マトリックス
第5章 市場推計・予測:モダリティ別、2021年~2034年
- 主要動向
- X線イメージング
- MRI
- 超音波
- コンピュータ断層撮影
- 核医学イメージング
- マンモグラフィ
第6章 市場推計・予測:最終用途別、2021年~2034年
- 主要動向
- 病院
- 診断センター
- 診療所
- 外来手術センター
第7章 市場推計・予測:地域別、2021年~2034年
- 主要動向
- 北米
- 米国
- カナダ
- 欧州
- ドイツ
- 英国
- フランス
- スペイン
- イタリア
- スイス
- オランダ
- ポーランド
- デンマーク
- スウェーデン
- アジア太平洋
- 中国
- 日本
- インド
- オーストラリア
- 韓国
- ニュージーランド
- インドネシア
- タイ
- ベトナム
- ラテンアメリカ
- ブラジル
- メキシコ
- アルゼンチン
- コロンビア
- チリ
- ペルー
- 中東・アフリカ
- 南アフリカ
- サウジアラビア
- アラブ首長国連邦
- イスラエル
- イラン
第8章 企業プロファイル
- Akumin
- Alliance Medical(Life Healthcare Group)
- Capitol Health
- Carlisle Health
- Circle Health Group
- HCA International
- I-MED Radiology Network
- Integral Diagnostics
- Medica Group
- Nuffield Health
- Qscan Group Holdings
- Qure.ai
- RadNet
- Ramsay Health Care
- RAYUS Radiology
- Sonic Healthcare
- Spire Healthcare Group
- The Royal Marsden
- Vista Health
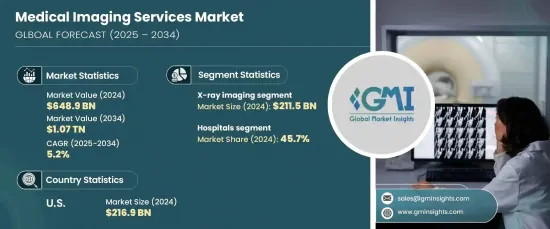
The Global Medical Imaging Services Market, valued at USD 648.9 billion in 2024, is anticipated to expand at a CAGR of 5.2% between 2025 and 2034. The driving force behind this robust growth can be attributed to several key factors. The increasing prevalence of chronic diseases, alongside a rapidly aging global population, is creating an unprecedented demand for medical imaging services. As healthcare providers seek more accurate and efficient ways to diagnose and treat a wide range of conditions, the adoption of advanced imaging technologies is expected to accelerate. Moreover, as healthcare systems continue to modernize and focus on early disease detection and prevention, the medical imaging services market is set to play an increasingly pivotal role in the global healthcare landscape.
The market spans various imaging modalities, including X-ray, MRI, ultrasound, computed tomography (CT), nuclear imaging, and mammography, each contributing to the overall market expansion in unique ways. Among these, X-ray imaging maintains a dominant position, representing a significant share of the market in 2024. X-ray technology remains a cornerstone in diagnosing a variety of conditions, from bone fractures to dental concerns and lung diseases. Its affordability, reliability, and widespread availability across healthcare settings, from large hospitals to smaller clinics, make it a favored choice. The global accessibility and ease of use are key elements that drive X-ray adoption, ensuring its continued relevance in medical diagnostics.
| Market Scope | |
|---|---|
| Start Year | 2023 |
| Forecast Year | 2024-2032 |
| Start Value | $648.9 Billion |
| Forecast Value | $1.07 Trillion |
| CAGR | 5.2% |
On the end-use front, the market is segmented into hospitals, diagnostic centers, clinics, and ambulatory surgical centers. Hospitals captured the largest portion of the medical imaging services market in 2024, holding an impressive 46% share. These institutions are equipped with an extensive array of imaging technologies, including X-ray machines, MRI scanners, CT scanners, and nuclear imaging devices, allowing for comprehensive diagnostic capabilities. Hospitals play a critical role in handling complex and emergency cases, where advanced imaging is often essential for life-saving procedures, trauma care, and surgeries. Their capacity to provide rapid and precise imaging services positions them as key players in the healthcare ecosystem.
In the United States, the medical imaging services market reached USD 216.9 billion in 2024, cementing the country's leading position in the global market. This dominance is driven by substantial healthcare investments, favorable governmental policies, and heightened public awareness about the importance of medical imaging in healthcare. The U.S. benefits from a strong regulatory framework that facilitates the approval and launch of innovative imaging technologies. With a growing elderly population and ongoing healthcare reforms, the U.S. market is poised for further expansion, creating a promising outlook for the medical imaging services sector in the years to come.
Table of Contents
Chapter 1 Methodology and Scope
- 1.1 Market scope and definitions
- 1.2 Research design
- 1.2.1 Research approach
- 1.2.2 Data collection methods
- 1.3 Base estimates and calculations
- 1.3.1 Base year calculation
- 1.3.2 Key trends for market estimation
- 1.4 Forecast model
- 1.5 Primary research and validation
- 1.5.1 Primary sources
- 1.5.2 Data mining sources
Chapter 2 Executive Summary
- 2.1 Industry 3600 synopsis
Chapter 3 Industry Insights
- 3.1 Industry ecosystem analysis
- 3.2 Industry impact forces
- 3.2.1 Growth drivers
- 3.2.1.1 Incremental innovations and advancements in medical imaging technology
- 3.2.1.2 Rise in healthcare expenditure
- 3.2.1.3 Increasing disease burden along with rapidly growing geriatric population base
- 3.2.1.4 Emergence and adoption of artificial intelligence in radiology
- 3.2.1.5 Favorable government initiatives
- 3.2.2 Industry pitfalls and challenges
- 3.2.2.1 High cost of imaging procedures
- 3.2.2.2 Changes in reimbursement policies
- 3.2.1 Growth drivers
- 3.3 Growth potential analysis
- 3.4 Regulatory landscape
- 3.4.1 U.S.
- 3.4.2 Europe
- 3.5 Reimbursement scenario
- 3.6 Technological Landscape
- 3.7 Future market trends
- 3.8 Gap analysis
- 3.9 Porter’s analysis
- 3.10 PESTEL analysis
Chapter 4 Competitive Landscape, 2024
- 4.1 Introduction
- 4.2 Company market share analysis
- 4.3 Company matrix analysis
- 4.4 Competitive analysis of major market players
- 4.5 Competitive positioning matrix
- 4.6 Strategy dashboard
- 4.7 Strategic outlook matrix
Chapter 5 Market Estimates and Forecast, By Modality, 2021 – 2034 ($ Mn)
- 5.1 Key trends
- 5.2 X-ray imaging
- 5.3 MRI
- 5.4 Ultrasound
- 5.5 Computed tomography
- 5.6 Nuclear imaging
- 5.7 Mammography
Chapter 6 Market Estimates and Forecast, By End Use, 2021 – 2034 ($ Mn)
- 6.1 Key trends
- 6.2 Hospitals
- 6.3 Diagnostic centers
- 6.4 Clinics
- 6.5 Ambulatory surgical centers
Chapter 7 Market Estimates and Forecast, By Region, 2021 – 2034 ($ Mn)
- 7.1 Key trends
- 7.2 North America
- 7.2.1 U.S.
- 7.2.2 Canada
- 7.3 Europe
- 7.3.1 Germany
- 7.3.2 UK
- 7.3.3 France
- 7.3.4 Spain
- 7.3.5 Italy
- 7.3.6 Switzerland
- 7.3.7 Netherlands
- 7.3.8 Poland
- 7.3.9 Denmark
- 7.3.10 Sweden
- 7.4 Asia Pacific
- 7.4.1 China
- 7.4.2 Japan
- 7.4.3 India
- 7.4.4 Australia
- 7.4.5 South Korea
- 7.4.6 New Zealand
- 7.4.7 Indonesia
- 7.4.8 Thailand
- 7.4.9 Vietnam
- 7.5 Latin America
- 7.5.1 Brazil
- 7.5.2 Mexico
- 7.5.3 Argentina
- 7.5.4 Colombia
- 7.5.5 Chile
- 7.5.6 Peru
- 7.6 Middle East and Africa
- 7.6.1 South Africa
- 7.6.2 Saudi Arabia
- 7.6.3 UAE
- 7.6.4 Israel
- 7.6.5 Iran
Chapter 8 Company Profiles
- 8.1 Akumin
- 8.2 Alliance Medical (Life Healthcare Group)
- 8.3 Capitol Health
- 8.4 Carlisle Health
- 8.5 Circle Health Group
- 8.6 HCA International
- 8.7 I-MED Radiology Network
- 8.8 Integral Diagnostics
- 8.9 Medica Group
- 8.10 Nuffield Health
- 8.11 Qscan Group Holdings
- 8.12 Qure.ai
- 8.13 RadNet
- 8.14 Ramsay Health Care
- 8.15 RAYUS Radiology
- 8.16 Sonic Healthcare
- 8.17 Spire Healthcare Group
- 8.18 The Royal Marsden
- 8.19 Vista Health

