|
|
市場調査レポート
商品コード
1420121
医用画像サービスの世界市場(2024年版):モダリティ別、技術別、エンドユーザー別、地域別、国別の分析、市場考察、予測(2019年~2029年)Global Medical Imaging Services Market (2024 Edition): Analysis By Modality (X-ray, MRI, CT scan, Others), Technology (2D, 3D/4D), By End Users, By Region, By Country: Market Insights and Forecast (2019-2029) |
||||||
|
|||||||
|
|||||||

| 医用画像サービスの世界市場(2024年版):モダリティ別、技術別、エンドユーザー別、地域別、国別の分析、市場考察、予測(2019年~2029年) |
|
出版日: 2024年02月01日
発行: Azoth Analytics
ページ情報: 英文 240 Pages
納期: 即納可能
|

全表示
- 概要
- 図表
- 目次
世界の医用画像サービスの市場規模は、2029年末までに9,815億米ドルに達し、予測期間の2024年~2029年にCAGRで5.3%の成長が見込まれます。
世界規模での慢性疾患の流行は、医用画像サービスの需要を促進する重大な要因です。市場の大きな促進要因は、医用画像技術の継続的な進化と進歩であり、解像度の向上、速度の向上、新しい画像モダリティの導入などが含まれます。
さらに、事故とそれに伴う損傷は、世界の医用画像サービス市場の力学に影響を与える重要な役割を担っています。医用画像サービスに対する需要は、事故によって大幅に増加し、市場の拡大と進化に寄与しています。例えば、X線、CTスキャン、MRIなどの技術は、損傷の程度を評価し、骨折を特定し、内部損傷の有無を判断するのに役立っています。
当レポートでは、世界の医用画像サービス市場について調査し、市場規模と予測、地域とセグメントの分析、主要動向と機会などの情報を提供しています。
目次
第1章 市場の背景
- 範囲と製品の見通し
- エグゼクティブサマリー
- 調査手法
第2章 戦略的推奨事項
第3章 世界の医用画像サービス市場:実績と予測(2019年~2029年)
- 世界の人口と地域における対象年齢層の割合(2023年)
- 世界銀行地域における心血管疾患の罹患率
- 世界銀行地域における変形性関節症の罹患率
- 世界銀行地域における交通事故の発生
- 世界の医用画像サービス市場:ダッシュボード
- 世界の医用画像サービス市場:市場金額の評価(2019年~2029年)
- 世界の医用画像サービス市場に対するCOVID-19の影響
- 世界の医用画像サービス市場セグメンテーション:モダリティ別
- 世界の医用画像サービス市場:モダリティ別、概要
- 世界の医用画像サービスの市場規模:X線(金額)(2019年~2029年)
- 世界の医用画像サービスの市場規模:MRI(金額)(2019年~2029年)
- 世界の医用画像サービスの市場規模:CTスキャン(金額)(2019年~2029年)
- 世界の医用画像サービスの市場規模:その他のモダリティ(金額)(2019年~2029年)
- 世界の医用画像サービス市場セグメンテーション:技術別
- 世界の医用画像サービス市場:技術別、概要
- 世界の医用画像サービスの市場規模:2D(金額)(2019年~2029年)
- 世界の医用画像サービスの市場規模:3D/4D(金額)(2019年~2029年)
- 世界の医用画像サービス市場セグメンテーション:エンドユーザー別
- 世界の医用画像サービス市場:エンドユーザー別、概要
- 世界の医用画像サービスの市場規模:病院(金額)(2019年~2029年)
- 世界の医用画像サービスの市場規模:診断研究所(金額)(2019年~2029年)
- 世界の医用画像サービスの市場規模:専門クリニック(金額)(2019年~2029年)
第4章 世界の医用画像サービス市場、地域分析
- 研究の地域範囲
- 地域のスナップショット
第5章 南北アメリカの医用画像サービス市場:実績と予測(2019年~2029年)
- 南北アメリカの医用画像サービス市場:スナップショット
- 南北アメリカの医用画像サービス市場:市場規模とCAGR(2019年~2029年)
- 南北アメリカの医用画像サービス市場:主な要因
- 南北アメリカの医用画像サービス市場:セグメント分析
- 南北アメリカの医用画像サービス市場セグメンテーション:モダリティ別
- 南北アメリカの医用画像サービス市場セグメンテーション:技術別
- 南北アメリカの医用画像サービス市場セグメンテーション:エンドユーザー別
- 南北アメリカの医用画像サービス市場セグメンテーション:国別
- 米国の医用画像サービス市場:市場規模とCAGR(2019年~2029年)
- カナダの医用画像サービス市場:市場規模とCAGR(2019年~2029年)
- その他の南北アメリカの医用画像サービス市場:市場規模とCAGR(2019年~2029年)
第6章 欧州の医用画像サービス市場:実績と予測(2019年~2029年)
- 欧州の医用画像サービス市場:スナップショット
- 欧州の医用画像サービス市場:市場規模とCAGR(2019年~2029年)
- 欧州の医用画像サービス市場:主な要因
- 欧州の医用画像サービス市場:セグメント分析
- 欧州の医用画像サービス市場セグメンテーション:モダリティ別
- 欧州の医用画像サービス市場セグメンテーション:技術別
- 欧州の医用画像サービス市場セグメンテーション:エンドユーザー別
- 欧州の医用画像サービス市場セグメンテーション:国別
- ドイツの医用画像サービス市場:市場規模とCAGR(2019年~2029年)
- 英国の医用画像サービス市場:市場規模とCAGR(2019年~2029年)
- フランスの医用画像サービス市場:市場規模とCAGR(2019年~2029年)
- イタリアの医用画像サービス市場:市場規模とCAGR(2019年~2029年)
- スペインの医用画像サービス市場:市場規模とCAGR(2019年~2029年)
- その他の欧州の医用画像サービス市場:市場規模とCAGR(2019年~2029年)
第7章 アジア太平洋の医用画像サービス市場:実績と予測(2019年~2029年)
- アジア太平洋の医用画像サービス市場:スナップショット
- アジア太平洋の医用画像サービス市場:市場規模とCAGR(2019年~2029年)
- アジア太平洋の医用画像サービス市場:主な要因
- アジア太平洋の医用画像サービス市場:セグメント分析
- アジア太平洋の医用画像サービス市場セグメンテーション:モダリティ別
- アジア太平洋の医用画像サービス市場セグメンテーション:技術別
- アジア太平洋の医用画像サービス市場セグメンテーション:エンドユーザー別
- アジア太平洋の医用画像サービス市場セグメンテーション:国別
- 中国の医用画像サービス市場:市場規模とCAGR(2019年~2029年)
- オーストラリアの医用画像サービス市場:市場規模とCAGR(2019年~2029年)
- インドの医用画像サービス市場:市場規模とCAGR(2019年~2029年)
- その他のアジア太平洋の医用画像サービス市場:市場規模とCAGR(2019年~2029年)
第8章 中東・アフリカの医用画像サービス市場:実績と予測(2019年~2029年)
- 中東・アフリカの医用画像サービス市場:スナップショット
- 中東・アフリカの医用画像サービス市場:市場規模とCAGR(2019年~2029年)
- 中東・アフリカの医用画像サービス市場:主な要因
- 中東・アフリカの医用画像サービス市場:セグメント分析
- 中東・アフリカの医用画像サービス市場セグメンテーション:モダリティ別
- 中東・アフリカの医用画像サービス市場セグメンテーション:技術別
- 中東・アフリカの医用画像サービス市場セグメンテーション:エンドユーザー別
第9章 市場力学
- 世界の医用画像サービス市場に対する市場力学の影響の評価
- 促進要因
- 抑制要因
- 動向
第10章 ポーターのファイブフォース分析
第11章 競合ポジショニング
- 企業の製品ポジショニング
- 市場ポジションマトリクス
- 医用画像サービス市場の市場シェア分析
- 企業プロファイル
- Sonic Healthcare
- Global Diagnostic Services, Inc.
- RadNet
- Alliance Medical Limited
- Novant Health
- Akumin Inc.
- Jefferson Health.
- Carlisle Health Group
- Vista Health
- HCA Healthcare UK
List of Figures
List of Figures
- Figure 1: Proportion of selected age groups of the world population and in regions in 2023
- Figure 2: Incidence of Cardiovascular Diseases, 2019
- Figure 3: Incidence of Osteoarthritis, 2019
- Figure 4: Incidence of Transport injuries, 2019
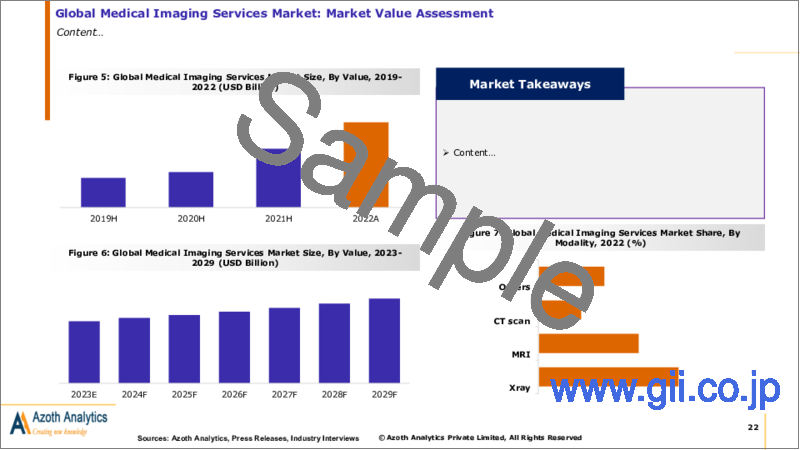
- Figure 5: Global Medical Imaging Services Market Size, By Value, 2019-2022 (USD Billion)
- Figure 6: Global Medical Imaging Services Market Size, By Value, 2023-2029 (USD Billion)
- Figure 7: Global Medical Imaging Services Market Share, By Modality, 2022 (%)
- Figure 8: Global Medical Imaging Services Market Size, By X-ray, By Value, 2019H-2029F (USD Billion & CAGR)
- Figure 9: Global Medical Imaging Services Market Absolute Opportunity, By X-ray, 2019-2029 (USD Billion)
- Figure 10: Global Medical Imaging Services Market Size, By MRI, By Value, 2019H-2029F (USD Billion & CAGR)
- Figure 11: Global Medical Imaging Services Market Absolute Opportunity, By MRI, 2019-2029 (USD Billion)
- Figure 12: Global Medical Imaging Services Market Size, By CT scan, By Value, 2019H-2029F (USD Billion & CAGR)
- Figure 13: Global Medical Imaging Services Market Absolute Opportunity, By CT scan, 2019-2029 (USD Billion)
- Figure 14: Global Medical Imaging Services Market Size, By Other Modalities, By Value, 2019H-2029F (USD Billion & CAGR)
- Figure 15: Global Medical Imaging Services Market Absolute Opportunity, By Other Modalities, 2019-2029 (USD Billion)
- Figure 16: Global Medical Imaging Services Market Size, By 2D, By Value, 2019H-2029F (USD Billion & CAGR)
- Figure 17: Global Medical Imaging Services Market Absolute Opportunity, By 2D, 2019-2029 (USD Billion)
- Figure 18: Global Medical Imaging Services Market Size, By 3D/4D, By Value, 2019H-2029F (USD Billion & CAGR)
- Figure 19: Global Medical Imaging Services Market Absolute Opportunity, By 3D/4D, 2019-2029 (USD Billion)
- Figure 20: Global Medical Imaging Services Market Size, By Hospitals, By Value, 2019H-2029F (USD Billion & CAGR)
- Figure 21: Global Medical Imaging Services Market Absolute Opportunity, By Hospitals, 2019-2029 (USD Billion)
- Figure 22: Global Medical Imaging Services Market Size, By Diagnostic Labs, By Value, 2019H-2029F (USD Billion & CAGR)
- Figure 23: Global Medical Imaging Services Market Absolute Opportunity, By Diagnostic Labs, 2019-2029 (USD Billion)
- Figure 24: Global Medical Imaging Services Market Size, By Specialty Clinics, By Value, 2019H-2029F (USD Billion & CAGR)
- Figure 25: Global Medical Imaging Services Market Absolute Opportunity, By Specialty Clinics, 2019-2029 (USD Billion)
- Figure 26: Americas Medical Imaging Services Market Size, By Value, 2019H-2029F (USD Billion)
- Figure 27: Americas Medical Imaging Services Market Share, By Modality, 2022 (%)
- Figure 28: Americas Medical Imaging Services Market, By X-ray, By Value, 2019H-2029F (USD Billion & CAGR)
- Figure 29: Americas Medical Imaging Services Market, By MRI, By Value, 2019H-2029F (USD Billion & CAGR)
- Figure 30: Americas Medical Imaging Services Market, By CT scan, By Value, 2019H-2029F (USD Billion & CAGR)
- Figure 31: Americas Medical Imaging Services Market, By Other Modalities, By Value, 2019H-2029F (USD Billion & CAGR)
- Figure 32: Americas Medical Imaging Services Market, By 2D, By Value, 2019H-2029F (USD Billion & CAGR)
- Figure 33: Americas Medical Imaging Services Market, By 3D/4D, By Value, 2019H-2029F (USD Billion & CAGR)
- Figure 34: Americas Medical Imaging Services Market, By Hospitals, By Value, 2019H-2029F (USD Billion & CAGR)
- Figure 35: Americas Medical Imaging Services Market, By Diagnostic Labs, By Value, 2019H-2029F (USD Billion & CAGR)
- Figure 36: Americas Medical Imaging Services Market, By Specialty Clinics, By Value, 2019H-2029F (USD Billion & CAGR)
- Figure 37: United States Medical Imaging Services Market, By Value, 2019-2029 (USD Billion & CAGR)
- Figure 38: United States Medical Imaging Services Market Value, By Modality, 2022 (USD Billion)
- Figure 39: United States Medical Imaging Services Market Share, By Modality, By Value, 2022 (%)
- Figure 40: United States Medical Imaging Services Market Share, By Technology, By Value, 2022 (%)
- Figure 41: United States Medical Imaging Services Market Share, By End Users, 2022 (%)
- Figure 42: Canada Medical Imaging Services Market, By Value, 2019-2029 (USD Billion & CAGR)
- Figure 43: Canada Medical Imaging Services Market Value, By Modality, 2022 (USD Billion)
- Figure 44: Canada Medical Imaging Services Market Share, By Modality, By Value, 2022 (%)
- Figure 45: Canada Medical Imaging Services Market Share, By Technology, 2022 (%)
- Figure 46: Canada Medical Imaging Services Market Share, End Users, 2022 (%)
- Figure 47: Rest of Americas Medical Imaging Services Market, By Value, 2019-2029 (USD Billion & CAGR)
- Figure 48: Rest of Americas Medical Imaging Services Market Value, By Modality, 2022 (USD Billion)
- Figure 49: Rest of Americas Medical Imaging Services Market Share, By Modality, By Value, 2022 (%)
- Figure 50: Rest of Americas Medical Imaging Services Market Share, By Technology, 2022 (%)
- Figure 51: Rest of Americas Medical Imaging Services Market Share, By End Users, 2022 (%)
- Figure 52: Europe Medical Imaging Services Market Size, By Value, 2019H-2029F (USD Billion)
- Figure 53: Europe Medical Imaging Services Market Share, By Modality, 2022 (%)
- Figure 54: Europe Medical Imaging Services Market, By X-ray, By Value, 2019H-2029F (USD Billion & CAGR)
- Figure 55: Europe Medical Imaging Services Market, By MRI, By Value, 2019H-2029F (USD Billion & CAGR)
- Figure 56: Europe Medical Imaging Services Market, By CT scan, By Value, 2019H-2029F (USD Billion & CAGR)
- Figure 57: Europe Medical Imaging Services Market, By Other Modalities, By Value, 2019H-2029F (USD Billion & CAGR)
- Figure 58: Europe Medical Imaging Services Market, By 2D, By Value, 2019H-2029F (USD Billion & CAGR)
- Figure 59: Europe Medical Imaging Services Market, By 3D/4D, By Value, 2019H-2029F (USD Billion & CAGR)
- Figure 60: Europe Medical Imaging Services Market, By Hospitals, By Value, 2019H-2029F (USD Billion & CAGR)
- Figure 61: Europe Medical Imaging Services Market, By Diagnostic Labs, By Value, 2019H-2029F (USD Billion & CAGR)
- Figure 62: Europe Medical Imaging Services Market, By Specialty Clinics, By Value, 2019H-2029F (USD Billion & CAGR)
- Figure 63: Germany Medical Imaging Services Market, By Value, 2019-2029 (USD Billion & CAGR)
- Figure 64: Germany Medical Imaging Services Market Value, By Modality, 2022 (USD Billion)
- Figure 65: Germany Medical Imaging Services Market Share, By Modality, By Value, 2022 (%)
- Figure 66: Germany Medical Imaging Services Market Share, By Technology, 2022 (%)
- Figure 67: Germany Medical Imaging Services Market Share, By End Users, 2022 (%)
- Figure 68: United Kingdom Medical Imaging Services Market, By Value, 2019-2029 (USD Billion & CAGR)
- Figure 69: United Kingdom Medical Imaging Services Market Value, By Modality, 2022 (USD Billion)
- Figure 70: United Kingdom Medical Imaging Services Market Share, By Modality, By Value, 2022 (%)
- Figure 71: United Kingdom Medical Imaging Services Market Share, By Technology, 2022 (%)
- Figure 72: United Kingdom Medical Imaging Services Market Share, By End Users, 2022 (%)
- Figure 73: France Medical Imaging Services Market, By Value, 2019-2029 (USD Billion & CAGR)
- Figure 74: France Medical Imaging Services Market Value, By Modality, 2022 (USD Billion)
- Figure 75: France Medical Imaging Services Market Share, By Modality, By Value, 2022 (%)
- Figure 76: France Medical Imaging Services Market Share, By Technology, 2022 (%)
- Figure 77: France Medical Imaging Services Market Share, By End Users, 2022 (%)
- Figure 78: Italy Medical Imaging Services Market, By Value, 2019-2029 (USD Billion & CAGR)
- Figure 79: Italy Medical Imaging Services Market Value, By Modality, 2022 (USD Billion)
- Figure 80: Italy Medical Imaging Services Market Share, By Modality, By Value, 2022 (%)
- Figure 81: Italy Medical Imaging Services Market Share, By Technology, 2022 (%)
- Figure 82: Italy Medical Imaging Services Market Share, By End Users, 2022 (%)
- Figure 83: Spain Medical Imaging Services Market, By Value, 2019-2029 (USD Billion & CAGR)
- Figure 84: Spain Medical Imaging Services Market Value, By Modality, 2022 (USD Billion)
- Figure 85: Spain Medical Imaging Services Market Share, By Modality, By Value, 2022 (%)
- Figure 86: Spain Medical Imaging Services Market Share, By Technology, 2022 (%)
- Figure 87: Spain Medical Imaging Services Market Share, By End Users, 2022 (%)
- Figure 88: Rest of Europe Medical Imaging Services Market, By Value, 2019-2029 (USD Billion & CAGR)
- Figure 89: Rest of Europe Medical Imaging Services Market Value, By Modality, 2022 (USD Billion)
- Figure 90: Rest of Europe Medical Imaging Services Market Share, By Modality, By Value, 2022 (%)
- Figure 91: Rest of Europe Medical Imaging Services Market Share, By Technology, 2022 (%)
- Figure 92: Rest of Europe Medical Imaging Services Market Share, By End Users, 2022 (%)
- Figure 93: Asia Pacific Medical Imaging Services Market Size, By Value, 2019H-2029F (USD Billion)
- Figure 94: Asia Pacific Medical Imaging Services Market Share, By Modality, 2022 (%)
- Figure 95: Asia Pacific Medical Imaging Services Market, By X-ray, By Value, 2019H-2029F (USD Billion & CAGR)
- Figure 96: Asia Pacific Medical Imaging Services Market, By MRI, By Value, 2019H-2029F (USD Billion & CAGR)
- Figure 97: Asia Pacific Medical Imaging Services Market, By CT scan, By Value, 2019H-2029F (USD Billion & CAGR)
- Figure 98: Asia Pacific Medical Imaging Services Market, By Other Modalities, By Value, 2019H-2029F (USD Billion & CAGR)
- Figure 99: Asia Pacific Medical Imaging Services Market, By 2D, By Value, 2019H-2029F (USD Billion & CAGR)
- Figure 100: Asia Pacific Medical Imaging Services Market, By 3D/4D, By Value, 2019H-2029F (USD Billion & CAGR)
- Figure 101: Asia Pacific Medical Imaging Services Market, By Hospitals, By Value, 2019H-2029F (USD Billion & CAGR)
- Figure 102: Asia Pacific Medical Imaging Services Market, By Diagnostic Labs, By Value, 2019H-2029F (USD Billion & CAGR)
- Figure 103: Asia Pacific Medical Imaging Services Market, By Specialty Clinics, By Value, 2019H-2029F (USD Billion & CAGR)
- Figure 104: China Medical Imaging Services Market, By Value, 2019-2029 (USD Billion & CAGR)
- Figure 105: China Medical Imaging Services Market Value, By Technology, 2022 (USD Billion)
- Figure 106: China Medical Imaging Services Market Share, By Modality, By Value, 2022 (%)
- Figure 107: China Medical Imaging Services Market Share, By Technology, 2022 (%)
- Figure 108: China Medical Imaging Services Market Share, By End Users, 2022 (%)
- Figure 109: Australia Medical Imaging Services Market, By Value, 2019-2029 (USD Billion & CAGR)
- Figure 110: Australia Medical Imaging Services Market Value, By Technology, 2022 (USD Billion)
- Figure 111: Australia Medical Imaging Services Market Share, By Modality, By Value, 2022 (%)
- Figure 112: Australia Medical Imaging Services Market Share, By Technology, 2022 (%)
- Figure 113: Australia Medical Imaging Services Market Share, By End Users, 2022 (%)
- Figure 114: India Medical Imaging Services Market, By Value, 2019-2029 (USD Billion & CAGR)
- Figure 115: India Medical Imaging Services Market Value, By Technology, 2022 (USD Billion)
- Figure 116: India Medical Imaging Services Market Share, By Modality, By Value, 2022 (%)
- Figure 117: India Medical Imaging Services Market Share, By Technology, 2022 (%)
- Figure 118: India Medical Imaging Services Market Share, End Users, 2022 (%)
- Figure 119: Rest of Asia Pacific Medical Imaging Services Market, By Value, 2019-2029 (USD Billion & CAGR)
- Figure 120: Rest of Asia Pacific Medical Imaging Services Market Value, By Technology, 2022 (USD Billion)
- Figure 121: Rest of Asia Pacific Medical Imaging Services Market Share, By Modality, By Value, 2022 (%)
- Figure 122: Rest of Asia Pacific Medical Imaging Services Market Share, By Technology, 2022 (%)
- Figure 123: Rest of Asia Pacific Medical Imaging Services Market Share, By End Users, 2022 (%)
- Figure 124: Middle East and Africa Medical Imaging Services Market Size, By Value, 2019H-2029F (USD Billion)
- Figure 125: Middle East and Africa Medical Imaging Services Market Share, By Modality, 2022 (%)
- Figure 126: Middle East and Africa Medical Imaging Services Market, By X-ray, By Value, 2019H-2029F (USD Billion & CAGR)
- Figure 127: Middle East and Africa Medical Imaging Services Market, By MRI, By Value, 2019H-2029F (USD Billion & CAGR)
- Figure 128: Middle East and Africa Medical Imaging Services Market, By CT scan, By Value, 2019H-2029F (USD Billion & CAGR)
- Figure 129: Middle East and Africa Medical Imaging Services Market, By Other Modalities, By Value, 2019H-2029F (USD Billion & CAGR)
- Figure 130: Middle East and Africa Medical Imaging Services Market, By 2D, By Value, 2019H-2029F (USD Billion & CAGR)
- Figure 131: Middle East and Africa Medical Imaging Services Market, By 3D/4D, By Value, 2019H-2029F (USD Billion & CAGR)
- Figure 132: Middle East and Africa Medical Imaging Services Market, By Hospitals, By Value, 2019H-2029F (USD Billion & CAGR)
- Figure 133: Middle East and Africa Medical Imaging Services Market, By Diagnostic Labs, By Value, 2019H-2029F (USD Billion & CAGR)
- Figure 134: Middle East and Africa Medical Imaging Services Market, By Specialty Clinics, By Value, 2019H-2029F (USD Billion & CAGR)
- Figure 135: Market Share of Prominent Companies of Medical Imaging Services Market, 2022 (%)
- Figure 136: Sonic Healthcare Revenue, 2021-2023 (USD Million)
- Figure 137: Sonic Healthcare Revenue, By Business Segment, 2023 (%)
- Figure 138: Sonic Healthcare Revenue, By Geography Segment, 2023 (%)
- Figure 139: RadNet Revenue, 2020-2022 (USD Thousands)
- Figure 140: RadNet Revenue, By Business Segments, 2022 (%)
- Figure 141: Novant Health Operating Revenues, 2020-2022 (USD Thousand)
- Figure 142: Novant Health Revenues, By Sources of Revenue, 2022 (%)
- Figure 143: Akumin Inc. Revenues, 2020-2022 (USD Th)
- Figure 144: Akumin Inc. Revenue, By Business Segment, 2022 (%)
List of Tables
Table A1: United States Medical Imaging Services Market, By Modality, By Value, 2019-2022 (USD Billion)
Table A2: United States Medical Imaging Services Market, By Modality, By Value, 2023-2029 (USD Billion)
Table A3: United States Medical Imaging Services Market, By Technology, By Value, 2019-2022 (USD Billion)
Table A4: United States Medical Imaging Services Market, By Technology, By Value, 2023-2029 (USD Billion)
Table A5: United States Medical Imaging Services Market, By End Users, By Value, 2019-2022 (USD Billion)
Table A6: United States Medical Imaging Services Market, By End Users, By Value, 2023-2029 (USD Billion)
Table A7: Canada Medical Imaging Services Market, By Modality, By Value, 2019-2022 (USD Billion)
Table A8: Canada Medical Imaging Services Market, By Modality, By Value, 2023-2029 (USD Billion)
Table A9: Canada Medical Imaging Services Market, By Technology, By Value, 2019-2022 (USD Billion)
Table A10: Canada Medical Imaging Services Market, By Technology, By Value, 2023-2029 (USD Billion)
Table A11: Canada Medical Imaging Services Market, By End Users, By Value, 2019-2022 (USD Billion)
Table A12: Canada Medical Imaging Services Market, By End Users, By Value, 2023-2029 (USD Billion)
Table A13: Rest of Americas Medical Imaging Services Market, By Modality, By Value, 2019-2022 (USD Billion)
Table A14: Rest of Americas Medical Imaging Services Market, By Modality, By Value, 2023-2029 (USD Billion)
Table A15: Rest of Americas Medical Imaging Services Market, By Technology, By Value, 2019-2022 (USD Billion)
Table A16: Rest of Americas Medical Imaging Services Market, By Technology, By Value, 2023-2029 (USD Billion)
Table A17: Rest of Americas Medical Imaging Services Market, By End Users, By Value, 2019-2022 (USD Billion)
Table A18: Rest of Americas Medical Imaging Services Market, By End Users, By Value, 2023-2029 (USD Billion)
Table A19: Germany Medical Imaging Services Market, By Modality, By Value, 2019-2022 (USD Billion)
Table A20: Germany Medical Imaging Services Market, By Modality, By Value, 2023-2029 (USD Billion)
Table A21: Germany Medical Imaging Services Market, By Technology, By Value, 2019-2022 (USD Billion)
Table A22: Germany Medical Imaging Services Market, By Technology, By Value, 2023-2029 (USD Billion)
Table A23: Germany Medical Imaging Services Market, By End Users, By Value, 2019-2022 (USD Billion)
Table A24: Germany Medical Imaging Services Market, By End Users, By Value, 2023-2029 (USD Billion)
Table A25: United Kingdom Medical Imaging Services Market, By Modality, By Value, 2019-2022 (USD Billion)
Table A26: United Kingdom Medical Imaging Services Market, By Modality, By Value, 2023-2029 (USD Billion)
Table A27: United Kingdom Medical Imaging Services Market, By Technology, By Value, 2019-2022 (USD Billion)
Table A28: United Kingdom Medical Imaging Services Market, By Technology, By Value, 2023-2029 (USD Billion)
Table A29: United Kingdom Medical Imaging Services Market, By End Users, By Value, 2019-2022 (USD Billion)
Table A30: United Kingdom Medical Imaging Services Market, By End Users, By Value, 2023-2029 (USD Billion)
Table A31: France Medical Imaging Services Market, By Modality, By Value, 2019-2022 (USD Billion)
Table A32: France Medical Imaging Services Market, By Modality, By Value, 2023-2029 (USD Billion)
Table A33: France Medical Imaging Services Market, By Technology, By Value, 2019-2022 (USD Billion)
Table A34: France Medical Imaging Services Market, By Technology, By Value, 2023-2029 (USD Billion)
Table A35: France Medical Imaging Services Market, By End Users, By Value, 2019-2022 (USD Billion)
Table A36: France Medical Imaging Services Market, By End Users, By Value, 2023-2029 (USD Billion)
Table A37: Italy Medical Imaging Services Market, By Modality, By Value, 2019-2022 (USD Billion)
Table A38: Italy Medical Imaging Services Market, By Modality, By Value, 2023-2029 (USD Billion)
Table A39: Italy Medical Imaging Services Market, By Technology, By Value, 2019-2022 (USD Billion)
Table A40: Italy Medical Imaging Services Market, By Technology, By Value, 2023-2029 (USD Billion)
Table A41: Italy Medical Imaging Services Market, By End Users, By Value, 2019-2022 (USD Billion)
Table A42: Italy Medical Imaging Services Market, By End Users, By Value, 2023-2029 (USD Billion)
Table A43: Spain Medical Imaging Services Market, By Modality, By Value, 2019-2022 (USD Billion)
Table A44: Spain Medical Imaging Services Market, By Modality, By Value, 2023-2029 (USD Billion)
Table A45: Spain Medical Imaging Services Market, By Technology, By Value, 2019-2022 (USD Billion)
Table A46: Spain Medical Imaging Services Market, By Technology, By Value, 2023-2029 (USD Billion)
Table A47: Spain Medical Imaging Services Market, By End Users, By Value, 2019-2022 (USD Billion)
Table A48: Spain Medical Imaging Services Market, By End Users, By Value, 2023-2029 (USD Billion)
Table A49: Rest of Europe Medical Imaging Services Market, By Modality, By Value, 2019-2022 (USD Billion)
Table A50: Rest of Europe Medical Imaging Services Market, By Modality, By Value, 2023-2029 (USD Billion)
Table A51: Rest of Europe Medical Imaging Services Market, By Technology, By Value, 2019-2022 (USD Billion)
Table A52: Rest of Europe Medical Imaging Services Market, By Technology, By Value, 2023-2029 (USD Billion)
Table A53: Rest of Europe Medical Imaging Services Market, By End Users, By Value, 2019-2022 (USD Billion)
Table A54: Rest of Europe Medical Imaging Services Market, By End Users, By Value, 2023-2029 (USD Billion)
Table A55: China Medical Imaging Services Market, By Modality, By Value, 2019-2022 (USD Billion)
Table A56: China Medical Imaging Services Market, By Modality, By Value, 2023-2029 (USD Billion)
Table A57: China Medical Imaging Services Market, By Technology, By Value, 2019-2022 (USD Billion)
Table A58: China Medical Imaging Services Market, By Technology, By Value, 2023-2029 (USD Billion)
Table A59: China Medical Imaging Services Market, By End Users, By Value, 2019-2022 (USD Billion)
Table A60: China Medical Imaging Services Market, By End Users, By Value, 2023-2029 (USD Billion)
Table A61: Australia Medical Imaging Services Market, By Modality, By Value, 2019-2022 (USD Billion)
Table A62: Australia Medical Imaging Services Market, By Modality, By Value, 2023-2029 (USD Billion)
Table A63: Australia Medical Imaging Services Market, By Technology, By Value, 2019-2022 (USD Billion)
Table A64: Australia Medical Imaging Services Market, By Technology, By Value, 2023-2029 (USD Billion)
Table A65: Australia Medical Imaging Services Market, By End Users, By Value, 2019-2022 (USD Billion)
Table A66: Australia Medical Imaging Services Market, By End Users, By Value, 2023-2029 (USD Billion)
Table A67: India Medical Imaging Services Market, By Modality, By Value, 2019-2022 (USD Billion)
Table A68: India Medical Imaging Services Market, By Modality, By Value, 2023-2029 (USD Billion)
Table A69: India Medical Imaging Services Market, By Technology, By Value, 2019-2022 (USD Billion)
Table A70: India Medical Imaging Services Market, By Technology, By Value, 2023-2029 (USD Billion)
Table A71: India Medical Imaging Services Market, By End Users, By Value, 2019-2022 (USD Billion)
Table A72: India Medical Imaging Services Market, By End Users, By Value, 2023-2029 (USD Billion)
Table A73: Rest of Asia Pacific Medical Imaging Services Market, By Modality, By Value, 2019-2022 (USD Billion)
Table A74: Rest of Asia Pacific Medical Imaging Services Market, By Modality, By Value, 2023-2029 (USD Billion)
Table A75: Rest of Asia Pacific Medical Imaging Services Market, By Technology, By Value, 2019-2022 (USD Billion)
Table A76: Rest of Asia Pacific Medical Imaging Services Market, By Technology, By Value, 2023-2029 (USD Billion)
Table A77: Rest of Asia Pacific Medical Imaging Services Market, By End Users, By Value, 2019-2022 (USD Billion)
Table A78: Rest of Asia Pacific Medical Imaging Services Market, By End Users, By Value, 2023-2029 (USD Billion)
Table A79: Sonic Healthcare Key Company Financials, 2020-2022
Table A80: RadNet Key Company Financials, 2020-2022
Table A81: Akumin Inc. Key Financials, 2020-2022
Executive Summary
Azoth Analytics has released a research report titled "Global Medical Imaging Services Market (2024 Edition)" which provides a complete analysis of the global Medical Imaging Services industry in terms of market segmentation by Modality (X-ray, MRI, CT scan, Others), By Technology (2D, 3D/4D), By End Users (Hospitals, Diagnostic Labs, Specialty Clinics), By Region and by Country for the historical period of 2019-2022, estimates of 2023 and the forecast period of 2024-2029.
The research report covers a detailed analysis of the regions (Americas, Europe, APAC, Middle East Africa) and 10 countries (United States, Canada, Germany, United Kingdom, France, Italy, Spain, China, Australia, India). Additionally, the research report presents data including market size, yearly growth & potential analysis, the competitive study of market players, investment opportunities and demand forecast.
The research report also assesses market growth indicators, restraints, supply and demand risk, and other important statistics, as well as a full assessment of current and future market trends that are relevant to the market's evolution.
During the forecast period, 2024-2029, the Global Medical Imaging Services market is expected to grow at a CAGR of 5.3%. The Global Medical Imaging Services Market is expected to generate USD 981.5 Billion by the end of 2029.
The prevalence of chronic diseases on a global scale is a pivotal factor propelling the demand for medical imaging services. A significant driver of the global medical imaging services market is the continuous evolution and advancement of medical imaging technologies, encompassing improved resolution, speed, and the introduction of novel imaging modalities.
Additionally, accidents and their associated injuries play a noteworthy role in influencing the dynamics of the global medical imaging services market. The demand for medical imaging services experiences a significant uptick due to accidents, contributing to the expansion and evolution of the market. For instance, technologies like X-rays, CT scans, and MRI are instrumental in assessing the extent of injuries, identifying fractures, and determining the presence of internal injuries.
Scope of the Report
- The report analyses the Medical Imaging Services Market by Value (USD Billion).
- The report presents the analysis of the Medical Imaging Services Market for the historical period of 2019-2022, the estimated year 2023 and the forecast period of 2024-2029.
- The report analyses the Medical Imaging Services Market by Modality (X-ray, MRI, CT scan).
- The report analyses the Medical Imaging Services Market By Technology (2D, 3D/4D)
- The report analyses the Medical Imaging Services Market By End Users (Hospitals, Diagnostic Labs, Specialty Clinics).
- The key insights of the report have been presented through the frameworks of SWOT and Porter's Five Forces Analysis. Also, the attractiveness of the market has been presented by region, by Modality, By Technology & By End Users.
- Also, the major opportunities, trends, drivers, and challenges of the industry have been analyzed in the report.
- The report tracks competitive developments, strategies, mergers and acquisitions and new product development. The companies analysed in the report include Sonic Healthcare, Global Diagnostic Services, Inc., RadNet, Alliance Medical Limited, Novant Health, Akumin Inc., Jefferson Health, Carlisle Health Group, Vista Health, and HCA Healthcare UK.
Table of Contents
1. Market Background
- 1.1 Scope and Product Outlook
- 1.2 Executive Summary
- 1.3 Research Methodology
2. Strategic Recommendations
3. Global Medical Imaging Services Market: Historic and Forecast (2019-2029)
- 3.1 Proportion of selected age groups of the world population and in regions in 2023
- 3.2 Incidence of Cardiovascular Diseases in the World Bank Regions
- 3.3 Incidence of Osteoarthritis in the World Bank Regions
- 3.4 Incidence of Transport Injuries in the World Bank Regions
- 3.5 Global Medical Imaging Services Market: Dashboard
- 3.6 Global Medical Imaging Services Market: Market Value Assessment, 2019-2029 (USD Billion)
- 3.7 Impact of COVID-19 on Global Medical Imaging Services Market
- 3.8 Global Medical Imaging Services Market Segmentation: By Modality
- 3.8.1 Global Medical Imaging Services Market, By Modality Overview
- 3.8.2 Global Medical Imaging Services Market Size, By X-ray, By Value, 2019H-2029F (USD Billion & CAGR)
- 3.8.3 Global Medical Imaging Services Market Size, By MRI, By Value, 2019H-2029F (USD Billion & CAGR)
- 3.8.4 Global Medical Imaging Services Market Size, By CT scan, By Value, 2019H-2029F (USD Billion & CAGR)
- 3.8.5 Global Medical Imaging Services Market Size, By Other Modalities, By Value, 2019H-2029F (USD Billion & CAGR)
- 3.9 Global Medical Imaging Services Market Segmentation: By Technology
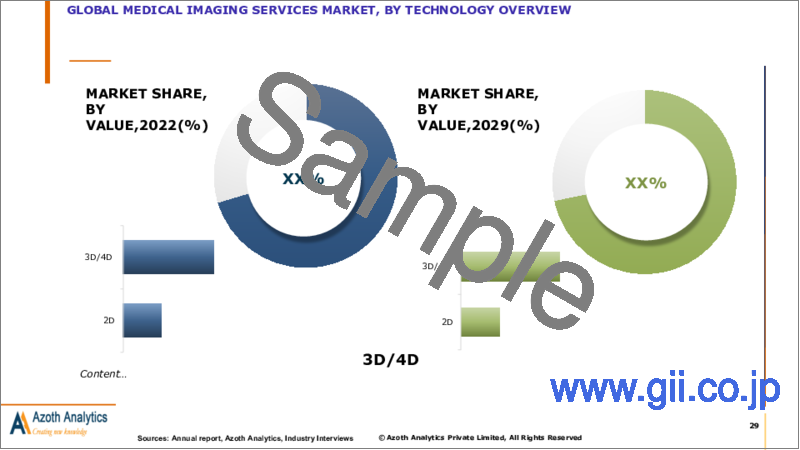
- 3.9.1 Global Medical Imaging Services Market, By Technology Overview
- 3.9.2 Global Medical Imaging Services Market Size, By 2D, By Value, 2019H-2029F (USD Billion & CAGR)
- 3.9.3 Global Medical Imaging Services Market Size, By 3D/4D, By Value, 2019H-2029F (USD Billion & CAGR)
- 3.10 Global Medical Imaging Services Market Segmentation: By End Users
- 3.10.1 Global Medical Imaging Services Market, By End Users Overview
- 3.10.2 Global Medical Imaging Services Market Size, By Hospitals By Value, 2019H-2029F (USD Billion & CAGR)
- 3.10.3 Global Medical Imaging Services Market Size, By Diagnostic Labs, By Value, 2019H-2029F (USD Billion & CAGR)
- 3.10.4 Global Medical Imaging Services Market Size, By Specialty Clinics, By Value, 2019H-2029F (USD Billion & CAGR)
4. Global Medical Imaging Services Market, Region Analysis
- 4.1 Regional Coverage of the Study
- 4.2 Regional Snapshot
5. Americas Medical Imaging Services Market: Historic and Forecast (2019-2029)
- 5.1 Americas Medical Imaging Services Market: Snapshot
- 5.2 Americas Medical Imaging Services Market: Market Size and CAGR, 2019-2029 (USD Billion & CAGR)
- 5.3 Americas Medical Imaging Services Market: Key Factors
- 5.4 Americas Medical Imaging Services Market: Segment Analysis
- 5.5 Americas Medical Imaging Services Market Segmentation: By Modality
- 5.5.1 Americas Medical Imaging Services Market, By Modality Overview
- 5.5.2 Americas Medical Imaging Services Market Size, By X-ray, By Value, 2019H-2029F (USD Billion & CAGR)
- 5.5.3 Americas Medical Imaging Services Market Size, By MRI, By Value, 2019H-2029F (USD Billion & CAGR)
- 5.5.4 Americas Medical Imaging Services Market Size, By CT scan, By Value, 2019H-2029F (USD Billion & CAGR)
- 5.5.5 Americas Medical Imaging Services Market Size, By Other Modalities, By Value, 2019H-2029F (USD Billion & CAGR)
- 5.6 Americas Medical Imaging Services Market Segmentation: By Technology
- 5.6.1 Americas Medical Imaging Services Market, By Technology Overview
- 5.6.2 Americas Medical Imaging Services Market Size, By 2D, By Value, 2019H-2029F (USD Billion & CAGR)
- 5.6.3 Americas Medical Imaging Services Market Size, By 3D/4D, By Value, 2019H-2029F (USD Billion & CAGR)
- 5.7 Americas Medical Imaging Services Market Segmentation: By End Users
- 5.7.1 Americas Medical Imaging Services Market, By End Users Overview
- 5.7.2 Americas Medical Imaging Services Market Size, By Hospitals, By Value, 2019H-2029F (USD Billion & CAGR)
- 5.7.3 Americas Medical Imaging Services Market Size, By Diagnostic Labs, By Value, 2019H-2029F (USD Billion & CAGR)
- 5.7.4 Americas Medical Imaging Services Market Size, By Specialty Clinics, By Value, 2019H-2029F (USD Billion & CAGR)
- 5.8 Americas Medical Imaging Services Market Segmentation: By Country
- 5.8.1 United States Medical Imaging Services Market: Market Size and CAGR, 2019-2029 (USD Billion & CAGR)
- 5.8.1.1 United States Medical Imaging Services Market, By Modality
- 5.8.1.2 United States Medical Imaging Services Market, By Technology
- 5.8.1.3 United States Medical Imaging Services Market, By End Users
- 5.8.2 Canada Medical Imaging Services Market: Market Size and CAGR, 2019-2029 (USD Billion & CAGR)
- 5.8.2.1 Canada Medical Imaging Services Market, By Modality
- 5.8.2.2 Canada Medical Imaging Services Market, By Technology
- 5.8.2.3 Canada Medical Imaging Services Market, By End Users
- 5.8.3 Rest of Americas Medical Imaging Services Market: Market Size and CAGR, 2019-2029 (USD Billion & CAGR)
- 5.8.3.1 Rest of Americas Medical Imaging Services Market, By Modality
- 5.8.3.2 Rest of Americas Medical Imaging Services Market, By Technology
- 5.8.3.3 Rest of Americas Medical Imaging Services Market, By End Users
- 5.8.1 United States Medical Imaging Services Market: Market Size and CAGR, 2019-2029 (USD Billion & CAGR)
6. Europe Medical Imaging Services Market: Historic and Forecast (2019-2029)
- 6.1 Europe Medical Imaging Services Market: Snapshot
- 6.2 Europe Medical Imaging Services Market: Market Size and CAGR, 2019-2029 (USD Billion & CAGR)
- 6.3 Europe Medical Imaging Services Market: Key Factors
- 6.4 Europe Medical Imaging Services Market: Segment Analysis
- 6.5 Europe Medical Imaging Services Market Segmentation: By Modality
- 6.5.1 Europe Medical Imaging Services Market, By Modality Overview
- 6.5.2 Europe Medical Imaging Services Market Size, By X-ray, By Value, 2019H-2029F (USD Billion & CAGR)
- 6.5.3 Europe Medical Imaging Services Market Size, By MRI, By Value, 2019H-2029F (USD Billion & CAGR)
- 6.5.4 Europe Medical Imaging Services Market Size, By CT scan, By Value, 2019H-2029F (USD Billion & CAGR)
- 6.5.5 Europe Medical Imaging Services Market Size, By Other Modalities, By Value, 2019H-2029F (USD Billion & CAGR)
- 6.6 Europe Medical Imaging Services Market Segmentation: By Technology
- 6.6.1 Europe Medical Imaging Services Market, By Technology Overview
- 6.6.2 Europe Medical Imaging Services Market Size, By 2D, By Value, 2019H-2029F (USD Billion & CAGR)
- 6.6.3 Europe Medical Imaging Services Market Size, By 3D/4D, By Value, 2019H-2029F (USD Billion & CAGR)
- 6.7 Europe Medical Imaging Services Market Segmentation: By End Users
- 6.7.1 Europe Medical Imaging Services Market, By End Users Overview
- 6.7.2 Europe Medical Imaging Services Market Size, By Hospitals, By Value, 2019H-2029F (USD Billion & CAGR)
- 6.7.3 Europe Medical Imaging Services Market Size, By Diagnostic Labs, By Value, 2019H-2029F (USD Billion & CAGR)
- 6.7.4 Europe Medical Imaging Services Market Size, By Specialty Clinics, By Value, 2019H-2029F (USD Billion & CAGR)
- 6.8 Europe Medical Imaging Services Market Segmentation: By Country
- 6.8.1 Germany Medical Imaging Services Market: Market Size and CAGR, 2019-2029 (USD Billion & CAGR)
- 6.8.1.1 Germany Medical Imaging Services Market, By Modality
- 6.8.1.2 Germany Medical Imaging Services Market, By Technology
- 6.8.1.3 Germany Medical Imaging Services Market, By End Users
- 6.8.2 United Kingdom Medical Imaging Services Market: Market Size and CAGR, 2019-2029 (USD Billion & CAGR)
- 6.8.2.1 United Kingdom Medical Imaging Services Market, By Modality
- 6.8.2.2 United Kingdom Medical Imaging Services Market, By Technology
- 6.8.2.3 United Kingdom Medical Imaging Services Market, By End Users
- 6.8.3 France Medical Imaging Services Market: Market Size and CAGR, 2019-2029 (USD Billion & CAGR)
- 6.8.3.1 France Medical Imaging Services Market, By Modality
- 6.8.3.2 France Medical Imaging Services Market, By Technology
- 6.8.3.3 France Medical Imaging Services Market, By End Users
- 6.8.4 Italy Medical Imaging Services Market: Market Size and CAGR, 2019-2029 (USD Billion & CAGR)
- 6.8.4.1 Italy Medical Imaging Services Market, By Modality
- 6.8.4.2 Italy Medical Imaging Services Market, By Technology
- 6.8.4.3 Italy Medical Imaging Services Market, By End Users
- 6.8.5 Spain Medical Imaging Services Market: Market Size and CAGR, 2019-2029 (USD Billion & CAGR)
- 6.8.5.1 Spain Medical Imaging Services Market, By Modality
- 6.8.5.2 Spain Medical Imaging Services Market, By Technology
- 6.8.5.3 Spain Medical Imaging Services Market, By End Users
- 6.8.6 Rest of Europe Medical Imaging Services Market: Market Size and CAGR, 2019-2029 (USD Billion & CAGR)
- 6.8.6.1 Rest of Europe Medical Imaging Services Market, By Modality
- 6.8.6.2 Rest of Europe Medical Imaging Services Market, By Technology
- 6.8.6.3 Rest of Europe Medical Imaging Services Market, By End Users
- 6.8.1 Germany Medical Imaging Services Market: Market Size and CAGR, 2019-2029 (USD Billion & CAGR)
7. Asia-Pacific Medical Imaging Services Market: Historic and Forecast (2019-2029)
- 7.1 Asia-Pacific Medical Imaging Services Market: Snapshot
- 7.2 Asia-Pacific Medical Imaging Services Market: Market Size and CAGR, 2019-2029 (USD Billion & CAGR)
- 7.3 Asia-Pacific Medical Imaging Services Market: Key Factors
- 7.4 Asia-Pacific Medical Imaging Services Market: Segment Analysis
- 7.5 Asia-Pacific Medical Imaging Services Market Segmentation: By Modality
- 7.5.1 Asia-Pacific Medical Imaging Services Market, By Modality Overview
- 7.5.2 Asia-Pacific Medical Imaging Services Market Size, By X-ray, By Value, 2019H-2029F (USD Billion & CAGR)
- 7.5.3 Asia-Pacific Medical Imaging Services Market Size, By MRI, By Value, 2019H-2029F (USD Billion & CAGR)
- 7.5.4 Asia-Pacific Medical Imaging Services Market Size, By CT scan, By Value, 2019H-2029F (USD Billion & CAGR)
- 7.5.5 Asia-Pacific Medical Imaging Services Market Size, By Other Modalities, By Value, 2019H-2029F (USD Billion & CAGR)
- 7.6 Asia-Pacific Medical Imaging Services Market Segmentation: By Technology
- 7.6.1 Asia-Pacific Medical Imaging Services Market, By Technology Overview
- 7.6.2 Asia-Pacific Medical Imaging Services Market Size, By 2D, By Value, 2019H-2029F (USD Billion & CAGR)
- 7.6.3 Asia-Pacific Medical Imaging Services Market Size, By 3D/4D, By Value, 2019H-2029F (USD Billion & CAGR)
- 7.7 Asia-Pacific Medical Imaging Services Market Segmentation: By End Users
- 7.7.1 Asia-Pacific Medical Imaging Services Market, By End Users Overview
- 7.7.2 Asia-Pacific Medical Imaging Services Market Size, By Hospitals, By Value, 2019H-2029F (USD Billion & CAGR)
- 7.7.3 Asia-Pacific Medical Imaging Services Market Size, By Diagnostic Labs, By Value, 2019H-2029F (USD Billion & CAGR)
- 7.7.4 Asia-Pacific Medical Imaging Services Market Size, By Specialty Clinics, By Value, 2019H-2029F (USD Billion & CAGR)
- 7.8 Asia-Pacific Medical Imaging Services Market Segmentation: By Country
- 7.8.1 China Medical Imaging Services Market: Market Size and CAGR, 2019-2029 (USD Billion & CAGR)
- 7.8.1.1 China Medical Imaging Services Market, By Modality
- 7.8.1.2 China Medical Imaging Services Market, By Technology
- 7.8.1.3 China Medical Imaging Services Market, By End Users
- 7.8.2 Australia Medical Imaging Services Market: Market Size and CAGR, 2019-2029 (USD Billion & CAGR)
- 7.8.1.1 Australia Medical Imaging Services Market, By Modality
- 7.8.1.2 Australia Medical Imaging Services Market, By Technology
- 7.8.1.3 Australia Medical Imaging Services Market, By End Users
- 7.8.3 India Medical Imaging Services Market: Market Size and CAGR, 2019-2029 (USD Billion & CAGR)
- 7.8.3.1 India Medical Imaging Services Market, By Modality
- 7.8.3.2 India Medical Imaging Services Market, By Technology
- 7.8.3.3 India Medical Imaging Services Market, By End Users
- 7.8.4 Rest of Asia-Pacific Medical Imaging Services Market: Market Size and CAGR, 2019-2029 (USD Billion & CAGR)
- 7.8.4.1 Rest of Asia-Pacific Medical Imaging Services Market, By Modality
- 7.8.4.2 Rest of Asia-Pacific Medical Imaging Services Market, By Technology
- 7.8.4.3 Rest of Asia-Pacific Medical Imaging Services Market, By End Users
- 7.8.1 China Medical Imaging Services Market: Market Size and CAGR, 2019-2029 (USD Billion & CAGR)
8. Middle-East & Africa Medical Imaging Services Market: Historic and Forecast (2019-2029)
- 8.1 Middle-East & Africa Medical Imaging Services Market: Snapshot
- 8.2 Middle-East & Africa Medical Imaging Services Market: Market Size and CAGR, 2019-2029 (USD Billion & CAGR)
- 8.3 Middle-East & Africa Medical Imaging Services Market: Key Factors
- 8.4 Middle-East & Africa Medical Imaging Services Market: Segment Analysis
- 8.5 Middle-East & Africa Medical Imaging Services Market Segmentation: By Modality
- 8.5.1 Middle-East & Africa Medical Imaging Services Market, By Modality Overview
- 8.5.2 Middle-East & Africa Medical Imaging Services Market Size, By X-ray, By Value, 2019H-2029F (USD Billion & CAGR)
- 8.5.3 Middle-East & Africa Medical Imaging Services Market Size, By MRI, By Value, 2019H-2029F (USD Billion & CAGR)
- 8.5.4 Middle-East & Africa Medical Imaging Services Market Size, By CT scan, By Value, 2019H-2029F (USD Billion & CAGR)
- 8.5.5 Middle-East & Africa Medical Imaging Services Market Size, By Other Modalities, By Value, 2019H-2029F (USD Billion & CAGR)
- 8.6 Middle-East & Africa Medical Imaging Services Market Segmentation: By Technology
- 8.6.1 Middle-East & Africa Medical Imaging Services Market, By Technology Overview
- 8.6.2 Middle-East & Africa Medical Imaging Services Market Size, By 2D, By Value, 2019H-2029F (USD Billion & CAGR)
- 8.6.3 Middle-East & Africa Medical Imaging Services Market Size, By 3D/4D, By Value, 2019H-2029F (USD Billion & CAGR)
- 8.7 Middle-East & Africa Medical Imaging Services Market Segmentation: By End Users
- 8.7.1 Middle-East & Africa Medical Imaging Services Market, By End Users: Overview
- 8.7.2 Middle-East & Africa Medical Imaging Services Market Size, By Hospitals, By Value, 2019H-2029F (USD Billion & CAGR)
- 8.7.3 Middle-East & Africa Medical Imaging Services Market Size, By Diagnostic Labs, By Value, 2019H-2029F (USD Billion & CAGR)
- 8.7.4 Middle-East & Africa Medical Imaging Services Market Size, By Specialty Clinics, By Value, 2019H-2029F (USD Billion & CAGR)
9. Market Dynamics
- 9.1 Impact Assessment of Market Dynamics on the Global Medical Imaging Services Market
- 9.2 Drivers
- 9.3 Restraints
- 9.4 Trends
10. Porter's Five Forces Analysis
- 10.1 Porter's Five Forces Model
11. Competitive Positioning
- 11.1 Companies' Product Positioning
- 11.2 Market Position Matrix
- 11.3 Market Share Analysis of Medical Imaging Services Market
- 11.4 Company Profiles
- 11.4.1 Sonic Healthcare
- 11.4.2 Global Diagnostic Services, Inc.
- 11.4.3 RadNet
- 11.4.4 Alliance Medical Limited
- 11.4.5 Novant Health
- 11.4.6 Akumin Inc.
- 11.4.7 Jefferson Health.
- 11.4.8 Carlisle Health Group
- 11.4.9 Vista Health
- 11.4.10 HCA Healthcare UK
