
生コン市場の市場機会、成長促進要因、産業動向分析、2025年~2034年予測
Ready-mix Concrete Market Opportunity, Growth Drivers, Industry Trend Analysis, and Forecast 2025 - 2034- 発行日
- ページ情報
- 英文 365 Pages
- 納期
- 2~3営業日
- 商品コード
- 1721608
- カスタマイズ可能 お客様のご希望に応じて、既存データの加工や未掲載情報(例:国別セグメント)の追加などの対応が可能です。詳細はお問い合わせください。
- 翻訳ツール提供対象 PDF対応AI翻訳ツールの無料貸し出しサービスのご利用が可能です
概要
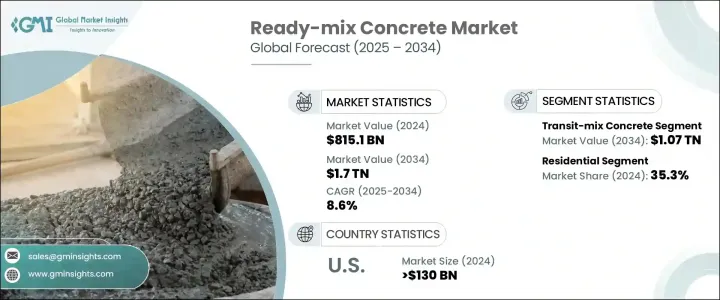
世界の生コン市場は、2024年には8,151億米ドルとなり、急速な都市拡大、人口増加、新たなインフラ整備の急務を背景に、CAGR 8.6%で成長し、2034年には1兆7,000億米ドルに達すると推定されます。
都市の膨張と近代化が進むにつれて、効率的で耐久性があり、持続可能な建材への需要が急増しています。生コンは、強度、利便性、環境効率の完璧な融合を提供する、重要なソリューションとして急速に台頭しています。老朽化したインフラを改善するための政府の取り組み、商業用不動産への民間投資、活況を呈する住宅建設セクターのすべてが、その勢いに拍車をかけています。グリーン建設や持続可能な都市計画が重視されるようになり、高性能コンクリート・ソリューションの需要がさらに高まっています。生コンは、安定した品質を提供し、現場での労力を最小限に抑え、材料の無駄を省くことができるため、スピード、精度、耐久性が譲れない現代の建設ニーズに適した材料となっています。さらに同市場は、スマート・バッチング・システム、環境に優しいミックス、デジタル化されたサプライ・チェーンなど、コンクリート技術の進歩の恩恵を受けており、これらはすべて作業効率の向上と進化する規制基準への適合を目的としています。
高速道路やトンネルから空港や地下鉄に至るまで、大規模なインフラ・プロジェクトが市場成長の推進に極めて重要な役割を果たしています。コンクリートは、その強度と多様な気候帯や多様な用途に対応する汎用性により、依然として不可欠な存在です。新興経済諸国も先進経済諸国も、ヘルスケアセンター、教育機関、交通ハブなどの新しい公共施設に対するニーズの高まりを目の当たりにしており、生コンソリューションの採用を加速させています。管理された環境で生産される生コンは、住宅および商業建築において、優れた性能、迅速な施工、比類のない信頼性を保証します。
| 市場範囲 | |
|---|---|
| 開始年 | 2024 |
| 予測年 | 2025-2034 |
| 開始金額 | 8,151億米ドル |
| 予測金額 | 1兆7,000億米ドル |
| CAGR | 8.6% |
トランジットミックスコンクリートは、2024年に5,244億米ドルを売り上げて世界市場をリードし、2034年には1兆700億米ドルに達すると予測されています。そのリーダーシップは、輸送の容易さ、一貫したバッチ品質、幅広いプロジェクトへの適応性に起因します。輸送中に混合されるこのタイプのコンクリートは、現場での複雑なバッチ作業を排除し、遠隔地であっても製品の完全性を維持します。その多用途性は、小規模な住宅から広大な複合商業施設まで、幅広いプロジェクトをサポートしています。
2024年の最終用途需要は住宅部門が圧倒的に多く、世界の生コン市場で35.3%のシェアを占めています。都市部への移住が急増し、新しい住宅開発への需要が絶え間なく高まっていることが主な要因です。都市が拡大するにつれ、耐久性に優れ、メンテナンスの少ない建設ソリューションへのニーズが高まっており、その中でも生コンは信頼できる強度と建設効率の高さで際立っています。
米国の生コン市場は2024年に1,300億米ドルを生み出し、2034年までCAGR 8%で成長すると予想されています。郊外地域の拡大、住宅リフォーム動向の増加、都市再生イニシアティブへの強い関心も、国全体の需要を大幅に押し上げています。
世界の生コン業界の主要企業には、ハイデルベルグ・マテリアルズ、ディロン・ブラザーズ・レディーミックス・コンクリート、CEMEX、米国コンクリート、HOLCIM、R.W.シドレー、リビングストンズ・コンクリート・サービス、ACCリミテッド、ウルトラテック・セメント、Buzzi、Vicat、China National Building Material Group Corporation、Barney &Dickensonなどがあります。主要企業は、垂直統合戦略の採用、地域別生産拠点の拡大、持続可能な製品イノベーションへの巨額投資により、市場での存在感を強めています。M&Aは、地理的範囲と技術的能力を拡大するための戦略として依然として好まれており、一方、デジタル技術の進歩によってバッチ処理と配送業務が合理化されつつあります。低炭素で高性能なコンクリートソリューションの革新もまた、プレーヤーが進化する環境基準を満たし、近代建設の需要に応えるのに役立っています。
目次
第1章 調査手法と範囲
第2章 エグゼクティブサマリー
第3章 業界考察
- エコシステム分析
- バリューチェーンに影響を与える要因
- 利益率分析
- ディスラプション
- 将来の展望
- 製造業者
- 販売代理店
- トランプ政権の関税の影響- 構造化された概要
- 貿易への影響
- 貿易量の混乱
- 報復措置
- 業界への影響
- 供給側の影響(原材料)
- 主要原材料の価格変動
- サプライチェーンの再構築
- 生産コストへの影響
- 需要側の影響(販売価格)
- 最終市場への価格伝達
- 市場シェアの動向
- 消費者の反応パターン
- 供給側の影響(原材料)
- 影響を受ける主要企業
- 戦略的な業界対応
- サプライチェーンの再構成
- 価格設定と製品戦略
- 政策関与
- 展望と今後の検討事項
- 貿易への影響
- 貿易統計(HSコード:38245010)
注:上記の貿易統計は主要国について提供されます
- サプライヤーの情勢
- 利益率分析
- 主なニュースと取り組み
- 規制情勢
- 影響要因
- 促進要因
- 都市化とインフラ整備の開発
- 持続可能で環境に優しい建設に対する需要の高まり
- 建設における時間とコストの効率
- 業界の潜在的リスク&課題
- 物流と輸送コストの高さ
- 促進要因
- 成長可能性分析
- ポーターの分析
- PESTEL分析
第4章 競合情勢
- イントロダクション
- 企業の市場シェア分析
- 競合ポジショニングマトリックス
- 戦略的展望マトリックス
第5章 市場規模・予測:タイプ別、2021-2034
- 主要動向
- トランジットミックスコンクリート
- 収縮ミックスコンクリート
- 中央混合コンクリート
第6章 市場規模・予測:用途別、2021-2034
- 主要動向
- 商業用
- インフラストラクチャー
- 住宅用
- 産業
第7章 市場規模・予測:生産別、2021-2034
- 主要動向
- 現場
- オフサイト
第8章 市場規模・予測:地域別、2021-2034
- 主要動向
- 北米
- 米国
- カナダ
- 欧州
- 英国
- ドイツ
- フランス
- イタリア
- スペイン
- アジア太平洋地域
- 中国
- インド
- 日本
- 韓国
- オーストラリア
- ラテンアメリカ
- ブラジル
- メキシコ
- アルゼンチン
- 中東・アフリカ
- 南アフリカ
- サウジアラビア
- アラブ首長国連邦
第9章 企業プロファイル
- ACC Limited
- Barney &Dickenson
- Buzzi
- CEMEX
- China National Building Material Group Corporation
- Dillon Bros Ready Mix Concrete
- Heidelberg Materials
- HOLCIM
- Livingston's Concrete Service
- R.W. Sidley
- U.S. Concrete
- UltraTech Cement
- Vicat
目次
The Global Ready-Mix Concrete Market was valued at USD 815.1 billion in 2024 and is estimated to grow at a CAGR of 8.6% to reach USD 1.7 trillion by 2034, driven by rapid urban expansion, rising populations, and an urgent need for new infrastructure. As cities continue to swell and modernize, the demand for efficient, durable, and sustainable building materials is soaring. Ready-mix concrete is rapidly emerging as a critical solution, offering the perfect blend of strength, convenience, and environmental efficiency. Government initiatives to upgrade aging infrastructure, private investments in commercial real estate, and a booming residential construction sector are all fueling momentum. The increasing emphasis on green construction and sustainable urban planning further boosts demand for high-performance concrete solutions. Ready-mix concrete's ability to deliver consistent quality, minimize on-site labor, and reduce material waste makes it the material of choice for contemporary construction needs, where speed, precision, and durability are non-negotiable. Moreover, the market is benefiting from advancements in concrete technology, including smart batching systems, eco-friendly mixes, and digitalized supply chains, all aimed at enhancing operational efficiency and meeting evolving regulatory standards.
Large-scale infrastructure projects, from highways and tunnels to airports and metro systems, are playing a pivotal role in driving market growth. Concrete remains indispensable due to its strength and versatility across varied climate zones and diverse applications. Both emerging and developed economies are witnessing a heightened need for new public facilities, such as healthcare centers, educational institutions, and transportation hubs, thereby accelerating the adoption of ready-mix concrete solutions. Produced in controlled environments, ready-mix concrete ensures superior performance, faster application, and unmatched reliability across residential and commercial construction.
| Market Scope | |
|---|---|
| Start Year | 2024 |
| Forecast Year | 2025-2034 |
| Start Value | $815.1 Billion |
| Forecast Value | $1.7 Trillion |
| CAGR | 8.6% |
Transit mix concrete led the global market by generating USD 524.4 billion in 2024 and is projected to reach USD 1.07 trillion by 2034. Its leadership stems from the ease of transport, consistent batch quality, and adaptability to a wide range of projects. Mixed while in transit, this type of concrete eliminates the complexities of on-site batching and maintains product integrity, even in remote locations. Its versatility supports projects ranging from small residential builds to sprawling commercial complexes.
The residential sector dominated end-use demand in 2024, capturing a 35.3% share of the global ready-mix concrete market. The surge in urban migration and the unrelenting demand for new housing developments are key contributors. As cities expand, the need for durable, low-maintenance construction solutions grows, with ready-mix concrete standing out for its reliable strength and construction efficiency.
The United States Ready-Mix Concrete Market generated USD 130 billion in 2024 and is expected to grow at a CAGR of 8% through 2034, supported by robust federal and state investments in infrastructure upgrades alongside a rise in residential and mixed-use developments. Expanding suburban areas, increasing home renovation trends, and a strong focus on urban renewal initiatives are also significantly boosting demand across the country.
Key players in the Global Ready-Mix Concrete Industry include Heidelberg Materials, Dillon Bros Ready Mix Concrete, CEMEX, U.S. Concrete, HOLCIM, R.W. Sidley, Livingston's Concrete Service, ACC Limited, UltraTech Cement, Buzzi, Vicat, China National Building Material Group Corporation, and Barney & Dickenson. Leading companies are reinforcing their market presence by adopting vertical integration strategies, expanding regional production footprints, and investing heavily in sustainable product innovations. Mergers and acquisitions remain a favored strategy to broaden geographic reach and technological capabilities, while digital advancements are streamlining batching and delivery operations. Innovation in low-carbon and high-performance concrete solutions is also helping players meet evolving environmental standards and cater to the demands of modern construction.
Table of Contents
Chapter 1 Methodology & Scope
- 1.1 Market scope & definition
- 1.2 Base estimates & calculations
- 1.3 Forecast calculation
- 1.4 Data sources
- 1.4.1 Primary
- 1.4.2 Secondary
- 1.4.2.1 Paid sources
- 1.4.2.2 Public sources
Chapter 2 Executive Summary
- 2.1 Industry synopsis, 2021 - 2034
Chapter 3 Industry Insights
- 3.1 Industry ecosystem analysis
- 3.1.1 Factor affecting the value chain
- 3.1.2 Profit margin analysis
- 3.1.3 Disruptions
- 3.1.4 Future outlook
- 3.1.5 Manufacturers
- 3.1.6 Distributors
- 3.2 Impact of trump administration tariffs – structured overview
- 3.2.1 Impact on trade
- 3.2.1.1 Trade volume disruptions
- 3.2.1.2 Retaliatory measures
- 3.2.2 Impact on the industry
- 3.2.2.1 Supply-Side impact (Raw Materials)
- 3.2.2.1.1 Price volatility in key materials
- 3.2.2.1.2 Supply chain restructuring
- 3.2.2.1.3 Production cost implications
- 3.2.2.2 Demand-Side impact (Selling Price)
- 3.2.2.2.1.1 Price transmission to end markets
- 3.2.2.2.1.2 Market share dynamics
- 3.2.2.2.1.3 Consumer response patterns
- 3.2.2.1 Supply-Side impact (Raw Materials)
- 3.2.3 Key companies impacted
- 3.2.4 Strategic industry responses
- 3.2.4.1 Supply chain reconfiguration
- 3.2.4.2 Pricing and product strategies
- 3.2.4.3 Policy engagement
- 3.2.5 Outlook and future considerations
- 3.2.1 Impact on trade
- 3.3 Trade statistics (HS Code: 38245010)
Note: the above trade statistics will be provided for key countries
- 3.4 Supplier landscape
- 3.5 Profit margin analysis
- 3.6 Key news & initiatives
- 3.7 Regulatory landscape
- 3.8 Impact forces
- 3.8.1 Growth drivers
- 3.8.1.1 Rising urbanization and infrastructure development
- 3.8.1.2 Growing demand for sustainable and green construction
- 3.8.1.3 Time and cost efficiency in construction
- 3.8.2 Industry pitfalls & challenges
- 3.8.2.1 High logistics and transportation costs
- 3.8.1 Growth drivers
- 3.9 Growth potential analysis
- 3.10 Porter’s analysis
- 3.11 PESTEL analysis
Chapter 4 Competitive Landscape, 2024
- 4.1 Introduction
- 4.2 Company market share analysis
- 4.3 Competitive positioning matrix
- 4.4 Strategic outlook matrix
Chapter 5 Market Size and Forecast, By Type, 2021 - 2034 (USD Million) (Tons)
- 5.1 Key trends
- 5.2 Transit mix concrete
- 5.3 Shrink mix concrete
- 5.4 Central mix concrete
Chapter 6 Market Size and Forecast, By Application, 2021 - 2034 (USD Million) (Tons)
- 6.1 Key trends
- 6.2 Commercial
- 6.3 Infrastructure
- 6.4 Residential
- 6.5 Industrial
Chapter 7 Market Size and Forecast, By Production, 2021 - 2034 (USD Million) (Tons)
- 7.1 Key trends
- 7.2 On-site
- 7.3 Off-site
Chapter 8 Market Size and Forecast, By Region, 2021 - 2034 (USD Million) (Tons)
- 8.1 Key trends
- 8.2 North America
- 8.2.1 U.S.
- 8.2.2 Canada
- 8.3 Europe
- 8.3.1 UK
- 8.3.2 Germany
- 8.3.3 France
- 8.3.4 Italy
- 8.3.5 Spain
- 8.4 Asia Pacific
- 8.4.1 China
- 8.4.2 India
- 8.4.3 Japan
- 8.4.4 South Korea
- 8.4.5 Australia
- 8.5 Latin America
- 8.5.1 Brazil
- 8.5.2 Mexico
- 8.5.3 Argentina
- 8.6 MEA
- 8.6.1 South Africa
- 8.6.2 Saudi Arabia
- 8.6.3 UAE
Chapter 9 Company Profiles
- 9.1 ACC Limited
- 9.2 Barney & Dickenson
- 9.3 Buzzi
- 9.4 CEMEX
- 9.5 China National Building Material Group Corporation
- 9.6 Dillon Bros Ready Mix Concrete
- 9.7 Heidelberg Materials
- 9.8 HOLCIM
- 9.9 Livingston's Concrete Service
- 9.10 R.W. Sidley
- 9.11 U.S. Concrete
- 9.12 UltraTech Cement
- 9.13 Vicat
- 発行日
- 発行
- Global Market Insights Inc.
- ページ情報
- 英文 365 Pages
- 納期
- 2~3営業日