
|
市場調査レポート
商品コード
1913412
自動車向けハイパーバイザー市場の機会、成長要因、業界動向分析、および2026年から2035年までの予測Automotive Hypervisor Market Opportunity, Growth Drivers, Industry Trend Analysis, and Forecast 2026 - 2035 |
||||||
カスタマイズ可能
|
|||||||
| 自動車向けハイパーバイザー市場の機会、成長要因、業界動向分析、および2026年から2035年までの予測 |
|
出版日: 2026年01月05日
発行: Global Market Insights Inc.
ページ情報: 英文 240 Pages
納期: 2~3営業日
|

概要
世界の自動車用ハイパーバイザー市場は、2025年に4億7,890万米ドルと評価され、2035年までにCAGR34.9%で成長し、94億1,000万米ドルに達すると予測されています。
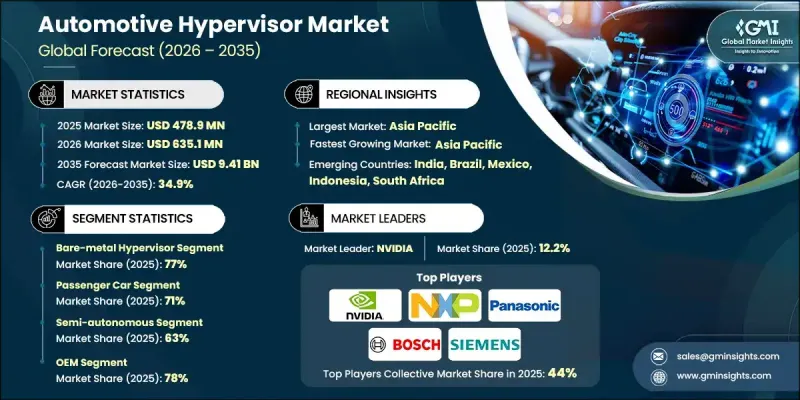
市場拡大の背景には、自動車業界がハードウェア中心の車両アーキテクチャから、集中型コンピューティングプラットフォームを基盤としたソフトウェア定義車両へと構造転換していることが挙げられます。自動車メーカーは、共有コンピューティング環境上で複数のオペレーティングシステムやアプリケーションをサポートするため、自動車用ハイパーバイザーへの依存度を高めています。この移行により、ソフトウェア導入サイクルの迅速化、スケーラビリティの向上、複数車両プラットフォームへの機能導入における柔軟性の拡大が実現しています。集中型コンピューティングへの移行は、システム設計の簡素化、複雑性の低減、ソフトウェアライフサイクル管理の効率化も支えています。車両がより接続性が高く、インテリジェントで、ソフトウェア主導となるにつれ、ハイパーバイザーは、安全なワークロード管理、パフォーマンス最適化、将来を見据えた車両アーキテクチャを支える基盤技術として台頭しています。デジタル車両プラットフォームや次世代モビリティソリューションへの投資拡大が導入をさらに加速させており、自動車用ハイパーバイザーは現代の自動車イノベーションを可能にする重要な要素として位置づけられています。
| 市場範囲 | |
|---|---|
| 開始年 | 2025年 |
| 予測年度 | 2026-2035 |
| 開始時価値 | 4億7,890万米ドル |
| 予測金額 | 94億1,000万米ドル |
| CAGR | 34.9% |
ADAS(先進運転支援システム)の複雑化と自律移動への進展に伴い、安全上重要なアプリケーションとそうでないアプリケーションの厳格な分離の必要性が高まっています。自動車向けハイパーバイザープラットフォームは、ワークロードの安全な分離を可能にし、機能安全要件を満たしながら予測可能なシステム動作を保証するとされています。メーカー各社は、車両アーキテクチャの合理化、配線複雑さの削減、エネルギー消費の低減、システム全体の効率向上を図るため、複数の電子制御ユニットを少数のドメインコントローラおよび中央コントローラに統合しています。
ベアメタルハイパーバイザーセグメントは2025年に77%のシェアを占め、2026年から2035年にかけてCAGR34.3%で成長すると予測されています。このセグメントは、車両ハードウェアと直接連携できる能力により、応答遅延を最小限に抑え、安全重視の自動車アプリケーションに不可欠なリアルタイムシステム性能をサポートするため、注目を集めています。
乗用車セグメントは2025年に71%のシェアを占め、2035年までCAGR35.5%で成長すると予測されています。コネクテッドサービスや仮想化されたインフォテインメント環境への需要増加が、統一された車載コンピューティングシステム内で複数のアプリケーションを動作させるハイパーバイザーベースのプラットフォーム導入を促進しています。
米国自動車ハイパーバイザー市場は2025年に1億980万米ドルに達しました。同国における成長は、コネクテッドカー、自動運転、ソフトウェア定義車両の開発に注力する自動車メーカーおよび技術プロバイダーからの強力な投資によって支えられています。
よくあるご質問
目次
第1章 調査手法
第2章 エグゼクティブサマリー
第3章 業界考察
- エコシステム分析
- サプライヤーの情勢
- 利益率
- コスト構造
- 各段階における付加価値
- バリューチェーンに影響を与える要因
- ディスラプション
- 業界への影響要因
- 促進要因
- ソフトウェア定義車両(SDV)への移行
- ADASおよび自動運転機能の統合の進展
- ECU統合とコスト最適化
- 機能安全とサイバーセキュリティへの注目の高まり
- 業界の潜在的リスク&課題
- 高集積化と検証の複雑性
- 限定的なアフターマーケットでの採用
- 市場機会
- 集中型およびゾーン別車両アーキテクチャの拡大
- 電気自動車および自動運転車の成長
- OTAおよびコネクテッドサービスの統合
- 商用車およびフリート車両からの新たな需要
- 促進要因
- 成長可能性分析
- 規制情勢
- 北米
- 米国運輸省(DOT)基準
- 職業安全衛生局(OSHA)ガイドライン
- 米国環境保護庁(EPA)
- 欧州
- EN ISOコンテナ規格
- 欧州連合の関税および安全規制
- BS EN/CEN規格
- 国家規格(UNE、DINなど)
- アジア太平洋地域
- 中国国家標準(GB)
- 日本JIS規格の要件
- 韓国KS認証
- インドのBIS規格
- タイ工業規格協会(TISI)
- ラテンアメリカ
- INMETRO(国立計量研究所)
- INTI認証(国立工業技術研究所)
- NOM規格(Norma Oficial Mexicana)
- 中東・アフリカ
- ESMA/エミレーツ適合性評価スキーム(ECAS)
- GCC技術規制
- SABS認証
- 北米
- ポーター分析
- PESTEL分析
- 技術とイノベーションの展望
- 現在の技術動向
- 新興技術
- 価格分析
- 製品別価格設定
- 地域別価格設定
- コスト内訳分析
- 特許分析
- 持続可能性と環境面
- 持続可能な実践
- 廃棄物削減戦略
- 生産におけるエネルギー効率
- 環境に配慮した取り組み
- カーボンフットプリントに関する考慮事項
- 使用事例
- ハイパーバイザーアーキテクチャと展開モデル
- タイプ1 vsタイプ2 vs混合重要度アーキテクチャ
- 集中型とゾーン別ECU配置
- マルチドメイン統合戦略(ADAS+IVI+ボディ)
- 性能、レイテンシ、決定性におけるトレードオフ
- SoC互換性とハードウェア共同設計
- オープンソース対プロプライエタリハイパーバイザー戦略
- 機能安全と混合重要度管理
第4章 競合情勢
- イントロダクション
- 企業の市場シェア分析
- 北米
- 欧州
- アジア太平洋地域
- ラテンアメリカ
- 中東・アフリカ地域
- 主要市場企業の競合分析
- 競合ポジショニングマトリックス
- 戦略的展望マトリックス
- 主な発展
- 合併・買収
- 提携・協業
- 新製品の発売
- 事業拡大計画と資金調達
第5章 市場推計・予測:ハイパーバイザー別、2022-2035
- ベアメタルハイパーバイザー
- ホステッドハイパーバイザー
第6章 市場推計・予測:自律性のレベル別、2022-2035
- 準自律型
- 完全自律型
第7章 市場推計・予測:車両別、2022-2035
- 乗用車
- ハッチバック
- セダン
- SUV
- 商用車
- LCV(小型商用車)
- 中型商用車(MCV)
- 大型商用車(HCV)
第8章 市場推計・予測:用途別、2022-2035
- ADAS(先進運転支援システム)
- インフォテインメントおよびテレマティクス
- パワートレインおよびシャシー制御システム
- 車両とあらゆるものとの通信(V2X)
- 自動運転システム
第9章 市場推計・予測:販売チャネル別、2022-2035
- OEM
- アフターマーケット
第10章 市場推計・予測:地域別、2022-2035
- 北米
- 米国
- カナダ
- 欧州
- ドイツ
- 英国
- フランス
- イタリア
- スペイン
- 北欧諸国
- ロシア
- ポーランド
- ルーマニア
- アジア太平洋地域
- 中国
- インド
- 日本
- 韓国
- ANZ
- ベトナム
- インドネシア
- ラテンアメリカ
- ブラジル
- メキシコ
- アルゼンチン
- 中東・アフリカ地域
- 南アフリカ
- サウジアラビア
- アラブ首長国連邦
第11章 企業プロファイル
- 世界企業
- BlackBerry QNX
- Continental
- Green Hills Software
- NVIDIA
- NXP Semiconductors
- Panasonic
- Renesas Electronics
- Robert Bosch
- Siemens(Mentor Graphics)
- Wind River Systems
- 地域プレイヤー
- Aptiv
- Infineon Technologies
- OpenSynergy
- Sasken Technologies
- STMicroelectronics
- Synopsys
- SYSGO
- Texas Instruments
- Vector Informatik
- VMware
- 新興企業
- Apex.AI
- Lynx Software Technologies
- OpenSynergy Ecosystem Partners
- SafeRide Technologies
- Virtual Open Systems

