|
|
市場調査レポート
商品コード
1801568
車載用ハイパーバイザーの世界市場、2025年~2029年Global Automotive Hypervisor Market 2025-2029 |
||||||

|
|||||||
カスタマイズ可能
|
|||||||

| 車載用ハイパーバイザーの世界市場、2025年~2029年 |
|
出版日: 2025年08月21日
発行: TechNavio
ページ情報: 英文 210 Pages
納期: 即納可能
|

全表示
- 概要
- 図表
- 目次
車載用ハイパーバイザー市場は2024-2029年に10億5,750万米ドル、予測期間中のCAGRは34.5%で成長すると予測されます。
当レポートでは、車載用ハイパーバイザー市場の全体的な分析、市場規模・予測、動向、成長促進要因、課題、約25のベンダーを網羅したベンダー分析などを掲載しています。
現在の市場シナリオ、最新動向と促進要因、市場環境全体に関する最新分析を提供しています。市場は、自動車ソフトウェアの複雑化、コネクテッドカーや自律走行車に対する需要の高まり、自動車の安全性とセキュリティへの注力を高める車載用ハイパーバイザーに対する需要の高まりによって牽引されています。
| 市場範囲 | |
|---|---|
| 基準年 | 2025 |
| 終了年 | 2029 |
| 予測期間 | 2025-2029 |
| 成長モメンタム | 加速 |
| 前年比 | 30.4% |
| CAGR | 34.5% |
| 増分額 | 10億5,750万米ドル |
本調査は、業界の主要参加者からのインプットを含め、一次情報と二次情報を客観的に組み合わせて実施しました。レポートには、主要企業の分析に加え、包括的な市場規模データ、地域別分析によるセグメント、ベンダー情勢が含まれています。レポートには過去データと予測データがあります。
本調査では、自動車分野におけるエッジコンピューティング統合による車載用ハイパーバイザー需要の増加が、今後数年間の車載用ハイパーバイザー市場成長を牽引する主要因の1つであると指摘しています。また、車載用ハイパーバイザが効率化のためにアーキテクチャの統合を推進し、OTA(Over-the-Air)アップデートに注力することも、市場の大きな需要につながります。
目次
第1章 エグゼクティブサマリー
- 市場概要
第2章 Technavio分析
- 価格・ライフサイクル・顧客購入バスケット・採用率・購入基準の分析
- インプットの重要性と差別化の要因
- 混乱の要因
- 促進要因と課題の影響
第3章 市場情勢
- 市場エコシステム
- 市場の特徴
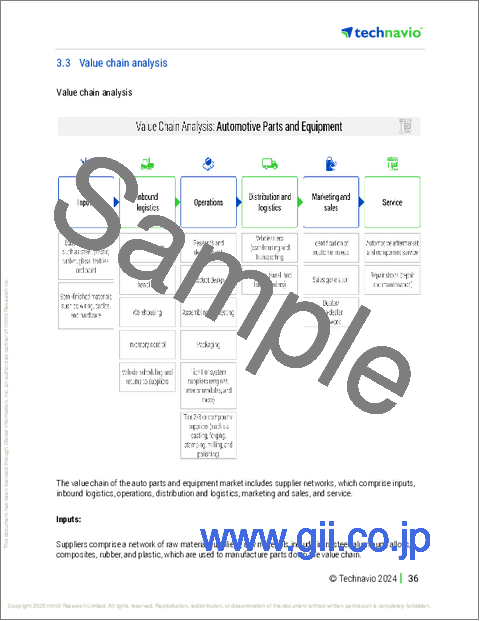
- バリューチェーン分析
第4章 市場規模
- 市場の定義
- 市場セグメント分析
- 市場規模 2024
- 市場の見通し 2024-2029
第5章 市場規模実績
- 車載用ハイパーバイザーの世界市場 2019-2023
- 車両タイプ別セグメント分析 2019-2023
- タイプ別セグメント分析 2019-2023
- 用途別セグメント分析 2019-2023
- 地域別セグメント分析 2019-2023
- 国別セグメント分析 2019-2023
第6章 定性分析
- AIの影響:車載用ハイパーバイザーの世界市場
第7章 ファイブフォース分析
- ファイブフォースの要約
- 買い手の交渉力
- 供給企業の交渉力
- 新規参入業者の脅威
- 代替品の脅威
- 競争の脅威
- 市況
第8章 市場セグメンテーション:車両タイプ別
- 市場セグメント
- 比較:車両タイプ別
- 乗用車:市場規模と予測 2024-2029
- 小型商用車:市場規模と予測 2024-2029
- HCV:市場規模と予測 2024-2029
- 市場機会:車両タイプ別
第9章 市場セグメンテーション:タイプ別
- 市場セグメント
- 比較:タイプ別
- 自動運転車:市場規模と予測 2024-2029
- 半自動運転車:市場規模と予測 2024-2029
- 市場機会:タイプ別
第10章 市場セグメンテーション:用途別
- 市場セグメント
- 比較:用途別
- インフォテインメント:市場規模と予測 2024-2029
- ADAS:市場規模と予測 2024-2029
- テレマティクス:市場規模と予測 2024-2029
- パワートレイン:市場規模と予測 2024-2029
- その他:市場規模と予測 2024-2029
- 市場機会:用途別
第11章 顧客情勢
- 顧客情勢の概要
第12章 地域別情勢
- 地域別セグメンテーション
- 地域別比較
- 北米:市場規模と予測 2024-2029
- アジア太平洋:市場規模と予測 2024-2029
- 欧州:市場規模と予測 2024-2029
- 南米:市場規模と予測 2024-2029
- 中東・アフリカ:市場規模と予測 2024-2029
- 米国:市場規模と予測 2024-2029
- 中国:市場規模と予測 2024-2029
- カナダ:市場規模と予測 2024-2029
- インド:市場規模と予測 2024-2029
- ドイツ:市場規模と予測 2024-2029
- 日本:市場規模と予測 2024-2029
- 韓国:市場規模と予測 2024-2029
- 英国:市場規模と予測 2024-2029
- メキシコ:市場規模と予測 2024-2029
- ブラジル:市場規模と予測 2024-2029
- 市場機会:地域情勢別
第13章 促進要因・課題・機会・抑制要因
- 市場促進要因
- 市場の課題
- 促進要因と課題の影響
- 市場の機会・抑制要因
第14章 競合情勢
- 概要
- 競合情勢
- 混乱の状況
- 業界のリスク
第15章 競合分析
- 企業プロファイル
- 企業ランキング指数
- 企業の市場ポジショニング
- BlackBerry Ltd.
- Elektrobit Automotive GmbH
- Green Hills Software LLC
- Lynx Software Technologies
- NXP Semiconductors NV
- Panasonic Holdings Corp.
- Renesas Electronics Corp.
- Robert Bosch GmbH
- Samsung Electronics Co. Ltd.
- Sasken Technologies Ltd.
- Siemens AG
- Tata Elxsi Ltd.
- TTTech Auto
- Visteon Corp.
- Wind River Systems Inc.
第16章 付録
Exhibits:
- Exhibits1: Executive Summary - Chart on Market Overview
- Exhibits2: Executive Summary - Data Table on Market Overview
- Exhibits3: Executive Summary - Chart on Global Market Characteristics
- Exhibits4: Executive Summary - Chart on Market By Geographical Landscape
- Exhibits5: Executive Summary - Chart on Market Segmentation by Vehicle Type
- Exhibits6: Executive Summary - Chart on Market Segmentation by Type
- Exhibits7: Executive Summary - Chart on Market Segmentation by Application
- Exhibits8: Executive Summary - Chart on Incremental Growth
- Exhibits9: Executive Summary - Data Table on Incremental Growth
- Exhibits10: Executive Summary - Chart on Company Market Positioning
- Exhibits11: Analysis of price sensitivity, lifecycle, customer purchase basket, adoption rates, and purchase criteria
- Exhibits12: Overview on criticality of inputs and factors of differentiation
- Exhibits13: Overview on factors of disruption
- Exhibits14: Impact of drivers and challenges in 2024 and 2029
- Exhibits15: Parent Market
- Exhibits16: Data Table on - Parent Market
- Exhibits17: Market characteristics analysis
- Exhibits18: Value chain analysis
- Exhibits19: Offerings of companies included in the market definition
- Exhibits20: Market segments
- Exhibits21: Chart on Global - Market size and forecast 2024-2029 ($ million)
- Exhibits22: Data Table on Global - Market size and forecast 2024-2029 ($ million)
- Exhibits23: Chart on Global Market: Year-over-year growth 2024-2029 (%)
- Exhibits24: Data Table on Global Market: Year-over-year growth 2024-2029 (%)
- Exhibits25: Historic Market Size - Data Table on Global Automotive Hypervisor Market 2019 - 2023 ($ million)
- Exhibits26: Historic Market Size - Vehicle Type Segment 2019 - 2023 ($ million)
- Exhibits27: Historic Market Size - Type Segment 2019 - 2023 ($ million)
- Exhibits28: Historic Market Size - Application Segment 2019 - 2023 ($ million)
- Exhibits29: Historic Market Size - Geography Segment 2019 - 2023 ($ million)
- Exhibits30: Historic Market Size - Country Segment 2019 - 2023 ($ million)
- Exhibits31: Five forces analysis - Comparison between 2024 and 2029
- Exhibits32: Bargaining power of buyers - Impact of key factors 2024 and 2029
- Exhibits33: Bargaining power of suppliers - Impact of key factors in 2024 and 2029
- Exhibits34: Threat of new entrants - Impact of key factors in 2024 and 2029
- Exhibits35: Threat of substitutes - Impact of key factors in 2024 and 2029
- Exhibits36: Threat of rivalry - Impact of key factors in 2024 and 2029
- Exhibits37: Chart on Market condition - Five forces 2024 and 2029
- Exhibits38: Chart on Vehicle Type - Market share 2024-2029 (%)
- Exhibits39: Data Table on Vehicle Type - Market share 2024-2029 (%)
- Exhibits40: Chart on Comparison by Vehicle Type
- Exhibits41: Data Table on Comparison by Vehicle Type
- Exhibits42: Chart on Passenger cars - Market size and forecast 2024-2029 ($ million)
- Exhibits43: Data Table on Passenger cars - Market size and forecast 2024-2029 ($ million)
- Exhibits44: Chart on Passenger cars - Year-over-year growth 2024-2029 (%)
- Exhibits45: Data Table on Passenger cars - Year-over-year growth 2024-2029 (%)
- Exhibits46: Chart on LCV - Market size and forecast 2024-2029 ($ million)
- Exhibits47: Data Table on LCV - Market size and forecast 2024-2029 ($ million)
- Exhibits48: Chart on LCV - Year-over-year growth 2024-2029 (%)
- Exhibits49: Data Table on LCV - Year-over-year growth 2024-2029 (%)
- Exhibits50: Chart on HCV - Market size and forecast 2024-2029 ($ million)
- Exhibits51: Data Table on HCV - Market size and forecast 2024-2029 ($ million)
- Exhibits52: Chart on HCV - Year-over-year growth 2024-2029 (%)
- Exhibits53: Data Table on HCV - Year-over-year growth 2024-2029 (%)
- Exhibits54: Market opportunity by Vehicle Type ($ million)
- Exhibits55: Data Table on Market opportunity by Vehicle Type ($ million)
- Exhibits56: Chart on Type - Market share 2024-2029 (%)
- Exhibits57: Data Table on Type - Market share 2024-2029 (%)
- Exhibits58: Chart on Comparison by Type
- Exhibits59: Data Table on Comparison by Type
- Exhibits60: Chart on Autonomous vehicle - Market size and forecast 2024-2029 ($ million)
- Exhibits61: Data Table on Autonomous vehicle - Market size and forecast 2024-2029 ($ million)
- Exhibits62: Chart on Autonomous vehicle - Year-over-year growth 2024-2029 (%)
- Exhibits63: Data Table on Autonomous vehicle - Year-over-year growth 2024-2029 (%)
- Exhibits64: Chart on Semi-autonomous vehicle - Market size and forecast 2024-2029 ($ million)
- Exhibits65: Data Table on Semi-autonomous vehicle - Market size and forecast 2024-2029 ($ million)
- Exhibits66: Chart on Semi-autonomous vehicle - Year-over-year growth 2024-2029 (%)
- Exhibits67: Data Table on Semi-autonomous vehicle - Year-over-year growth 2024-2029 (%)
- Exhibits68: Market opportunity by Type ($ million)
- Exhibits69: Data Table on Market opportunity by Type ($ million)
- Exhibits70: Chart on Application - Market share 2024-2029 (%)
- Exhibits71: Data Table on Application - Market share 2024-2029 (%)
- Exhibits72: Chart on Comparison by Application
- Exhibits73: Data Table on Comparison by Application
- Exhibits74: Chart on Infotainment - Market size and forecast 2024-2029 ($ million)
- Exhibits75: Data Table on Infotainment - Market size and forecast 2024-2029 ($ million)
- Exhibits76: Chart on Infotainment - Year-over-year growth 2024-2029 (%)
- Exhibits77: Data Table on Infotainment - Year-over-year growth 2024-2029 (%)
- Exhibits78: Chart on ADAS - Market size and forecast 2024-2029 ($ million)
- Exhibits79: Data Table on ADAS - Market size and forecast 2024-2029 ($ million)
- Exhibits80: Chart on ADAS - Year-over-year growth 2024-2029 (%)
- Exhibits81: Data Table on ADAS - Year-over-year growth 2024-2029 (%)
- Exhibits82: Chart on Telematics - Market size and forecast 2024-2029 ($ million)
- Exhibits83: Data Table on Telematics - Market size and forecast 2024-2029 ($ million)
- Exhibits84: Chart on Telematics - Year-over-year growth 2024-2029 (%)
- Exhibits85: Data Table on Telematics - Year-over-year growth 2024-2029 (%)
- Exhibits86: Chart on Powertrain - Market size and forecast 2024-2029 ($ million)
- Exhibits87: Data Table on Powertrain - Market size and forecast 2024-2029 ($ million)
- Exhibits88: Chart on Powertrain - Year-over-year growth 2024-2029 (%)
- Exhibits89: Data Table on Powertrain - Year-over-year growth 2024-2029 (%)
- Exhibits90: Chart on Others - Market size and forecast 2024-2029 ($ million)
- Exhibits91: Data Table on Others - Market size and forecast 2024-2029 ($ million)
- Exhibits92: Chart on Others - Year-over-year growth 2024-2029 (%)
- Exhibits93: Data Table on Others - Year-over-year growth 2024-2029 (%)
- Exhibits94: Market opportunity by Application ($ million)
- Exhibits95: Data Table on Market opportunity by Application ($ million)
- Exhibits96: Analysis of price sensitivity, lifecycle, customer purchase basket, adoption rates, and purchase criteria
- Exhibits97: Chart on Market share By Geographical Landscape 2024-2029 (%)
- Exhibits98: Data Table on Market share By Geographical Landscape 2024-2029 (%)
- Exhibits99: Chart on Geographic comparison
- Exhibits100: Data Table on Geographic comparison
- Exhibits101: Chart on North America - Market size and forecast 2024-2029 ($ million)
- Exhibits102: Data Table on North America - Market size and forecast 2024-2029 ($ million)
- Exhibits103: Chart on North America - Year-over-year growth 2024-2029 (%)
- Exhibits104: Data Table on North America - Year-over-year growth 2024-2029 (%)
- Exhibits105: Chart on APAC - Market size and forecast 2024-2029 ($ million)
- Exhibits106: Data Table on APAC - Market size and forecast 2024-2029 ($ million)
- Exhibits107: Chart on APAC - Year-over-year growth 2024-2029 (%)
- Exhibits108: Data Table on APAC - Year-over-year growth 2024-2029 (%)
- Exhibits109: Chart on Europe - Market size and forecast 2024-2029 ($ million)
- Exhibits110: Data Table on Europe - Market size and forecast 2024-2029 ($ million)
- Exhibits111: Chart on Europe - Year-over-year growth 2024-2029 (%)
- Exhibits112: Data Table on Europe - Year-over-year growth 2024-2029 (%)
- Exhibits113: Chart on South America - Market size and forecast 2024-2029 ($ million)
- Exhibits114: Data Table on South America - Market size and forecast 2024-2029 ($ million)
- Exhibits115: Chart on South America - Year-over-year growth 2024-2029 (%)
- Exhibits116: Data Table on South America - Year-over-year growth 2024-2029 (%)
- Exhibits117: Chart on Middle East and Africa - Market size and forecast 2024-2029 ($ million)
- Exhibits118: Data Table on Middle East and Africa - Market size and forecast 2024-2029 ($ million)
- Exhibits119: Chart on Middle East and Africa - Year-over-year growth 2024-2029 (%)
- Exhibits120: Data Table on Middle East and Africa - Year-over-year growth 2024-2029 (%)
- Exhibits121: Chart on US - Market size and forecast 2024-2029 ($ million)
- Exhibits122: Data Table on US - Market size and forecast 2024-2029 ($ million)
- Exhibits123: Chart on US - Year-over-year growth 2024-2029 (%)
- Exhibits124: Data Table on US - Year-over-year growth 2024-2029 (%)
- Exhibits125: Chart on China - Market size and forecast 2024-2029 ($ million)
- Exhibits126: Data Table on China - Market size and forecast 2024-2029 ($ million)
- Exhibits127: Chart on China - Year-over-year growth 2024-2029 (%)
- Exhibits128: Data Table on China - Year-over-year growth 2024-2029 (%)
- Exhibits129: Chart on Canada - Market size and forecast 2024-2029 ($ million)
- Exhibits130: Data Table on Canada - Market size and forecast 2024-2029 ($ million)
- Exhibits131: Chart on Canada - Year-over-year growth 2024-2029 (%)
- Exhibits132: Data Table on Canada - Year-over-year growth 2024-2029 (%)
- Exhibits133: Chart on India - Market size and forecast 2024-2029 ($ million)
- Exhibits134: Data Table on India - Market size and forecast 2024-2029 ($ million)
- Exhibits135: Chart on India - Year-over-year growth 2024-2029 (%)
- Exhibits136: Data Table on India - Year-over-year growth 2024-2029 (%)
- Exhibits137: Chart on Germany - Market size and forecast 2024-2029 ($ million)
- Exhibits138: Data Table on Germany - Market size and forecast 2024-2029 ($ million)
- Exhibits139: Chart on Germany - Year-over-year growth 2024-2029 (%)
- Exhibits140: Data Table on Germany - Year-over-year growth 2024-2029 (%)
- Exhibits141: Chart on Japan - Market size and forecast 2024-2029 ($ million)
- Exhibits142: Data Table on Japan - Market size and forecast 2024-2029 ($ million)
- Exhibits143: Chart on Japan - Year-over-year growth 2024-2029 (%)
- Exhibits144: Data Table on Japan - Year-over-year growth 2024-2029 (%)
- Exhibits145: Chart on South Korea - Market size and forecast 2024-2029 ($ million)
- Exhibits146: Data Table on South Korea - Market size and forecast 2024-2029 ($ million)
- Exhibits147: Chart on South Korea - Year-over-year growth 2024-2029 (%)
- Exhibits148: Data Table on South Korea - Year-over-year growth 2024-2029 (%)
- Exhibits149: Chart on UK - Market size and forecast 2024-2029 ($ million)
- Exhibits150: Data Table on UK - Market size and forecast 2024-2029 ($ million)
- Exhibits151: Chart on UK - Year-over-year growth 2024-2029 (%)
- Exhibits152: Data Table on UK - Year-over-year growth 2024-2029 (%)
- Exhibits153: Chart on Mexico - Market size and forecast 2024-2029 ($ million)
- Exhibits154: Data Table on Mexico - Market size and forecast 2024-2029 ($ million)
- Exhibits155: Chart on Mexico - Year-over-year growth 2024-2029 (%)
- Exhibits156: Data Table on Mexico - Year-over-year growth 2024-2029 (%)
- Exhibits157: Chart on Brazil - Market size and forecast 2024-2029 ($ million)
- Exhibits158: Data Table on Brazil - Market size and forecast 2024-2029 ($ million)
- Exhibits159: Chart on Brazil - Year-over-year growth 2024-2029 (%)
- Exhibits160: Data Table on Brazil - Year-over-year growth 2024-2029 (%)
- Exhibits161: Market opportunity By Geographical Landscape ($ million)
- Exhibits162: Data Tables on Market opportunity By Geographical Landscape ($ million)
- Exhibits163: Impact of drivers and challenges in 2024 and 2029
- Exhibits164: Overview on criticality of inputs and factors of differentiation
- Exhibits165: Overview on factors of disruption
- Exhibits166: Impact of key risks on business
- Exhibits167: Companies covered
- Exhibits168: Company ranking index
- Exhibits169: Matrix on companies position and classification
- Exhibits170: BlackBerry Ltd. - Overview
- Exhibits171: BlackBerry Ltd. - Business segments
- Exhibits172: BlackBerry Ltd. - Key news
- Exhibits173: BlackBerry Ltd. - Key offerings
- Exhibits174: BlackBerry Ltd. - Segment focus
- Exhibits175: SWOT
- Exhibits176: Elektrobit Automotive GmbH - Overview
- Exhibits177: Elektrobit Automotive GmbH - Product / Service
- Exhibits178: Elektrobit Automotive GmbH - Key offerings
- Exhibits179: SWOT
- Exhibits180: Green Hills Software LLC - Overview
- Exhibits181: Green Hills Software LLC - Product / Service
- Exhibits182: Green Hills Software LLC - Key offerings
- Exhibits183: SWOT
- Exhibits184: Lynx Software Technologies - Overview
- Exhibits185: Lynx Software Technologies - Product / Service
- Exhibits186: Lynx Software Technologies - Key offerings
- Exhibits187: SWOT
- Exhibits188: NXP Semiconductors NV - Overview
- Exhibits189: NXP Semiconductors NV - Product / Service
- Exhibits190: NXP Semiconductors NV - Key offerings
- Exhibits191: SWOT
- Exhibits192: Panasonic Holdings Corp. - Overview
- Exhibits193: Panasonic Holdings Corp. - Business segments
- Exhibits194: Panasonic Holdings Corp. - Key news
- Exhibits195: Panasonic Holdings Corp. - Key offerings
- Exhibits196: Panasonic Holdings Corp. - Segment focus
- Exhibits197: SWOT
- Exhibits198: Renesas Electronics Corp. - Overview
- Exhibits199: Renesas Electronics Corp. - Business segments
- Exhibits200: Renesas Electronics Corp. - Key news
- Exhibits201: Renesas Electronics Corp. - Key offerings
- Exhibits202: Renesas Electronics Corp. - Segment focus
- Exhibits203: SWOT
- Exhibits204: Robert Bosch GmbH - Overview
- Exhibits205: Robert Bosch GmbH - Product / Service
- Exhibits206: Robert Bosch GmbH - Key news
- Exhibits207: Robert Bosch GmbH - Key offerings
- Exhibits208: SWOT
- Exhibits209: Samsung Electronics Co. Ltd. - Overview
- Exhibits210: Samsung Electronics Co. Ltd. - Business segments
- Exhibits211: Samsung Electronics Co. Ltd. - Key news
- Exhibits212: Samsung Electronics Co. Ltd. - Key offerings
- Exhibits213: Samsung Electronics Co. Ltd. - Segment focus
- Exhibits214: SWOT
- Exhibits215: Sasken Technologies Ltd. - Overview
- Exhibits216: Sasken Technologies Ltd. - Product / Service
- Exhibits217: Sasken Technologies Ltd. - Key offerings
- Exhibits218: SWOT
- Exhibits219: Siemens AG - Overview
- Exhibits220: Siemens AG - Business segments
- Exhibits221: Siemens AG - Key news
- Exhibits222: Siemens AG - Key offerings
- Exhibits223: Siemens AG - Segment focus
- Exhibits224: SWOT
- Exhibits225: Tata Elxsi Ltd. - Overview
- Exhibits226: Tata Elxsi Ltd. - Business segments
- Exhibits227: Tata Elxsi Ltd. - Key offerings
- Exhibits228: Tata Elxsi Ltd. - Segment focus
- Exhibits229: SWOT
- Exhibits230: TTTech Auto - Overview
- Exhibits231: TTTech Auto - Product / Service
- Exhibits232: TTTech Auto - Key offerings
- Exhibits233: SWOT
- Exhibits234: Visteon Corp. - Overview
- Exhibits235: Visteon Corp. - Product / Service
- Exhibits236: Visteon Corp. - Key news
- Exhibits237: Visteon Corp. - Key offerings
- Exhibits238: SWOT
- Exhibits239: Wind River Systems Inc. - Overview
- Exhibits240: Wind River Systems Inc. - Product / Service
- Exhibits241: Wind River Systems Inc. - Key offerings
- Exhibits242: SWOT
- Exhibits243: Inclusions checklist
- Exhibits244: Exclusions checklist
- Exhibits245: Currency conversion rates for US$
- Exhibits246: Research methodology
- Exhibits247: Information sources
- Exhibits248: Data validation
- Exhibits249: Validation techniques employed for market sizing
- Exhibits250: Data synthesis
- Exhibits251: 360 degree market analysis
- Exhibits252: List of abbreviations
The automotive hypervisor market is forecasted to grow by USD 1,057.5 mn during 2024-2029, accelerating at a CAGR of 34.5% during the forecast period. The report on the automotive hypervisor market provides a holistic analysis, market size and forecast, trends, growth drivers, and challenges, as well as vendor analysis covering around 25 vendors.
The report offers an up-to-date analysis regarding the current market scenario, the latest trends and drivers, and the overall market environment. The market is driven by increasing complexity of automotive software, rising demand for connected and autonomous vehicles, and increasing demand for automotive hypervisor going to increase focus on vehicle safety and security.
| Market Scope | |
|---|---|
| Base Year | 2025 |
| End Year | 2029 |
| Series Year | 2025-2029 |
| Growth Momentum | Accelerate |
| YOY 2025 | 30.4% |
| CAGR | 34.5% |
| Incremental Value | $1,057.5 mn |
The study was conducted using an objective combination of primary and secondary information including inputs from key participants in the industry. The report contains a comprehensive market size data, segment with regional analysis and vendor landscape in addition to an analysis of the key companies. Reports have historic and forecast data.
Technavio's automotive hypervisor market is segmented as below:
By Vehicle Type
- Passenger cars
- LCV
- HCV
By Type
- Autonomous vehicle
- Semi-autonomous vehicle
By Application
- Infotainment
- ADAS
- Telematics
- Powertrain
- Others
By Geographical Landscape
- North America
- APAC
- Europe
- South America
- Middle East and Africa
This study identifies the increasing demand for automotive hypervisor due to edge computing integration in automotive sector as one of the prime reasons driving the automotive hypervisor market growth during the next few years. Also, automotive hypervisors drive architecture consolidation for efficiency and focus on over-the-air (OTA) updates will lead to sizable demand in the market.
The report on the automotive hypervisor market covers the following areas:
- Automotive Hypervisor Market sizing
- Automotive Hypervisor Market forecast
- Automotive Hypervisor Market industry analysis
The robust vendor analysis is designed to help clients improve their market position, and in line with this, this report provides a detailed analysis of several leading automotive hypervisor market vendors that include BlackBerry Ltd., Elektrobit Automotive GmbH, Green Hills Software LLC, Infineon Technologies AG, International Business Machines Corp., Lynx Software Technologies, NXP Semiconductors NV, Panasonic Holdings Corp., Qualcomm Inc., Renesas Electronics Corp., Robert Bosch GmbH, Samsung Electronics Co. Ltd., Sasken Technologies Ltd., Siemens AG, Synopsys Inc., Tata Elxsi Ltd., TTTech Auto, Visteon Corp., VMware Inc., and Wind River Systems Inc.. Also, the automotive hypervisor market analysis report includes information on upcoming trends and challenges that will influence market growth. This is to help companies strategize and leverage all forthcoming growth opportunities.
The publisher presents a detailed picture of the market by the way of study, synthesis, and summation of data from multiple sources by an analysis of key parameters such as profit, pricing, competition, and promotions. It presents various market facets by identifying the key industry influencers. The data presented is comprehensive, reliable, and a result of extensive primary and secondary research. The market research reports provide a complete competitive landscape and an in-depth vendor selection methodology and analysis using qualitative and quantitative research to forecast accurate market growth.
Table of Contents
1 Executive Summary
- 1.1 Market overview
- Executive Summary - Chart on Market Overview
- Executive Summary - Data Table on Market Overview
- Executive Summary - Chart on Global Market Characteristics
- Executive Summary - Chart on Market By Geographical Landscape
- Executive Summary - Chart on Market Segmentation by Vehicle Type
- Executive Summary - Chart on Market Segmentation by Type
- Executive Summary - Chart on Market Segmentation by Application
- Executive Summary - Chart on Incremental Growth
- Executive Summary - Data Table on Incremental Growth
- Executive Summary - Chart on Company Market Positioning
2 Technavio Analysis
- 2.1 Analysis of price sensitivity, lifecycle, customer purchase basket, adoption rates, and purchase criteria
- Analysis of price sensitivity, lifecycle, customer purchase basket, adoption rates, and purchase criteria
- 2.2 Criticality of inputs and Factors of differentiation
- Overview on criticality of inputs and factors of differentiation
- 2.3 Factors of disruption
- Overview on factors of disruption
- 2.4 Impact of drivers and challenges
- Impact of drivers and challenges in 2024 and 2029
3 Market Landscape
- 3.1 Market ecosystem
- Parent Market
- Data Table on - Parent Market
- 3.2 Market characteristics
- Market characteristics analysis
- 3.3 Value chain analysis
- Value chain analysis
4 Market Sizing
- 4.1 Market definition
- Offerings of companies included in the market definition
- 4.2 Market segment analysis
- Market segments
- 4.3 Market size 2024
- 4.4 Market outlook: Forecast for 2024-2029
- Chart on Global - Market size and forecast 2024-2029 ($ million)
- Data Table on Global - Market size and forecast 2024-2029 ($ million)
- Chart on Global Market: Year-over-year growth 2024-2029 (%)
- Data Table on Global Market: Year-over-year growth 2024-2029 (%)
5 Historic Market Size
- 5.1 Global Automotive Hypervisor Market 2019 - 2023
- Historic Market Size - Data Table on Global Automotive Hypervisor Market 2019 - 2023 ($ million)
- 5.2 Vehicle Type segment analysis 2019 - 2023
- Historic Market Size - Vehicle Type Segment 2019 - 2023 ($ million)
- 5.3 Type segment analysis 2019 - 2023
- Historic Market Size - Type Segment 2019 - 2023 ($ million)
- 5.4 Application segment analysis 2019 - 2023
- Historic Market Size - Application Segment 2019 - 2023 ($ million)
- 5.5 Geography segment analysis 2019 - 2023
- Historic Market Size - Geography Segment 2019 - 2023 ($ million)
- 5.6 Country segment analysis 2019 - 2023
- Historic Market Size - Country Segment 2019 - 2023 ($ million)
6 Qualitative Analysis
- 6.1 The AI impact on Global Automotive Hypervisor Market
7 Five Forces Analysis
- 7.1 Five forces summary
- Five forces analysis - Comparison between 2024 and 2029
- 7.2 Bargaining power of buyers
- Bargaining power of buyers - Impact of key factors 2024 and 2029
- 7.3 Bargaining power of suppliers
- Bargaining power of suppliers - Impact of key factors in 2024 and 2029
- 7.4 Threat of new entrants
- Threat of new entrants - Impact of key factors in 2024 and 2029
- 7.5 Threat of substitutes
- Threat of substitutes - Impact of key factors in 2024 and 2029
- 7.6 Threat of rivalry
- Threat of rivalry - Impact of key factors in 2024 and 2029
- 7.7 Market condition
- Chart on Market condition - Five forces 2024 and 2029
8 Market Segmentation by Vehicle Type
- 8.1 Market segments
- Chart on Vehicle Type - Market share 2024-2029 (%)
- Data Table on Vehicle Type - Market share 2024-2029 (%)
- 8.2 Comparison by Vehicle Type
- Chart on Comparison by Vehicle Type
- Data Table on Comparison by Vehicle Type
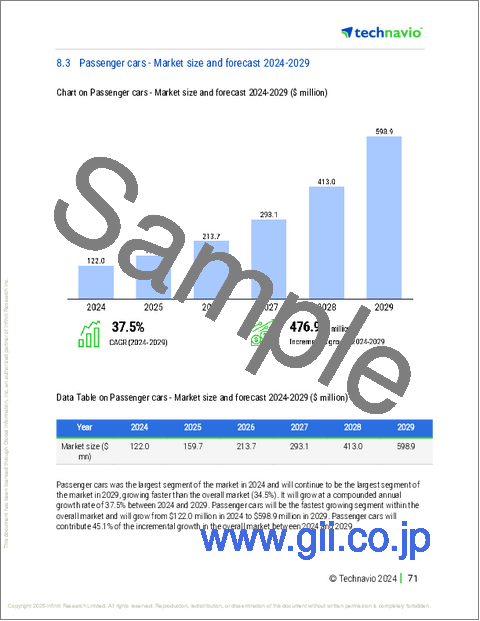
- 8.3 Passenger cars - Market size and forecast 2024-2029
- Chart on Passenger cars - Market size and forecast 2024-2029 ($ million)
- Data Table on Passenger cars - Market size and forecast 2024-2029 ($ million)
- Chart on Passenger cars - Year-over-year growth 2024-2029 (%)
- Data Table on Passenger cars - Year-over-year growth 2024-2029 (%)
- 8.4 LCV - Market size and forecast 2024-2029
- Chart on LCV - Market size and forecast 2024-2029 ($ million)
- Data Table on LCV - Market size and forecast 2024-2029 ($ million)
- Chart on LCV - Year-over-year growth 2024-2029 (%)
- Data Table on LCV - Year-over-year growth 2024-2029 (%)
- 8.5 HCV - Market size and forecast 2024-2029
- Chart on HCV - Market size and forecast 2024-2029 ($ million)
- Data Table on HCV - Market size and forecast 2024-2029 ($ million)
- Chart on HCV - Year-over-year growth 2024-2029 (%)
- Data Table on HCV - Year-over-year growth 2024-2029 (%)
- 8.6 Market opportunity by Vehicle Type
- Market opportunity by Vehicle Type ($ million)
- Data Table on Market opportunity by Vehicle Type ($ million)
9 Market Segmentation by Type
- 9.1 Market segments
- Chart on Type - Market share 2024-2029 (%)
- Data Table on Type - Market share 2024-2029 (%)
- 9.2 Comparison by Type
- Chart on Comparison by Type
- Data Table on Comparison by Type
- 9.3 Autonomous vehicle - Market size and forecast 2024-2029
- Chart on Autonomous vehicle - Market size and forecast 2024-2029 ($ million)
- Data Table on Autonomous vehicle - Market size and forecast 2024-2029 ($ million)
- Chart on Autonomous vehicle - Year-over-year growth 2024-2029 (%)
- Data Table on Autonomous vehicle - Year-over-year growth 2024-2029 (%)
- 9.4 Semi-autonomous vehicle - Market size and forecast 2024-2029
- Chart on Semi-autonomous vehicle - Market size and forecast 2024-2029 ($ million)
- Data Table on Semi-autonomous vehicle - Market size and forecast 2024-2029 ($ million)
- Chart on Semi-autonomous vehicle - Year-over-year growth 2024-2029 (%)
- Data Table on Semi-autonomous vehicle - Year-over-year growth 2024-2029 (%)
- 9.5 Market opportunity by Type
- Market opportunity by Type ($ million)
- Data Table on Market opportunity by Type ($ million)
10 Market Segmentation by Application
- 10.1 Market segments
- Chart on Application - Market share 2024-2029 (%)
- Data Table on Application - Market share 2024-2029 (%)
- 10.2 Comparison by Application
- Chart on Comparison by Application
- Data Table on Comparison by Application
- 10.3 Infotainment - Market size and forecast 2024-2029
- Chart on Infotainment - Market size and forecast 2024-2029 ($ million)
- Data Table on Infotainment - Market size and forecast 2024-2029 ($ million)
- Chart on Infotainment - Year-over-year growth 2024-2029 (%)
- Data Table on Infotainment - Year-over-year growth 2024-2029 (%)
- 10.4 ADAS - Market size and forecast 2024-2029
- Chart on ADAS - Market size and forecast 2024-2029 ($ million)
- Data Table on ADAS - Market size and forecast 2024-2029 ($ million)
- Chart on ADAS - Year-over-year growth 2024-2029 (%)
- Data Table on ADAS - Year-over-year growth 2024-2029 (%)
- 10.5 Telematics - Market size and forecast 2024-2029
- Chart on Telematics - Market size and forecast 2024-2029 ($ million)
- Data Table on Telematics - Market size and forecast 2024-2029 ($ million)
- Chart on Telematics - Year-over-year growth 2024-2029 (%)
- Data Table on Telematics - Year-over-year growth 2024-2029 (%)
- 10.6 Powertrain - Market size and forecast 2024-2029
- Chart on Powertrain - Market size and forecast 2024-2029 ($ million)
- Data Table on Powertrain - Market size and forecast 2024-2029 ($ million)
- Chart on Powertrain - Year-over-year growth 2024-2029 (%)
- Data Table on Powertrain - Year-over-year growth 2024-2029 (%)
- 10.7 Others - Market size and forecast 2024-2029
- Chart on Others - Market size and forecast 2024-2029 ($ million)
- Data Table on Others - Market size and forecast 2024-2029 ($ million)
- Chart on Others - Year-over-year growth 2024-2029 (%)
- Data Table on Others - Year-over-year growth 2024-2029 (%)
- 10.8 Market opportunity by Application
- Market opportunity by Application ($ million)
- Data Table on Market opportunity by Application ($ million)
11 Customer Landscape
- 11.1 Customer landscape overview
- Analysis of price sensitivity, lifecycle, customer purchase basket, adoption rates, and purchase criteria
12 Geographic Landscape
- 12.1 Geographic segmentation
- Chart on Market share By Geographical Landscape 2024-2029 (%)
- Data Table on Market share By Geographical Landscape 2024-2029 (%)
- 12.2 Geographic comparison
- Chart on Geographic comparison
- Data Table on Geographic comparison
- 12.3 North America - Market size and forecast 2024-2029
- Chart on North America - Market size and forecast 2024-2029 ($ million)
- Data Table on North America - Market size and forecast 2024-2029 ($ million)
- Chart on North America - Year-over-year growth 2024-2029 (%)
- Data Table on North America - Year-over-year growth 2024-2029 (%)
- 12.4 APAC - Market size and forecast 2024-2029
- Chart on APAC - Market size and forecast 2024-2029 ($ million)
- Data Table on APAC - Market size and forecast 2024-2029 ($ million)
- Chart on APAC - Year-over-year growth 2024-2029 (%)
- Data Table on APAC - Year-over-year growth 2024-2029 (%)
- 12.5 Europe - Market size and forecast 2024-2029
- Chart on Europe - Market size and forecast 2024-2029 ($ million)
- Data Table on Europe - Market size and forecast 2024-2029 ($ million)
- Chart on Europe - Year-over-year growth 2024-2029 (%)
- Data Table on Europe - Year-over-year growth 2024-2029 (%)
- 12.6 South America - Market size and forecast 2024-2029
- Chart on South America - Market size and forecast 2024-2029 ($ million)
- Data Table on South America - Market size and forecast 2024-2029 ($ million)
- Chart on South America - Year-over-year growth 2024-2029 (%)
- Data Table on South America - Year-over-year growth 2024-2029 (%)
- 12.7 Middle East and Africa - Market size and forecast 2024-2029
- Chart on Middle East and Africa - Market size and forecast 2024-2029 ($ million)
- Data Table on Middle East and Africa - Market size and forecast 2024-2029 ($ million)
- Chart on Middle East and Africa - Year-over-year growth 2024-2029 (%)
- Data Table on Middle East and Africa - Year-over-year growth 2024-2029 (%)
- 12.8 US - Market size and forecast 2024-2029
- Chart on US - Market size and forecast 2024-2029 ($ million)
- Data Table on US - Market size and forecast 2024-2029 ($ million)
- Chart on US - Year-over-year growth 2024-2029 (%)
- Data Table on US - Year-over-year growth 2024-2029 (%)
- 12.9 China - Market size and forecast 2024-2029
- Chart on China - Market size and forecast 2024-2029 ($ million)
- Data Table on China - Market size and forecast 2024-2029 ($ million)
- Chart on China - Year-over-year growth 2024-2029 (%)
- Data Table on China - Year-over-year growth 2024-2029 (%)
- 12.10 Canada - Market size and forecast 2024-2029
- Chart on Canada - Market size and forecast 2024-2029 ($ million)
- Data Table on Canada - Market size and forecast 2024-2029 ($ million)
- Chart on Canada - Year-over-year growth 2024-2029 (%)
- Data Table on Canada - Year-over-year growth 2024-2029 (%)
- 12.11 India - Market size and forecast 2024-2029
- Chart on India - Market size and forecast 2024-2029 ($ million)
- Data Table on India - Market size and forecast 2024-2029 ($ million)
- Chart on India - Year-over-year growth 2024-2029 (%)
- Data Table on India - Year-over-year growth 2024-2029 (%)
- 12.12 Germany - Market size and forecast 2024-2029
- Chart on Germany - Market size and forecast 2024-2029 ($ million)
- Data Table on Germany - Market size and forecast 2024-2029 ($ million)
- Chart on Germany - Year-over-year growth 2024-2029 (%)
- Data Table on Germany - Year-over-year growth 2024-2029 (%)
- 12.13 Japan - Market size and forecast 2024-2029
- Chart on Japan - Market size and forecast 2024-2029 ($ million)
- Data Table on Japan - Market size and forecast 2024-2029 ($ million)
- Chart on Japan - Year-over-year growth 2024-2029 (%)
- Data Table on Japan - Year-over-year growth 2024-2029 (%)
- 12.14 South Korea - Market size and forecast 2024-2029
- Chart on South Korea - Market size and forecast 2024-2029 ($ million)
- Data Table on South Korea - Market size and forecast 2024-2029 ($ million)
- Chart on South Korea - Year-over-year growth 2024-2029 (%)
- Data Table on South Korea - Year-over-year growth 2024-2029 (%)
- 12.15 UK - Market size and forecast 2024-2029
- Chart on UK - Market size and forecast 2024-2029 ($ million)
- Data Table on UK - Market size and forecast 2024-2029 ($ million)
- Chart on UK - Year-over-year growth 2024-2029 (%)
- Data Table on UK - Year-over-year growth 2024-2029 (%)
- 12.16 Mexico - Market size and forecast 2024-2029
- Chart on Mexico - Market size and forecast 2024-2029 ($ million)
- Data Table on Mexico - Market size and forecast 2024-2029 ($ million)
- Chart on Mexico - Year-over-year growth 2024-2029 (%)
- Data Table on Mexico - Year-over-year growth 2024-2029 (%)
- 12.17 Brazil - Market size and forecast 2024-2029
- Chart on Brazil - Market size and forecast 2024-2029 ($ million)
- Data Table on Brazil - Market size and forecast 2024-2029 ($ million)
- Chart on Brazil - Year-over-year growth 2024-2029 (%)
- Data Table on Brazil - Year-over-year growth 2024-2029 (%)
- 12.18 Market opportunity By Geographical Landscape
- Market opportunity By Geographical Landscape ($ million)
- Data Tables on Market opportunity By Geographical Landscape ($ million)
13 Drivers, Challenges, and Opportunity/Restraints
- 13.1 Market drivers
- 13.2 Market challenges
- 13.3 Impact of drivers and challenges
- Impact of drivers and challenges in 2024 and 2029
- 13.4 Market opportunities/restraints
14 Competitive Landscape
- 14.1 Overview
- 14.2 Competitive Landscape
- Overview on criticality of inputs and factors of differentiation
- 14.3 Landscape disruption
- Overview on factors of disruption
- 14.4 Industry risks
- Impact of key risks on business
15 Competitive Analysis
- 15.1 Companies profiled
- Companies covered
- 15.2 Company ranking index
- Company ranking index
- 15.3 Market positioning of companies
- Matrix on companies position and classification
- 15.4 BlackBerry Ltd.
- BlackBerry Ltd. - Overview
- BlackBerry Ltd. - Business segments
- BlackBerry Ltd. - Key news
- BlackBerry Ltd. - Key offerings
- BlackBerry Ltd. - Segment focus
- SWOT
- 15.5 Elektrobit Automotive GmbH
- Elektrobit Automotive GmbH - Overview
- Elektrobit Automotive GmbH - Product / Service
- Elektrobit Automotive GmbH - Key offerings
- SWOT
- 15.6 Green Hills Software LLC
- Green Hills Software LLC - Overview
- Green Hills Software LLC - Product / Service
- Green Hills Software LLC - Key offerings
- SWOT
- 15.7 Lynx Software Technologies
- Lynx Software Technologies - Overview
- Lynx Software Technologies - Product / Service
- Lynx Software Technologies - Key offerings
- SWOT
- 15.8 NXP Semiconductors NV
- NXP Semiconductors NV - Overview
- NXP Semiconductors NV - Product / Service
- NXP Semiconductors NV - Key offerings
- SWOT
- 15.9 Panasonic Holdings Corp.
- Panasonic Holdings Corp. - Overview
- Panasonic Holdings Corp. - Business segments
- Panasonic Holdings Corp. - Key news
- Panasonic Holdings Corp. - Key offerings
- Panasonic Holdings Corp. - Segment focus
- SWOT
- 15.10 Renesas Electronics Corp.
- Renesas Electronics Corp. - Overview
- Renesas Electronics Corp. - Business segments
- Renesas Electronics Corp. - Key news
- Renesas Electronics Corp. - Key offerings
- Renesas Electronics Corp. - Segment focus
- SWOT
- 15.11 Robert Bosch GmbH
- Robert Bosch GmbH - Overview
- Robert Bosch GmbH - Product / Service
- Robert Bosch GmbH - Key news
- Robert Bosch GmbH - Key offerings
- SWOT
- 15.12 Samsung Electronics Co. Ltd.
- Samsung Electronics Co. Ltd. - Overview
- Samsung Electronics Co. Ltd. - Business segments
- Samsung Electronics Co. Ltd. - Key news
- Samsung Electronics Co. Ltd. - Key offerings
- Samsung Electronics Co. Ltd. - Segment focus
- SWOT
- 15.13 Sasken Technologies Ltd.
- Sasken Technologies Ltd. - Overview
- Sasken Technologies Ltd. - Product / Service
- Sasken Technologies Ltd. - Key offerings
- SWOT
- 15.14 Siemens AG
- Siemens AG - Overview
- Siemens AG - Business segments
- Siemens AG - Key news
- Siemens AG - Key offerings
- Siemens AG - Segment focus
- SWOT
- 15.15 Tata Elxsi Ltd.
- Tata Elxsi Ltd. - Overview
- Tata Elxsi Ltd. - Business segments
- Tata Elxsi Ltd. - Key offerings
- Tata Elxsi Ltd. - Segment focus
- SWOT
- 15.16 TTTech Auto
- TTTech Auto - Overview
- TTTech Auto - Product / Service
- TTTech Auto - Key offerings
- SWOT
- 15.17 Visteon Corp.
- Visteon Corp. - Overview
- Visteon Corp. - Product / Service
- Visteon Corp. - Key news
- Visteon Corp. - Key offerings
- SWOT
- 15.18 Wind River Systems Inc.
- Wind River Systems Inc. - Overview
- Wind River Systems Inc. - Product / Service
- Wind River Systems Inc. - Key offerings
- SWOT
16 Appendix
- 16.1 Scope of the report
- 16.2 Inclusions and exclusions checklist
- Inclusions checklist
- Exclusions checklist
- 16.3 Currency conversion rates for US$
- Currency conversion rates for US$
- 16.4 Research methodology
- Research methodology
- 16.5 Data procurement
- Information sources
- 16.6 Data validation
- Data validation
- 16.7 Validation techniques employed for market sizing
- Validation techniques employed for market sizing
- 16.8 Data synthesis
- Data synthesis
- 16.9 360 degree market analysis
- 360 degree market analysis
- 16.10 List of abbreviations
- List of abbreviations

