
|
市場調査レポート
商品コード
1666958
DC急速EV充電ステーション市場の機会、成長促進要因、産業動向分析、2025~2034年の予測DC Fast Electric Vehicle Charging Station Market Opportunity, Growth Drivers, Industry Trend Analysis, and Forecast 2025 - 2034 |
||||||
カスタマイズ可能
|
|||||||
| DC急速EV充電ステーション市場の機会、成長促進要因、産業動向分析、2025~2034年の予測 |
|
出版日: 2024年12月17日
発行: Global Market Insights Inc.
ページ情報: 英文 120 Pages
納期: 2~3営業日
|

全表示
- 概要
- 目次
DC急速EV充電ステーションの世界市場規模は、2024年に203億米ドルとなり、2025年から2034年にかけて28.4%のCAGRで堅調に成長すると予測されています。
電気自動車(EV)の普及が進むにつれ、より高速な充電ソリューションへの需要がますます重要になっています。急速充電機能で知られるDC急速充電器は、航続距離不安や長い充電時間といった懸念に対処しています。このような急速充電に対する需要の高まりは、EVの所有体験全体を向上させ、消費者が電気自動車を日常生活に取り入れることをより簡単で便利なものにしています。技術の進歩と公共投資は、充電インフラの拡大を加速し、電気自動車へのシフトをさらに促進し、持続可能な未来への世界の移行を支援する上で極めて重要な役割を果たしています。
DC急速EV充電ステーション市場は、2034年までに1,090億米ドルを突破する見込みです。これらの充電器は、充電ステーションとシームレスに統合できるように設計されており、余分な充電を保持するための追加ストレージ容量を提供します。超高電圧を使用し、大幅に速い速度で自動車を充電する能力は、その魅力を高めています。急速充電インフラに対する需要の高まりと、ハイブリッド車の採用拡大により、この市場は上昇基調にあります。より高速な充電ソリューションを求める消費者が増えるにつれ、関連する電気部品やハイブリッド技術の継続的な発展によって、市場力学はプラスの影響を受けています。
| 市場範囲 | |
|---|---|
| 開始年 | 2024 |
| 予測年 | 2025-2034 |
| 開始金額 | 203億米ドル |
| 予測金額 | 2,507億米ドル |
| CAGR | 28.4% |
公共充電ステーション分野は、2034年までのCAGRが28%を超える大きな成長が見込まれています。公共のEV充電ステーションの利用可能性が高まっていることが、この拡大を促進する主な要因です。これらのステーションは主要道路沿いで利用しやすくなっており、ドライバーは外出先で電気自動車を充電しやすくなっています。さらに、充電ステーションの所有者が遠隔でエネルギー消費を監視、制御、最適化できるようになったことで、これらのステーションの展開がさらに進んでいます。この機能は効率を向上させるだけでなく、EV充電インフラの幅広い成長もサポートします。
米国では、DC急速EV充電ステーション市場は2034年までに20億米ドルを超えると予想されています。電気自動車の環境面での利点に対する消費者の意識の高まりと、充電ステーションの設置を促進する政府の規制が相まって、市場の成長が促進されます。公共および民間の充電ステーションが拡大し続け、急速充電規格が採用されるにつれて、DC急速充電器の需要は急増すると予想されます。これらの要因は、市場が継続的に拡大し、電気自動車の増加に対応するために必要なインフラが進化するための鍵となります。
アジア太平洋地域では、電気自動車導入に対する税制優遇措置やリベートを含む有利な政府政策が、充電ステーション市場の成長を促進しています。充電ネットワークの開発に投資する多国籍小売企業の増加は、業界に大きなチャンスをもたらしています。この動向は市場のインフラ強化に役立ち、電気自動車の採用をさらに加速させています。
目次
第1章 調査手法と調査範囲
- 市場範囲と定義
- 市場推計・予測パラメータ
- 予測計算
- データソース
- 1次データ
- 2次データ
- 有料
- 公的
第2章 エグゼクティブサマリー
第3章 業界洞察
- エコシステム分析
- 規制状況
- 業界への影響要因
- 促進要因
- 業界の潜在的リスク&課題
- 成長可能性分析
- ポーターの分析
- 供給企業の交渉力
- 買い手の交渉力
- 新規参入業者の脅威
- 代替品の脅威
- PESTEL分析
第4章 競合情勢
- イントロダクション
- 戦略的展望
- イノベーションと持続可能性の展望
第5章 市場規模・予測:充電タイプ別、2021年~2034年
- 主要動向
- DC急速
- その他
第6章 市場規模・予測:充電サイト別、2021年~2034年
- 主要動向
- 公共
- 民間
第7章 市場規模・予測:地域別、2021~2034年
- 主要動向
- 北米
- 米国
- カナダ
- メキシコ
- 欧州
- ノルウェー
- ドイツ
- フランス
- オランダ
- 英国
- スウェーデン
- アジア太平洋
- 中国
- 日本
- インド
- 韓国
- シンガポール
- 中東・アフリカ
- サウジアラビア
- アラブ首長国連邦
- 南アフリカ
- ラテンアメリカ
- ブラジル
- アルゼンチン
第8章 企業プロファイル
- ABB
- Blink Charging
- ChargePoint
- Delta Electronics
- EON
- Eaton
- EVBox
- EVgo
- Fortum
- GreenWay Infrastructure
- Leviton Manufacturing
- Siemens
- Starvo Global Energi
- Tesla
- Volta
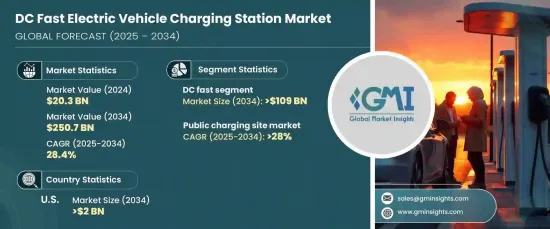
The Global DC Fast Electric Vehicle Charging Station Market was valued at USD 20.3 billion in 2024 and is projected to grow at a robust CAGR of 28.4% between 2025 and 2034. As the adoption of electric vehicles (EVs) rises, the demand for faster charging solutions becomes increasingly critical. DC fast chargers, known for their rapid charging capabilities, are addressing concerns like range anxiety and long charging times. This growing demand for quicker recharging options is enhancing the overall EV ownership experience, making it easier and more convenient for consumers to incorporate electric vehicles into their daily routines. Technological advancements and public investments are playing pivotal roles in accelerating the expansion of the charging infrastructure, further driving the shift toward electric vehicles, and supporting the global transition to a sustainable future.
The DC fast EV charging station market is set to surpass USD 109 billion by 2034. These chargers are designed to seamlessly integrate with charging stations and offer additional storage capacity to hold extra charge. Their ability to charge vehicles at significantly faster speeds, using very high voltage, boosts their appeal. With the increasing demand for rapid charging infrastructure and the growing adoption of hybrid vehicles, this market is on an upward trajectory. As more consumers seek faster charging solutions, the market dynamics are being positively influenced by the continuous development of related electrical components and hybrid technologies.
| Market Scope | |
|---|---|
| Start Year | 2024 |
| Forecast Year | 2025-2034 |
| Start Value | $20.3 Billion |
| Forecast Value | $250.7 Billion |
| CAGR | 28.4% |
The public charging station segment is expected to witness significant growth, with a CAGR of over 28% through 2034. The increasing availability of public EV charging stations is a major factor driving this expansion. These stations are becoming more accessible along major roadways, making it easier for drivers to charge their electric vehicles while on the go. Additionally, the ability of charging station owners to remotely monitor, control, and optimize energy consumption is further enhancing the deployment of these stations. This functionality not only improves efficiency but also supports the broader growth of EV charging infrastructure.
In the U.S., the DC fast EV charging station market is anticipated to exceed USD 2 billion by 2034. Rising consumer awareness about the environmental benefits of electric vehicles, combined with government regulations promoting the installation of charging stations, will propel market growth. As both public and private charging stations continue to expand and fast charging standards are adopted, the demand for DC fast chargers is expected to surge. These factors are key to the market's continued expansion and the evolution of the infrastructure needed to support the growing number of electric vehicles.
In the Asia Pacific region, favorable government policies, including tax incentives and rebates for electric vehicle adoption, are driving the growth of the charging station market. The increasing number of multinational retail corporations investing in the development of charging networks is creating significant opportunities for the industry. This trend is helping to strengthen the market's infrastructure, further accelerating the adoption of electric vehicles.
Table of Contents
Chapter 1 Methodology & Scope
- 1.1 Market scope & definitions
- 1.2 Market estimates & forecast parameters
- 1.3 Forecast calculation
- 1.4 Data sources
- 1.4.1 Primary
- 1.4.2 Secondary
- 1.4.2.1 Paid
- 1.4.2.2 Public
Chapter 2 Executive Summary
- 2.1 Industry synopsis, 2021 - 2034
Chapter 3 Industry Insights
- 3.1 Industry ecosystem analysis
- 3.2 Regulatory landscape
- 3.3 Industry impact forces
- 3.3.1 Growth drivers
- 3.3.2 Industry pitfalls & challenges
- 3.4 Growth potential analysis
- 3.5 Porter's Analysis
- 3.5.1 Bargaining power of suppliers
- 3.5.2 Bargaining power of buyers
- 3.5.3 Threat of new entrants
- 3.5.4 Threat of substitutes
- 3.6 PESTEL Analysis
Chapter 4 Competitive Landscape, 2024
- 4.1 Introduction
- 4.2 Strategic outlook
- 4.3 Innovation & sustainability landscape
Chapter 5 Market Size and Forecast, By Charging Type, 2021 – 2034 (Units, USD Billion)
- 5.1 Key trends
- 5.2 DC Fast
- 5.3 Others
Chapter 6 Market Size and Forecast, By Charging Site, 2021 – 2034 (Units, USD Billion)
- 6.1 Key trends
- 6.2 Public
- 6.3 Private
Chapter 7 Market Size and Forecast, By Region, 2021 – 2034 (Units, USD Billion)
- 7.1 Key trends
- 7.2 North America
- 7.2.1 U.S.
- 7.2.2 Canada
- 7.2.3 Mexico
- 7.3 Europe
- 7.3.1 Norway
- 7.3.2 Germany
- 7.3.3 France
- 7.3.4 Netherlands
- 7.3.5 UK
- 7.3.6 Sweden
- 7.4 Asia Pacific
- 7.4.1 China
- 7.4.2 Japan
- 7.4.3 India
- 7.4.4 South Korea
- 7.4.5 Singapore
- 7.5 Middle East & Africa
- 7.5.1 Saudi Arabia
- 7.5.2 UAE
- 7.5.3 South Africa
- 7.6 Latin America
- 7.6.1 Brazil
- 7.6.2 Argentina
Chapter 8 Company Profiles
- 8.1 ABB
- 8.2 Blink Charging
- 8.3 ChargePoint
- 8.4 Delta Electronics
- 8.5 EON
- 8.6 Eaton
- 8.7 EVBox
- 8.8 EVgo
- 8.9 Fortum
- 8.10 GreenWay Infrastructure
- 8.11 Leviton Manufacturing
- 8.12 Siemens
- 8.13 Starvo Global Energi
- 8.14 Tesla
- 8.15 Volta
