
|
市場調査レポート
商品コード
1666624
水素貯蔵タンク市場の機会、成長促進要因、産業動向分析、2025年~2034年の予測Hydrogen Storage Tanks Market Opportunity, Growth Drivers, Industry Trend Analysis, and Forecast 2025 - 2034 |
||||||
カスタマイズ可能
|
|||||||
| 水素貯蔵タンク市場の機会、成長促進要因、産業動向分析、2025年~2034年の予測 |
|
出版日: 2024年12月12日
発行: Global Market Insights Inc.
ページ情報: 英文 120 Pages
納期: 2~3営業日
|

全表示
- 概要
- 目次
水素貯蔵タンクの世界市場は、2024年に2億9,450万米ドルに達し、2025年から2034年にかけて41.2%の驚異的なCAGRで拡大すると予測されています。
この目覚ましい成長の背景には、輸送と産業の両分野で水素の採用が増加していることがあり、高圧タンクや極低温タンクなどの高度な貯蔵ソリューションが不可欠になっています。産業界がより持続可能なエネルギー源へと向かう中、水素はクリーンな代替燃料として支持を集めています。特に水素経済が勢いを増し始めるにつれて、信頼性が高く効率的で拡張性のある貯蔵システムの必要性が高まっています。軽量複合材料は、タンク効率の改善、安全性の向上、コスト削減において極めて重要な役割を果たしており、エネルギーキャリアとしての水素への迅速な移行を促進しています。さらに、燃料補給ネットワークや貯蔵方法を含む水素インフラに対する政府の多額の投資が、市場拡大を加速させています。
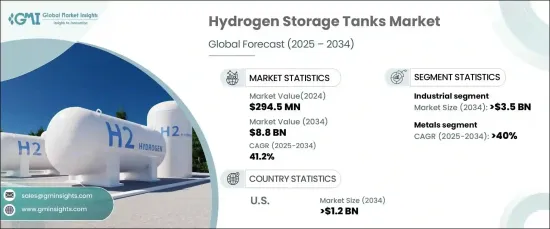
特に産業部門は、精製、金属加工、ガラス製造などの重要な用途で水素への依存度が高まっていることから、2034年までに35億米ドルを生み出すと予測されています。再生可能エネルギーへのシフトと、エネルギー輸入依存地域における水素貯蔵ソリューションの戦略的必要性が、市場の需要拡大に寄与しています。産業界が費用対効果が高く持続可能な代替品に注目する中、水素貯蔵タンクは増大するエネルギー需要を満たすために不可欠なものとなっています。
| 市場範囲 | |
|---|---|
| 開始年 | 2024 |
| 予測年 | 2025-2034 |
| 開始金額 | 2億9,450万米ドル |
| 予測金額 | 88億米ドル |
| CAGR | 41.2% |
製品別では、金属ベースの水素貯蔵タンクが2034年までにCAGR 40%で成長すると予測されます。この成長の主因は、この材料の卓越した強度と耐久性です。炭素繊維とポリマー樹脂の組み合わせは、構造的完全性を確保しながら極度の圧力に耐えることができる堅牢な複合材料を形成し、金属ベースのタンクを水素貯蔵用に高い信頼性を持たせています。
米国では、水素貯蔵タンク市場は2034年までに12億米ドルを生み出すと予測されています。この急成長の背景には、クリーンエネルギーへの積極的な投資と水素インフラの技術進歩があります。特に、水素自動車や再生可能エネルギー・システムが注目を集めるにつれて、高圧貯蔵システムの需要が伸びています。米国は、水素のエネルギー源としての実用性を高める軽量高圧貯蔵ソリューションの開発でも躍進しています。
目次
第1章 調査手法と調査範囲
- 市場範囲と定義
- 市場推計・予測パラメータ
- 予測計算
- データソース
- 1次データ
- 2次データ
- 有料
- 公的
第2章 エグゼクティブサマリー
第3章 業界洞察
- エコシステム分析
- 規制状況
- 業界への影響要因
- 促進要因
- 業界の潜在的リスク&課題
- 成長可能性分析
- ポーターの分析
- 供給企業の交渉力
- 買い手の交渉力
- 新規参入業者の脅威
- 代替品の脅威
- PESTEL分析
第4章 競合情勢
- イントロダクション
- 戦略的展望
- イノベーションと持続可能性の展望
第5章 市場規模・予測:素材別、2021年~2034年
- 主要動向
- 金属
- ガラス繊維
- 炭素繊維
第6章 市場規模・予測:タンクタイプ別、2021年~2034年
- 主要動向
- タイプ1
- タイプ2
- タイプ3
- タイプ4
第7章 市場規模・予測:圧力別、2021~2034年
- 主要動向
- 200 bar未満
- 200-500 bar
- 500 bar以上
第8章 市場規模・予測:貯蔵形態別、2021年~2034年
- 主要動向
- 物理ベース
- 材料ベース
第9章 市場規模・予測:用途別、2021年~2034年
- 主要動向
- 産業用
- 運輸
- その他
第10章 市場規模・予測:地域別、2021年~2034年
- 主要動向
- 北米
- 米国
- カナダ
- メキシコ
- 欧州
- ドイツ
- 英国
- フランス
- イタリア
- オランダ
- ロシア
- アジア太平洋
- 中国
- インド
- 日本
- 韓国
- 世界のその他の地域
第11章 企業プロファイル
- BayoTech
- Doosan Mobility Innovation
- ECS
- Hensoldt
- Hexagon Purus
- Luxfer Gas Cylinders
- Mahytec
- NPROXX
- Plastic Omnium
- Pragma Industries
- Quantum Fuel Systems
- Steelhead Composites
- Umoe Advanced Composites
- Weldship
- Worthington Industries
The Global Hydrogen Storage Tanks Market reached USD 294.5 million in 2024 and is projected to expand at an impressive CAGR of 41.2% from 2025 to 2034. This remarkable growth is fueled by the increasing adoption of hydrogen in both the transportation and industrial sectors, where advanced storage solutions like high-pressure and cryogenic tanks are becoming essential. As industries move toward more sustainable energy sources, hydrogen is gaining traction as a clean fuel alternative. The need for reliable, efficient, and scalable storage systems is rising, particularly as the hydrogen economy begins to gain more momentum. Lightweight composite materials are playing a pivotal role in improving tank efficiency, enhancing safety, and reducing costs, thus fostering a quicker transition to hydrogen as an energy carrier. Moreover, significant government investments in hydrogen infrastructure, including refueling networks and storage methods, are accelerating the market expansion.
The industrial sector, in particular, is projected to generate USD 3.5 billion by 2034, driven by the growing reliance on hydrogen in crucial applications such as refining, metal processing, and glass manufacturing. The shift towards renewable energy and the strategic necessity for hydrogen storage solutions in energy-import-dependent regions are contributing to the market's increasing demand. As industries focus on cost-effective and sustainable alternatives, hydrogen storage tanks have become indispensable for meeting growing energy needs.
| Market Scope | |
|---|---|
| Start Year | 2024 |
| Forecast Year | 2025-2034 |
| Start Value | $294.5 Million |
| Forecast Value | $8.8 Billion |
| CAGR | 41.2% |
Looking at the product segment, the metal-based hydrogen storage tanks are anticipated to grow at a CAGR of 40% by 2034. This growth is primarily driven by the material's exceptional strength and durability. The combination of carbon fibers with polymer resins forms a robust composite material capable of withstanding extreme pressures while ensuring structural integrity, making metal-based tanks highly reliable for hydrogen storage.
In the United States, the hydrogen storage tank market is forecast to generate USD 1.2 billion by 2034. This surge is backed by substantial investments in clean energy initiatives, as well as technological advancements in hydrogen infrastructure. The demand for high-pressure storage systems is growing, especially as hydrogen-powered vehicles and renewable energy systems gain prominence. The U.S. is also making strides in the development of lightweight, high-pressure storage solutions that enhance hydrogen's practicality as an energy source.
Table of Contents
Chapter 1 Methodology & Scope
- 1.1 Market scope & definitions
- 1.2 Market estimates & forecast parameters
- 1.3 Forecast calculation
- 1.4 Data sources
- 1.4.1 Primary
- 1.4.2 Secondary
- 1.4.2.1 Paid
- 1.4.2.2 Public
Chapter 2 Executive Summary
- 2.1 Industry synopsis, 2021 - 2034
Chapter 3 Industry Insights
- 3.1 Industry ecosystem analysis
- 3.2 Regulatory landscape
- 3.3 Industry impact forces
- 3.3.1 Growth drivers
- 3.3.2 Industry pitfalls & challenges
- 3.4 Growth potential analysis
- 3.5 Porter's analysis
- 3.5.1 Bargaining power of suppliers
- 3.5.2 Bargaining power of buyers
- 3.5.3 Threat of new entrants
- 3.5.4 Threat of substitutes
- 3.6 PESTEL analysis
Chapter 4 Competitive Landscape, 2024
- 4.1 Introduction
- 4.2 Strategic outlook
- 4.3 Innovation & sustainability landscape
Chapter 5 Market Size and Forecast, By Material, 2021 – 2034 (USD Million)
- 5.1 Key trends
- 5.2 Metals
- 5.3 Glass fibers
- 5.4 Carbon fibers
Chapter 6 Market Size and Forecast, By Tank Type, 2021 – 2034 (USD Million)
- 6.1 Key trends
- 6.2 Type 1
- 6.3 Type 2
- 6.4 Type 3
- 6.5 Type 4
Chapter 7 Market Size and Forecast, By Pressure, 2021 – 2034 (USD Million)
- 7.1 Key trends
- 7.2 Below 200 bar
- 7.3 200 - 500 bar
- 7.4 Above 500 bar
Chapter 8 Market Size and Forecast, By Storage Form, 2021 – 2034 (USD Million)
- 8.1 Key trends
- 8.2 Physical based
- 8.3 Material based
Chapter 9 Market Size and Forecast, By Application, 2021 – 2034 (USD Million)
- 9.1 Key trends
- 9.2 Industrial
- 9.3 Transportation
- 9.4 Others
Chapter 10 Market Size and Forecast, By Region, 2021 – 2034 (USD Million)
- 10.1 Key trends
- 10.2 North America
- 10.2.1 U.S.
- 10.2.2 Canada
- 10.2.3 Mexico
- 10.3 Europe
- 10.3.1 Germany
- 10.3.2 UK
- 10.3.3 France
- 10.3.4 Italy
- 10.3.5 Netherlands
- 10.3.6 Russia
- 10.4 Asia Pacific
- 10.4.1 China
- 10.4.2 India
- 10.4.3 Japan
- 10.4.4 South Korea
- 10.5 Rest of World
Chapter 11 Company Profiles
- 11.1 BayoTech
- 11.2 Doosan Mobility Innovation
- 11.3 ECS
- 11.4 Hensoldt
- 11.5 Hexagon Purus
- 11.6 Luxfer Gas Cylinders
- 11.7 Mahytec
- 11.8 NPROXX
- 11.9 Plastic Omnium
- 11.10 Pragma Industries
- 11.11 Quantum Fuel Systems
- 11.12 Steelhead Composites
- 11.13 Umoe Advanced Composites
- 11.14 Weldship
- 11.15 Worthington Industries

