
|
市場調査レポート
商品コード
1755345
水素生成市場:市場機会、成長促進要因、産業動向分析、将来予測(2025~2034年)Hydrogen Generation Market Opportunity, Growth Drivers, Industry Trend Analysis, and Forecast 2025 - 2034 |
||||||
カスタマイズ可能
|
|||||||
| 水素生成市場:市場機会、成長促進要因、産業動向分析、将来予測(2025~2034年) |
|
出版日: 2025年05月20日
発行: Global Market Insights Inc.
ページ情報: 英文 123 Pages
納期: 2~3営業日
|

全表示
- 概要
- 目次
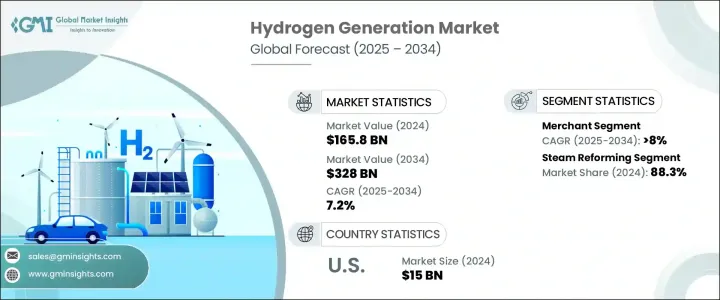
世界の水素生成の市場規模は、2024年に1,658億米ドルとなり、低炭素産業用燃料の需要増や、従来型の化石由来原料からよりクリーンな代替原料へのシフトにより、CAGR 7.2%で成長し、2034年には3,280億米ドルに達すると推定されます。
加えて、アンモニア製造、精製、合成燃料製造のようなセクターの脱炭素化に向けた継続的な取り組みが、低炭素水素の採用を大幅に後押しします。バス、トラック、船舶を含む水素燃料電池自動車(FCV)の人気の高まりは、水素補給ステーションの拡大とともに、市場成長をさらに刺激すると思われます。
炭素排出の削減を目的とした鉄鋼生産、化学製造、精製などの産業における水素の応用の高まりも、市場を牽引する重要な役割を果たすと思われます。水素インフラと技術の開発に対する財政的インセンティブ、助成金、補助金は、市場の見通しを強化します。しかし、輸入水素製造装置や部品に課される関税は、開発業者の資本支出を増加させ、プロジェクトのスケジュールを遅らせる可能性があるため、成長に影響を与える可能性があります。水素生成市場は、水蒸気改質、電気分解、その他などのセグメントに分けられますが、水蒸気改質はその費用対効果と確立されたインフラにより最大のシェアを占めています。
| 市場範囲 | |
|---|---|
| 開始年 | 2024年 |
| 予測期間 | 2025~2034年 |
| 当初の市場規模 | 1,658億米ドル |
| 市場規模予測 | 3,280億米ドル |
| CAGR | 7.2% |
水素生成市場の水蒸気改質セグメントは、2024年に88.3%のシェアを占めています。これは、コスト効率の高い生産能力と、その普及を支える確立されたインフラによるところが大きいです。水蒸気改質は、特に精製や石油化学のような産業において、様々なプロセスに必要な水素を生成する上で重要な役割を果たす水素製造方法として、長い間好まれてきました。
社内消費分野は2034年までに2,680億米ドルに達すると予想され、工業用・商業用のオンサイト水素生成への投資増加から恩恵を受けると思われます。このシフトは、サプライチェーンのリスクを軽減し、エネルギー安全保障を向上させることを目的としています。特に石油精製・化学産業では、自家消費用のグリーン水素技術の利用が拡大しており、市場拡大をさらに刺激すると思われます。さらに、クリーン・エネルギーの統合を奨励する政策的インセンティブが、様々なセクターにおける水素の継続的な採用を後押しすると思われます。
米国の水素生成市場の2024年の市場規模は150億米ドルで、発電と輸送セクターの両方における水素の役割の増大が原動力となっています。水素ベースのソリューションに対する需要は、送電網の柔軟性を向上させ、化石燃料への依存を減らし、クリーン・エネルギーへの移行をサポートしたいという願望に後押しされています。水素は、重工業や貨物・バスを含む輸送の脱炭素化において、ますます重要な役割を果たすようになっています。経済の脱炭素化に向けた官民の取り組みが水素技術の採用をさらに後押ししており、今後数年間で大きな市場成長が見込まれます。
世界水素生成市場の主要企業には、リンデ、エアープロダクツ&ケミカルズ、エア・リキード、マクフィー・エナジー、プラグパワーなどが含まれます。これらの企業は、水素製造技術の効率性と持続可能性を高めるための研究開発への投資など、市場での地位を強化するために様々な戦略を採用しています。多くの企業は、再生可能な水素ソリューションを統合することで製品提供を拡大し、水素インフラを構築するために他の業界プレーヤーと戦略的パートナーシップを結んでいます。
目次
第1章 分析手法と範囲
第2章 エグゼクティブサマリー
第3章 業界考察
- 業界エコシステム
- トランプ政権の関税分析
- 貿易への影響
- 貿易量の混乱
- 報復措置
- 業界への影響
- 供給側の影響(原材料)
- 主要原材料の価格変動
- サプライチェーンの再構築
- 生産コストへの影響
- 需要側の影響(販売価格)
- 最終市場への価格伝達
- 市場シェアの動向
- 消費者の反応パターン
- 供給側の影響(原材料)
- 影響を受ける主要企業
- 戦略的な業界対応
- サプライチェーンの再構成
- 価格設定と製品戦略
- 政策関与
- 展望と今後の検討事項
- 貿易への影響
- 規制情勢
- 業界への影響要因
- 促進要因
- 業界の潜在的リスクと課題
- 成長可能性分析
- ポーター分析
- PESTEL分析
第4章 競合情勢
- イントロダクション
- 企業の市場シェア
- 戦略的取り組み
- 競合ベンチマーキング
- 戦略的ダッシュボード
- イノベーションと持続可能性の情勢
第5章 市場の推計・予測:提供モード別(2021~2034年)
- 主要動向
- 社内消費
- 外部販売
第6章 市場の推計・予測:用途別(2021~2034年)
- 主要動向
- 石油精製
- 化学
- 金属
- その他
第7章 市場の推計・予測:工程別(2021~2034年)
- 主要動向
- 水蒸気改質
- 電気分解
- その他
第8章 市場の推計・予測:地域別(2021~2034年)
- 主要動向
- 北米
- 米国
- カナダ
- メキシコ
- 欧州
- ドイツ
- フランス
- 英国
- イタリア
- オランダ
- ロシア
- アジア太平洋
- 中国
- インド
- 日本
- 中東・アフリカ
- サウジアラビア
- イラン
- アラブ首長国連邦
- 南アフリカ
- ラテンアメリカ
- ブラジル
- アルゼンチン
- チリ
第9章 企業プロファイル
- Air Liquide
- Air Products and Chemicals
- Ballard Power Systems
- Ally Hi-Tech
- Claind
- Engie
- Caloric
- HyGear
- Iwatani Corporation
- Linde
- Mahler
- Messer
- McPhy Energy
- Nel ASA
- Nuvera Fuel Cells
- Plug Power
- Resonac Holdings Corporation
- Taiyo Nippon Sanso Corporation
- Teledyne Technologies Incorporated
- Xebec Adsorption
The Global Hydrogen Generation Market was valued at USD 165.8 billion in 2024 and is estimated to grow at a CAGR of 7.2% to reach USD 328 billion by 2034, driven by the increasing demand for low-carbon industrial fuels and a shift from traditional fossil-based feedstocks to cleaner alternatives. Additionally, the ongoing focus on decarbonizing sectors like ammonia production, refining, and synthetic fuel manufacturing will significantly boost the adoption of low-carbon hydrogen. The growing popularity of hydrogen fuel cell vehicles (FCVs), including buses, trucks, and ships, alongside the expansion of hydrogen refueling stations, will further stimulate market growth.
The rising application of hydrogen in industries such as steel production, chemical manufacturing, and refining, aimed at reducing carbon emissions, will also play a crucial role in driving the market. Financial incentives, grants, and subsidies for developing hydrogen infrastructure and technologies enhance the market outlook. However, tariffs imposed on imported hydrogen production equipment and components may affect growth, raising capital expenditures for developers and potentially delaying project timelines. The hydrogen generation market is divided into segments such as steam reforming, electrolysis, and others, with steam reforming holding the largest share due to its cost-effectiveness and established infrastructure.
| Market Scope | |
|---|---|
| Start Year | 2024 |
| Forecast Year | 2025-2034 |
| Start Value | $165.8 Billion |
| Forecast Value | $328 Billion |
| CAGR | 7.2% |
The steam reforming segment in the hydrogen generation market held 88.3% share in 2024. This is largely due to its cost-effective production capabilities and the well-established infrastructure that supports its widespread use. Steam reforming has long been the preferred method for hydrogen production, especially within industries like refining and petrochemicals, where it plays a crucial role in generating the hydrogen needed for various processes.
The captive segment is expected to reach USD 268 billion by 2034 and will benefit from increasing investments in on-site hydrogen generation for industrial and commercial use. This shift is aimed at mitigating supply chain risks and improving energy security. The growing use of green hydrogen technologies for in-house consumption, particularly in the refining and chemical industries, will further stimulate market expansion. Additionally, policy incentives encouraging the integration of clean energy will support the ongoing adoption of hydrogen across various sectors.
United States Hydrogen Generation Market was valued at USD 15 billion in 2024, driven by the increasing role of hydrogen in both power generation and the transportation sector. The demand for hydrogen-based solutions is driven by the desire to improve grid flexibility, reduce dependence on fossil fuels, and support the transition to clean energy. Hydrogen is increasingly a key player in decarbonizing heavy industries and transportation, including freight and buses. Public and private sector initiatives to decarbonize the economy are further propelling the adoption of hydrogen technologies, which is expected to lead to significant market growth in the years ahead.
Key players in the Global Hydrogen Generation Market include Linde, Air Products and Chemicals, Air Liquide, McPhy Energy, and Plug Power, among others. These companies are employing various strategies to strengthen their market position, including investments in research and development to enhance the efficiency and sustainability of hydrogen production technologies. Many companies are expanding their product offerings by integrating renewable hydrogen solutions and forming strategic partnerships with other industry players to build hydrogen infrastructure.
Table of Contents
Chapter 1 Methodology & Scope
- 1.1 Research design
- 1.2 Base estimates & calculations
- 1.3 Forecast calculation
- 1.4 Primary research & validation
- 1.4.1 Primary sources
- 1.4.2 Data mining sources
- 1.5 Market definitions
Chapter 2 Executive Summary
- 2.1 Industry synopsis, 2021 – 2034
Chapter 3 Industry Insights
- 3.1 Industry ecosystem
- 3.2 Trump administration tariff analysis
- 3.2.1 Impact on trade
- 3.2.1.1 Trade volume disruptions
- 3.2.1.2 Retaliatory measures
- 3.2.2 Impact on the industry
- 3.2.2.1 Supply-side impact (raw materials)
- 3.2.2.1.1 Price volatility in key materials
- 3.2.2.1.2 Supply chain restructuring
- 3.2.2.1.3 Production cost implications
- 3.2.2.2 Demand-side impact (selling price)
- 3.2.2.2.1 Price transmission to end markets
- 3.2.2.2.2 Market share dynamics
- 3.2.2.2.3 Consumer response patterns
- 3.2.2.1 Supply-side impact (raw materials)
- 3.2.3 Key companies impacted
- 3.2.4 Strategic industry responses
- 3.2.4.1 Supply chain reconfiguration
- 3.2.4.2 Pricing and product strategies
- 3.2.4.3 Policy engagement
- 3.2.5 Outlook and future considerations
- 3.2.1 Impact on trade
- 3.3 Regulatory landscape
- 3.4 Industry impact forces
- 3.4.1 Growth drivers
- 3.4.2 Industry pitfalls & challenges
- 3.5 Growth potential analysis
- 3.6 Porter's analysis
- 3.6.1 Bargaining power of suppliers
- 3.6.2 Bargaining power of buyers
- 3.6.3 Threat of new entrants
- 3.6.4 Threat of substitutes
- 3.7 PESTEL analysis
Chapter 4 Competitive landscape, 2024
- 4.1 Introduction
- 4.2 Company market share
- 4.3 Strategic initiative
- 4.4 Competitive benchmarking
- 4.5 Strategic dashboard
- 4.6 Innovation & sustainability landscape
Chapter 5 Market Size and Forecast, By Delivery Mode, 2021 - 2034 (USD Billion)
- 5.1 Key trends
- 5.2 Captive
- 5.3 Merchant
Chapter 6 Market Size and Forecast, By Application, 2021 - 2034 (USD Billion)
- 6.1 Key trends
- 6.2 Petroleum refinery
- 6.3 Chemical
- 6.4 Metal
- 6.5 Others
Chapter 7 Market Size and Forecast, By Process, 2021 - 2034 (USD Billion)
- 7.1 Key trends
- 7.2 Steam reformer
- 7.3 Electrolysis
- 7.4 Others
Chapter 8 Market Size and Forecast, By Region, 2021 - 2034 (USD Billion)
- 8.1 Key trends
- 8.2 North America
- 8.2.1 U.S.
- 8.2.2 Canada
- 8.2.3 Mexico
- 8.3 Europe
- 8.3.1 Germany
- 8.3.2 France
- 8.3.3 UK
- 8.3.4 Italy
- 8.3.5 Netherlands
- 8.3.6 Russia
- 8.4 Asia Pacific
- 8.4.1 China
- 8.4.2 India
- 8.4.3 Japan
- 8.5 Middle East & Africa
- 8.5.1 Saudi Arabia
- 8.5.2 Iran
- 8.5.3 UAE
- 8.5.4 South Africa
- 8.6 Latin America
- 8.6.1 Brazil
- 8.6.2 Argentina
- 8.6.3 Chile
Chapter 9 Company Profiles
- 9.1 Air Liquide
- 9.2 Air Products and Chemicals
- 9.3 Ballard Power Systems
- 9.4 Ally Hi-Tech
- 9.5 Claind
- 9.6 Engie
- 9.7 Caloric
- 9.8 HyGear
- 9.9 Iwatani Corporation
- 9.10 Linde
- 9.11 Mahler
- 9.12 Messer
- 9.13 McPhy Energy
- 9.14 Nel ASA
- 9.15 Nuvera Fuel Cells
- 9.16 Plug Power
- 9.17 Resonac Holdings Corporation
- 9.18 Taiyo Nippon Sanso Corporation
- 9.19 Teledyne Technologies Incorporated
- 9.20 Xebec Adsorption

