
ガス分析システムの市場機会、成長促進要因、産業動向分析、2025年~2034年予測
Gas Analyzer Systems Market Opportunity, Growth Drivers, Industry Trend Analysis, and Forecast 2025 - 2034- 発行日
- ページ情報
- 英文 135 Pages
- 納期
- 2~3営業日
- 商品コード
- 1801888
- カスタマイズ可能 お客様のご希望に応じて、既存データの加工や未掲載情報(例:国別セグメント)の追加などの対応が可能です。詳細はお問い合わせください。
- 翻訳ツール提供対象 PDF対応AI翻訳ツールの無料貸し出しサービスのご利用が可能です
概要
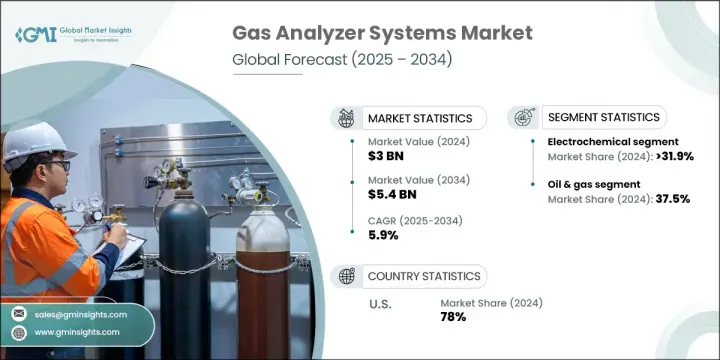
ガス分析システムの世界市場規模は、2024年に30億米ドルとなり、CAGR 5.9%で成長し、2034年には54億米ドルに達すると予測されています。
産業オートメーションの急増と正確な大気質モニタリングに対する需要の高まりが、先進的なガス分析システムの採用に拍車をかけている主要因です。これらのシステムは、厳しい排出規制、環境コンプライアンスへの関心の高まり、職場の安全性に対するニーズの高まりにより、複数の産業でますます不可欠になっています。技術の進歩とリアルタイムのモニタリング機能により、ガス分析装置はより効果的で信頼性の高いものとなっています。
環境への影響や産業の安全性に対する意識が高まるにつれ、飲食品、医薬品、エネルギーなどの産業は、コンプライアンスを維持し、業務効率を確保するためにガス分析計を利用するようになっています。排出ガス規制を強化する政府の施策も産業の採用を後押ししており、センサ技術の絶え間ない向上が技術革新と市場拡大を支えています。急速に進化する産業情勢の中で、エネルギー効率の改善、有害な混合ガスの検出、環境ハザードの防止が求められていることも、需要を後押ししています。
| 市場範囲 | |
|---|---|
| 開始年 | 2024年 |
| 予測年 | 2025~2034年 |
| 開始金額 | 30億米ドル |
| 予測金額 | 54億米ドル |
| CAGR | 5.9% |
電気化学ガス分析システムは2024年に31.9%のシェアを獲得し、2034年のCAGRは5.6%と予測されます。この技術は、工業排出物の増加や、正確で高感度なガスモニタリングツールに対する需要の高まりによって注目されています。これらのシステムは、製造装置、ラボ、その他操業基準を維持するために堅牢なガス検出機能を必要とする産業環境において、プロセスの最適化と安全遵守に広く利用されています。
石油・ガスセグメントは2024年に37.5%のシェアを占め、2034年までCAGR 5.5%で成長すると予測されています。このセグメントの成長は、炭化水素処理作業における危険ガスのリアルタイムモニタリングの重要なニーズによるところが大きいです。ガス分析システムは、腐食性混合物や水蒸気の検出において極めて重要であり、システムの完全性を高め、腐食関連の損傷を防止し、石油精製所やガスプラント全体の安全な作業環境を維持するのに役立っています。
米国のガス分析システム市場は78%のシェアを占め、2024年には7億9,800万米ドルを生み出します。エネルギーインフラ、製造業の近代化、産業安全への旺盛な投資がこの成長を支えています。排出ガスモニタリングを義務付ける規制への取り組みや、工業プロセスの自動化と持続可能性の推進が、米国の産業における高性能ガス分析計の幅広い展開を後押ししています。
世界のガス分析システム市場を形成している主要市場参入企業には、Fuji Electric、ABB、Siemens、Emerson Electric、Yokogawa Electricなどがあります。ガス分析システム市場の主要企業は、センサの精度、耐久性、リアルタイムモニタリング機能の強化を目的とした研究開発投資を通じて競合を強化しています。産業オートメーション企業との戦略的提携は、ガス分析システムをより広範な制御アーキテクチャに統合するのに役立ちます。コンプライアンスの要求に応えるため、企業はさまざまな地域で進化する規制基準に基づいてソリューションをカスタマイズしています。また、次世代産業ニーズに対応するため、コンパクトでユーザーフレンドリーなIoT対応システムで製品ポートフォリオを拡大しています。産業基盤が拡大している新興市場への地理的拡大も優先事項です。
目次
第1章 調査手法と範囲
第2章 エグゼクティブサマリー
第3章 産業考察
- エコシステム分析
- 原料の入手可能性と調達分析
- バリューチェーンに影響を与える主要因
- ディスラプション
- 規制情勢
- 産業への影響要因
- 促進要因
- 産業の潜在的リスク・課題
- 成長可能性分析
- ポーターの分析
- 供給企業の交渉力
- 買い手の交渉力
- 新規参入業者の脅威
- 代替品の脅威
- PESTEL分析
- ガス分析システムのコスト構造分析
- 新たな機会と動向
- IoT技術によるデジタル変革
- 新興市場への浸透
- 投資分析と将来展望
第4章 競合情勢
- イントロダクション
- 企業の市場シェア分析:地域別
- 北米
- 欧州
- アジア太平洋
- 中東・アフリカ
- ラテンアメリカ
- 戦略的取り組み
- 主要なパートナーシップとコラボレーション
- 主要なM&A活動
- 製品の革新と発売
- 市場拡大戦略
- 競合ベンチマーキング
- 戦略的ダッシュボード
- イノベーションと持続可能性の情勢
第5章 市場規模・予測:技術別、2021~2034年
- 主要動向
- 電気化学
- 常磁性
- ジルコニア(ZR)
- 非分散型赤外線(NDIR)
- その他
第6章 市場規模・予測:最終用途別、2021~2034年
- 主要動向
- 石油・ガス
- 化学と石油化学
- ヘルスケア
- 研究
- 水と廃水
- その他
第7章 市場規模・予測:地域別、2021~2034年
- 主要動向
- 北米
- 米国
- カナダ
- 欧州
- 英国
- ドイツ
- フランス
- イタリア
- ロシア
- ノルウェー
- アジア太平洋
- 中国
- 日本
- インド
- オーストラリア
- 韓国
- 中東・アフリカ
- サウジアラビア
- アラブ首長国連邦
- トルコ
- 南アフリカ
- ラテンアメリカ
- ブラジル
- メキシコ
- アルゼンチン
第8章 企業プロファイル
- ABB
- Advanced Micro Instruments, Inc.
- AVL List GmbH
- Buhler Technologies GmbH
- DAIICHI NEKKEN CO., LTD.
- DURAG GROUP
- Ecotech
- Emerson Electric Co.
- ENVEA
- Fuji Electric Co., Ltd
- Hiden Analytical
- HORIBA Group
- Leybold
- M& C TechGroup Germany
- METTLER TOLEDO
- Nova Analytical Systems
- Servomex
- Shimadzu Corporation
- SICK AG
- Siemens
- Thermo Fisher Scientific Inc.
- Yokogawa Electric Corporation
目次
The Global Gas Analyzer Systems Market was valued at USD 3 billion in 2024 and is estimated to grow at a CAGR of 5.9% to reach USD 5.4 billion by 2034. The surge in industrial automation and the rising demand for precise air quality monitoring are key drivers fueling the adoption of advanced gas analyzer systems. These systems are increasingly essential across multiple industries due to strict emissions regulations, heightened focus on environmental compliance, and a growing need for workplace safety. Technological advancements and real-time monitoring capabilities are making gas analysis equipment more effective and reliable.
As awareness around environmental impact and industrial safety increases, industries such as food and beverage, pharmaceuticals, and energy are turning to gas analyzers to maintain compliance and ensure operational efficiency. Government policies enforcing emissions control are also propelling industry adoption, while continuous improvements in sensor technologies support innovation and market expansion. The demand is further reinforced by the need to improve energy efficiency, detect harmful gas mixtures, and prevent environmental hazards across rapidly evolving industrial landscapes.
| Market Scope | |
|---|---|
| Start Year | 2024 |
| Forecast Year | 2025-2034 |
| Start Value | $3 Billion |
| Forecast Value | $5.4 Billion |
| CAGR | 5.9% |
Electrochemical gas analyzer systems captured a 31.9% share in 2024 and is forecast to grow at a CAGR of 5.6% through 2034. This technology is gaining prominence due to the rising industrial emissions and the increasing demand for accurate and sensitive gas monitoring tools. These systems are widely utilized in process optimization and safety compliance across manufacturing units, laboratories, and other industrial environments that require robust gas detection capabilities to maintain operational standards.
The oil & gas segment held a 37.5% share in 2024 and is projected to grow at a CAGR of 5.5% through 2034. The segment's growth is largely attributed to the critical need for real-time monitoring of hazardous gases in hydrocarbon processing operations. Gas analyzer systems are pivotal in detecting corrosive mixtures and water vapor, helping to enhance system integrity, prevent corrosion-related damage, and maintain safe working environments across oil refineries and gas plants.
United States Gas Analyzer Systems Market held 78% share, generating USD 798 million in 2024. Robust investments in energy infrastructure, manufacturing modernization, and industrial safety are supporting this growth. Regulatory efforts mandating emissions monitoring and the push toward automation and sustainability in industrial processes are encouraging broader deployment of high-performance gas analyzers across US industries.
Key market players shaping the Global Gas Analyzer Systems Market include Fuji Electric, ABB, Siemens, Emerson Electric, and Yokogawa Electric. Leading companies in the gas analyzer systems market are strengthening their competitive edge through R&D investments aimed at enhancing sensor accuracy, durability, and real-time monitoring features. Strategic collaborations with industrial automation firms help integrate gas analysis systems into broader control architectures. To meet compliance demands, businesses are tailoring solutions based on evolving regulatory standards across different regions. Additionally, players are expanding their product portfolios with compact, user-friendly, and IoT-enabled systems to cater to next-generation industrial needs. Geographic expansion into emerging markets with growing industrial bases is also a priority.
Table of Contents
Chapter 1 Methodology & Scope
- 1.1 Research design
- 1.2 Market estimates & forecast parameters
- 1.3 Forecast calculation
- 1.4 Data sources
- 1.4.1 Primary
- 1.4.2 Secondary
- 1.4.2.1 Paid
- 1.4.2.2 Public
- 1.5 Market definitions
Chapter 2 Executive Summary
- 2.1 Industry synopsis, 2021 - 2034
Chapter 3 Industry Insights
- 3.1 Industry ecosystem analysis
- 3.1.1 Raw material availability & sourcing analysis
- 3.1.2 Key factors affecting the value chain
- 3.1.3 Disruptions
- 3.2 Regulatory landscape
- 3.3 Industry impact forces
- 3.3.1 Growth drivers
- 3.3.2 Industry pitfalls & challenges
- 3.4 Growth potential analysis
- 3.5 Porter's analysis
- 3.5.1 Bargaining power of suppliers
- 3.5.2 Bargaining power of buyers
- 3.5.3 Threat of new entrants
- 3.5.4 Threat of substitutes
- 3.6 PESTEL analysis
- 3.6.1 Political factors
- 3.6.2 Economic factors
- 3.6.3 Social factors
- 3.6.4 Technological factors
- 3.6.5 Legal factors
- 3.6.6 Environmental factors
- 3.7 Cost structure analysis of gas analyzer systems
- 3.8 Emerging opportunities & trends
- 3.8.1 Digital transformation with IoT technologies
- 3.8.2 Emerging market penetration
- 3.9 Investment analysis & future outlook
Chapter 4 Competitive Landscape, 2025
- 4.1 Introduction
- 4.2 Company market share analysis, by region, 2024
- 4.2.1 North America
- 4.2.2 Europe
- 4.2.3 Asia Pacific
- 4.2.4 Middle East & Africa
- 4.2.5 Latin America
- 4.3 Strategic initiatives
- 4.3.1 Key partnerships & collaborations
- 4.3.2 Major M&A activities
- 4.3.3 Product innovations & launches
- 4.3.4 Market expansion strategies
- 4.4 Competitive benchmarking
- 4.5 Strategic dashboard
- 4.6 Innovation & sustainability landscape
Chapter 5 Market Size and Forecast, By Technology, 2021 - 2034 (USD Million)
- 5.1 Key trends
- 5.2 Electrochemical
- 5.3 Paramagnetic
- 5.4 Zirconia (ZR)
- 5.5 Non-Dispersive IR (NDIR)
- 5.6 Others
Chapter 6 Market Size and Forecast, By End Use, 2021 - 2034 (USD Million)
- 6.1 Key trends
- 6.2 Oil & Gas
- 6.3 Chemical & Petrochemical
- 6.4 Healthcare
- 6.5 Research
- 6.6 Water & Wastewater
- 6.7 Others
Chapter 7 Market Size and Forecast, By Region, 2021 - 2034 (USD Million)
- 7.1 Key trends
- 7.2 North America
- 7.2.1 U.S.
- 7.2.2 Canada
- 7.3 Europe
- 7.3.1 UK
- 7.3.2 Germany
- 7.3.3 France
- 7.3.4 Italy
- 7.3.5 Russia
- 7.3.6 Norway
- 7.4 Asia Pacific
- 7.4.1 China
- 7.4.2 Japan
- 7.4.3 India
- 7.4.4 Australia
- 7.4.5 South Korea
- 7.5 Middle East & Africa
- 7.5.1 Saudi Arabia
- 7.5.2 UAE
- 7.5.3 Turkey
- 7.5.4 South Africa
- 7.6 Latin America
- 7.6.1 Brazil
- 7.6.2 Mexico
- 7.6.3 Argentina
Chapter 8 Company Profiles
- 8.1 ABB
- 8.2 Advanced Micro Instruments, Inc.
- 8.3 AVL List GmbH
- 8.4 Buhler Technologies GmbH
- 8.5 DAIICHI NEKKEN CO., LTD.
- 8.6 DURAG GROUP
- 8.7 Ecotech
- 8.8 Emerson Electric Co.
- 8.9 ENVEA
- 8.10 Fuji Electric Co., Ltd
- 8.11 Hiden Analytical
- 8.12 HORIBA Group
- 8.13 Leybold
- 8.14 M&C TechGroup Germany
- 8.15 METTLER TOLEDO
- 8.16 Nova Analytical Systems
- 8.17 Servomex
- 8.18 Shimadzu Corporation
- 8.19 SICK AG
- 8.20 Siemens
- 8.21 Thermo Fisher Scientific Inc.
- 8.22 Yokogawa Electric Corporation
- 発行日
- 発行
- Global Market Insights Inc.
- ページ情報
- 英文 135 Pages
- 納期
- 2~3営業日

