
|
市場調査レポート
商品コード
1928909
バイオバニリン市場の機会、成長要因、業界動向分析、および2026年から2035年までの予測Bio Vanillin Market Opportunity, Growth Drivers, Industry Trend Analysis, and Forecast 2026 - 2035 |
||||||
カスタマイズ可能
|
|||||||
| バイオバニリン市場の機会、成長要因、業界動向分析、および2026年から2035年までの予測 |
|
出版日: 2026年01月08日
発行: Global Market Insights Inc.
ページ情報: 英文 190 Pages
納期: 2~3営業日
|

概要
世界のバイオバニリン市場は、2025年に1億1,980万米ドルと評価され、2035年までにCAGR5.9%で成長し、2億1,700万米ドルに達すると予測されています。
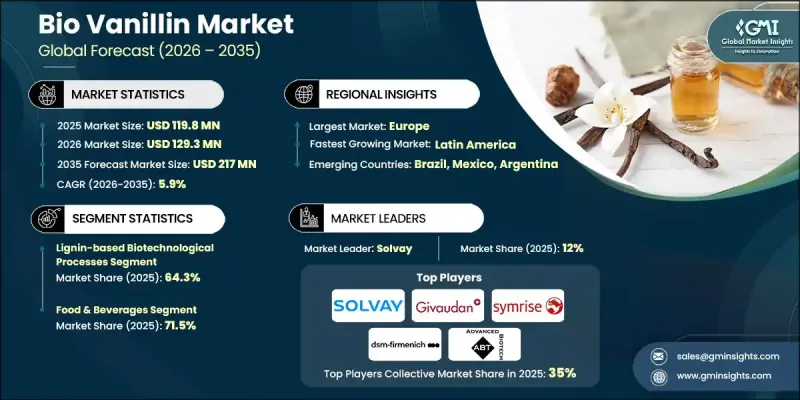
バイオバニリンは、持続可能な天然資源から生産されるため注目を集めており、合成バニリンに代わる環境に優しい選択肢として好まれています。先進的なバイオテクノロジープロセスにより、バイオバニリンは環境負荷低減に焦点を当てた世界の持続可能性イニシアチブに沿っています。食品、飲料、パーソナルケア分野における天然・クリーンラベル製品への消費者需要の高まりが、その採用を促進しています。各業界ではグリーンケミストリーを優先し、石油化学由来原料への依存度低減が加速しています。バイオバニリンは汎用性が高く、高品質な有機食品における高級香料としての利用が可能である一方、天然香料配合にも貢献します。持続可能性、本物の風味プロファイル、環境配慮型実践への世界的関心の高まりが、複数分野での採用を継続的に促進しており、バイオバニリンは現代の環境重視製品ポートフォリオにおける主要原料としての地位を確立しつつあります。
| 市場範囲 | |
|---|---|
| 開始年 | 2025年 |
| 予測年度 | 2026-2035 |
| 開始時価値 | 1億1,980万米ドル |
| 予測金額 | 2億1,700万米ドル |
| CAGR | 5.9% |
リグニンベースのバイオテクノロジープロセス分野は64.3%のシェアを占めており、2035年までCAGR5.5%で成長が見込まれています。これらのプロセスは再生可能なリグノセルロース系原料を利用し、循環型経済の原則を支えています。フェルラ酸の微生物発酵による変換は、その効率性と高純度バニリンの生産能力から、依然として主要な経路です。天然由来のオイゲノールやイソオイゲノールなどの代替原料も、製造業者に生産の柔軟性と持続可能性を提供します。
食品・飲料分野は2025年に71.5%のシェアを占め、2026年から2035年にかけてCAGR5.7%で成長すると予測されています。バイオバニリンは、クリーンラベルや天然由来の製品における高級香料成分として使用され、本物の味と環境に配慮した調達を求める消費者の期待に応えています。その芳香特性から、香料・香水用途でも好まれる成分であり、グリーンケミストリー(環境配慮型化学)の取り組みを支えています。
北米バイオバニリン市場は2025年に27.5%のシェアを占めました。同地域の拡大は、強力な製造能力、持続可能な生産体制、クリーンラベルおよび天然製品に対する消費者需要の高まりによって推進されています。米国は、再生可能原料に関する支援政策と環境配慮型製品処方の採用により、同地域をリードしています。
よくあるご質問
目次
第1章 調査手法と範囲
第2章 エグゼクティブサマリー
第3章 業界考察
- エコシステム分析
- サプライヤーの情勢
- 利益率
- 各段階における付加価値
- バリューチェーンに影響を与える要因
- ディスラプション
- 業界への影響要因
- 促進要因
- 自然由来・クリーンラベル原料に対する消費者需要の高まり
- 合成バニリンに対する規制圧力
- 食品飲料大手企業のサステナビリティへの取り組み
- 業界の潜在的リスク&課題
- バニリンの微生物宿主に対する毒性
- 高コストな生産対合成バニリン
- 市場機会
- 新興市場における地理的拡大
- 新規基材の利用(廃棄バイオマス)
- 促進要因
- 成長可能性分析
- 規制情勢
- 北米
- 欧州
- アジア太平洋地域
- ラテンアメリカ
- 中東・アフリカ
- ポーターの分析
- PESTEL分析
- 価格動向
- 地域別
- 生産技術別
- 今後の市場動向
- 技術とイノベーションの動向
- 現在の技術動向
- 新興技術
- 特許状況
- 貿易統計(HSコード)
(注:貿易統計は主要国のみ提供されます)
- 主要輸入国
- 主要な輸出国
- 持続可能性と環境面
- 持続可能な取り組み
- 廃棄物削減戦略
- 生産におけるエネルギー効率
- 環境に配慮した取り組み
- カーボンフットプリントへの配慮
第4章 競合情勢
- イントロダクション
- 企業の市場シェア分析
- 地域別
- 北米
- 欧州
- アジア太平洋地域
- ラテンアメリカ
- 中東・アフリカ地域
- 地域別
- 企業マトリクス分析
- 主要市場企業の競合分析
- 競合ポジショニングマトリックス
- 主な発展
- 合併・買収
- 提携・協業
- 新製品の発売
- 事業拡大計画
第5章 市場推計・予測:製造技術別、2022-2035
- リグニンベースのバイオテクノロジープロセス
- フェルラ酸のバイオ変換
- オイゲノール生物変換
- イソオイゲノールのバイオ変換
- その他の生産技術
- カフェ酸のバイオ変換
- グルコース発酵
- ベラトアルデヒドの生物変換
第6章 市場推計・予測:用途別、2022-2035
- 食品・飲料
- アイスクリーム・冷凍デザート
- チョコレート・ココア製品
- 菓子・ベーカリー製品
- 飲料
- 乳製品(ヨーグルト、フレーバーミルク)
- その他(シリアル、スナック、ソース類)
- 香料・香水
- 高級フレグランス
- パーソナルケア製品
- 家庭用品
- 医薬品
- 経口薬
- 外用剤
- ニュートラシューティカルズ・栄養補助食品
- 化粧品・パーソナルケア
- スキンケア製品
- ヘアケア製品
- カラー化粧品
- その他
- 工業用途
- 飼料添加物
第7章 市場推計・予測:地域別、2022-2035
- 北米
- 米国
- カナダ
- 欧州
- ドイツ
- 英国
- フランス
- スペイン
- イタリア
- その他欧州地域
- アジア太平洋地域
- 中国
- インド
- 日本
- オーストラリア
- 韓国
- その他アジア太平洋地域
- ラテンアメリカ
- ブラジル
- メキシコ
- アルゼンチン
- その他ラテンアメリカ地域
- 中東・アフリカ
- サウジアラビア
- 南アフリカ
- アラブ首長国連邦
- その他中東・アフリカ地域
第8章 企業プロファイル
- Solvay
- Givaudan
- Symrise AG
- DSM Firmenich
- Advanced Biotech
- Evolva
- Ennolys
- Comax Flavors
- Omega Ingredients Ltd
- Beijing LYS Chemicals Co., Ltd
- Aurochemicals
- Borregaard
- Alfrebro, LLC
- IFF(International Flavors &Fragrances)
- Lesaffre

