
|
市場調査レポート
商品コード
1666699
風力タービンの市場機会、成長促進要因、産業動向分析、2025年~2034年予測Wind Turbine Market Opportunity, Growth Drivers, Industry Trend Analysis, and Forecast 2025 - 2034 |
||||||
カスタマイズ可能
|
|||||||
| 風力タービンの市場機会、成長促進要因、産業動向分析、2025年~2034年予測 |
|
出版日: 2024年12月02日
発行: Global Market Insights Inc.
ページ情報: 英文 100 Pages
納期: 2~3営業日
|

全表示
- 概要
- 目次
風力タービンの世界市場は2024年に1,518億米ドルとなり、2025年から2034年にかけてCAGR7.4%で成長すると予測されています。
風力タービンは、風の運動エネルギーを機械エネルギーに変換し、発電に利用する重要な装置です。この再生可能エネルギー源は、化石燃料への依存を減らし、気候変動の課題に対処する上で極めて重要です。
風力エネルギーと蓄電ソリューションの統合が進み、企業の持続可能性への注目が高まっていることが、市場成長の主な促進要因となっています。各国が野心的な再生可能エネルギー目標を実施する中、風力エネルギーは世界の脱炭素戦略の要になりつつあります。開発者は環境に配慮した持続可能な風力発電プロジェクトを優先し、環境に優しい建設と運営を促進するための認証やベストプラクティスを採用しており、風力タービンの採用をさらに後押ししています。
| 市場範囲 | |
|---|---|
| 開始年 | 2024年 |
| 予測年 | 2025年~2034年 |
| 開始金額 | 1,518億米ドル |
| 予測金額 | 3,256億米ドル |
| CAGR | 7.4% |
軸タイプ別では、水平軸型風力タービン(HAWT)が優勢で、2034年までに3,030億米ドルになると予想されます。HAWTの効率性、拡張性、様々な用途への適応性がこの成長の要因となっています。ブレード材料、空気力学、構造設計の進歩により、その性能は大幅に向上し、特に、より強く安定した風を取り込む洋上風力発電所では好ましい選択肢となっています。
陸上設置は、2034年までCAGR5.5%で成長すると予想されています。この成長を支えているのは、技術革新、経済性、再生可能エネルギーの導入を促進する政府の取り組みの増加です。メーカー各社は、容量係数の高い大型タービンの開発に注力し、より少ないユニットでより多くの発電を可能にし、メガワットあたりの設置コストを引き下げています。また、既存の風力発電所を最新の効率的なタービンでリパワリングすることで、風力発電所の生産寿命が延び、エネルギー出力が向上しています。
米国の風力タービン市場は、技術の進歩、ロジスティクスの改善、革新的なビジネス戦略によって、2034年までに340億米ドルを生み出すと予想されています。風力エネルギーと蓄電システムの統合や、気候変動対策としての再生可能エネルギーへの需要の高まりが、市場の拡大に拍車をかけています。税制優遇措置、固定価格買取制度、再生可能エネルギー目標、風力エネルギーコストの低下などの支援政策が成長を刺激しています。
全体として、風力タービン市場は、技術の進歩、支持的な規制枠組み、持続可能性への世界の重点の高まりが市場拡大の原動力となっており、力強い成長が見込まれています。同分野は、よりクリーンで持続可能なエネルギーシステムへの移行において、世界的に極めて重要な役割を果たすことになると思われます。
目次
第1章 調査手法と調査範囲
- 調査デザイン
- 基本推定と計算
- 予測モデル
- 一次調査と検証
- 一次ソース
- データマイニングソース
- 市場定義
第2章 エグゼクティブサマリー
第3章 業界洞察
- 業界エコシステム
- 規制状況
- 業界への影響要因
- 成長促進要因
- 業界の潜在的リスク・課題
- 成長可能性分析
- ポーター分析
- 供給企業の交渉力
- 買い手の交渉力
- 新規参入業者の脅威
- 代替品の脅威
- PESTEL分析
第4章 競合情勢
- イントロダクション
- 戦略ダッシュボード
- イノベーションとテクノロジーの展望
第5章 市場規模・予測:軸別、2021年~2034年
- 主要動向
- 平行(HAWT)
- アップウインド
- 下風力
- 垂直(VAWT)
第6章 市場規模・予測:設備別、2021年~2034年
- 主要動向
- オンショア
- オフショア
第7章 市場規模・予測:接続性別、2021年~2034年
- 主要動向
- グリッド接続
- 独立型
第8章 市場規模・予測:定格別、2021年~2034年
- 主要動向
- 100 kW未満
- 100 kW~250 kW
- 250 kW~500 kW
- 500 kW~1 MW
- 1 MW~2 MW
- 2 MW以上
第9章 市場規模・予測:用途別、2021年~2034年
- 主要動向
- 住宅
- 商業・産業
- ユーティリティ
第10章 市場規模・予測:地域別、2021年~2034年
- 主要動向
- 北米
- 米国
- カナダ
- メキシコ
- 欧州
- ドイツ
- スペイン
- 英国
- フランス
- イタリア
- スウェーデン
- アジア太平洋
- 中国
- 日本
- 韓国
- インド
- オーストラリア
- 中東・アフリカ
- 南アフリカ
- エジプト
- ラテンアメリカ
- ブラジル
- チリ
- アルゼンチン
第11章 企業プロファイル
- Envision group
- Enercon
- General Electric
- Goldwind
- Mingyang Smart Energy Group Co., Ltd.
- Nordex
- Siemens Gamesa Renewable Energy
- Suzlon Energy
- Senvion
- Vestas
- Zhejiang Windey Co., Ltd.
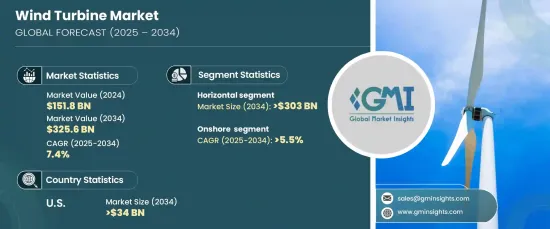
The Global Wind Turbine Market was valued at USD 151.8 billion in 2024 and is projected to grow at a CAGR of 7.4% from 2025 to 2034. Wind turbines are essential devices that convert the kinetic energy of wind into mechanical energy, which is then used to generate electricity. This renewable energy source is crucial in reducing reliance on fossil fuels and addressing the challenges of climate change.
The increasing integration of wind energy with storage solutions and the rising focus on sustainability by corporations are key drivers of market growth. Wind energy is becoming a cornerstone of global decarbonization strategies as countries implement ambitious renewable energy targets. Developers are prioritizing environmentally sustainable wind projects, adopting certifications and best practices to promote eco-friendly construction and operations, further boosting the adoption of wind turbines.
| Market Scope | |
|---|---|
| Start Year | 2024 |
| Forecast Year | 2025-2034 |
| Start Value | $151.8 Billion |
| Forecast Value | $325.6 Billion |
| CAGR | 7.4% |
By axis type, horizontal axis wind turbines (HAWTs) are expected to dominate, with USD 303 billion by 2034. Their efficiency, scalability, and adaptability across various applications contribute to this growth. Advancements in blade materials, aerodynamics, and structural designs have significantly enhanced their performance, making them the preferred choice, especially for offshore wind farms that capture stronger, more consistent winds.
Onshore installations are set to grow at a CAGR of 5.5% through 2034. This growth is supported by technological innovations, economic feasibility, and increasing government initiatives promoting renewable energy adoption. Manufacturers focus on developing larger turbines with higher capacity factors, enabling more power generation with fewer units and lowering installation costs per megawatt. Repowering existing wind farms with modern, efficient turbines is also extending their productive lifespan and boosting energy output.
U.S. wind turbine market is anticipated to generate USD 34 billion by 2034, driven by technological advancements, improved logistics, and innovative business strategies. The integration of wind energy with storage systems and the growing demand for renewable solutions to combat climate change fuel the market's expansion. Supportive policies, including tax incentives, feed-in tariffs, renewable energy targets, and declining wind energy costs, stimulate growth.
Overall, the wind turbine market is poised for robust growth, with technological advancement, supportive regulatory frameworks, and increasing global emphasis on sustainability driving its expansion. The sector is set to play a pivotal role in the transition to cleaner and more sustainable energy systems worldwide.
Table of Contents
Chapter 1 Methodology & Scope
- 1.1 Research design
- 1.2 Base estimates & calculations
- 1.3 Forecast model
- 1.4 Primary research & validation
- 1.4.1 Primary sources
- 1.4.2 Data mining sources
- 1.5 Market definitions
Chapter 2 Executive Summary
- 2.1 Industry synopsis, 2021 – 2034
Chapter 3 Industry Insights
- 3.1 Industry ecosystem
- 3.2 Regulatory landscape
- 3.3 Industry impact forces
- 3.3.1 Growth drivers
- 3.3.2 Industry pitfalls & challenges
- 3.4 Growth potential analysis
- 3.5 Porter's analysis
- 3.5.1 Bargaining power of suppliers
- 3.5.2 Bargaining power of buyers
- 3.5.3 Threat of new entrants
- 3.5.4 Threat of substitutes
- 3.6 PESTEL analysis
Chapter 4 Competitive landscape, 2024
- 4.1 Introduction
- 4.2 Strategic dashboard
- 4.3 Innovation & technology landscape
Chapter 5 Market Size and Forecast, By Axis, 2021 – 2034 (USD Million & MW)
- 5.1 Key trends
- 5.2 Horizontal (HAWTs)
- 5.2.1 Up-wind
- 5.2.2 Down-wind
- 5.3 Vertical (VAWTs)
Chapter 6 Market Size and Forecast, By Installation, 2021 – 2034 (USD Million & MW)
- 6.1 Key trends
- 6.2 Onshore
- 6.3 Offshore
Chapter 7 Market Size and Forecast, By Connectivity, 2021 – 2034 (USD Million & MW)
- 7.1 Key trends
- 7.2 Grid connected
- 7.3 Stand alone
Chapter 8 Market Size and Forecast, By Rating, 2021 – 2034 (USD Million & MW)
- 8.1 Key trends
- 8.2 < 100 kW
- 8.3 100 kW to 250 kW
- 8.4 > 250 kW to 500 kW
- 8.5 > 500 kW to 1 MW
- 8.6 1 MW to 2 MW
- 8.7 > 2 MW
Chapter 9 Market Size and Forecast, By Application, 2021 – 2034 (USD Million & MW)
- 9.1 Key trends
- 9.2 Residential
- 9.3 Commercial & industrial
- 9.4 Utility
Chapter 10 Market Size and Forecast, By Region, 2021 – 2034 (USD Million & MW)
- 10.1 Key trends
- 10.2 North America
- 10.2.1 U.S.
- 10.2.2 Canada
- 10.2.3 Mexico
- 10.3 Europe
- 10.3.1 Germany
- 10.3.2 Spain
- 10.3.3 UK
- 10.3.4 France
- 10.3.5 Italy
- 10.3.6 Sweden
- 10.4 Asia Pacific
- 10.4.1 China
- 10.4.2 Japan
- 10.4.3 South Korea
- 10.4.4 India
- 10.4.5 Australia
- 10.5 Middle East & Africa
- 10.5.1 South Africa
- 10.5.2 Egypt
- 10.6 Latin America
- 10.6.1 Brazil
- 10.6.2 Chile
- 10.6.3 Argentina
Chapter 11 Company Profiles
- 11.1 Envision group
- 11.2 Enercon
- 11.3 General Electric
- 11.4 Goldwind
- 11.5 Mingyang Smart Energy Group Co., Ltd.
- 11.6 Nordex
- 11.7 Siemens Gamesa Renewable Energy
- 11.8 Suzlon Energy
- 11.9 Senvion
- 11.10 Vestas
- 11.11 Zhejiang Windey Co., Ltd.

