
|
市場調査レポート
商品コード
1666895
冷却メーター市場の機会、成長促進要因、業界動向分析、2025~2034年の予測Cooling Meters Market Opportunity, Growth Drivers, Industry Trend Analysis, and Forecast 2025 - 2034 |
||||||
カスタマイズ可能
|
|||||||
| 冷却メーター市場の機会、成長促進要因、業界動向分析、2025~2034年の予測 |
|
出版日: 2024年12月20日
発行: Global Market Insights Inc.
ページ情報: 英文 100 Pages
納期: 2~3営業日
|

全表示
- 概要
- 目次
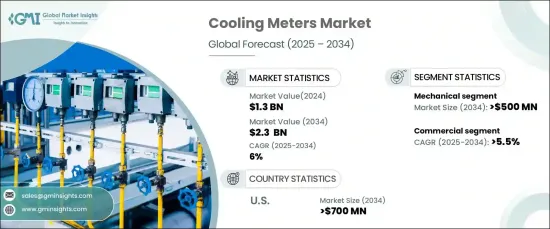
冷却メーターの世界市場は、2024年に13億米ドルと評価され、2025年から2034年にかけてCAGR 6%で安定的に成長すると予測されています。
冷却メーターは、空調、冷凍、地域冷却ネットワークなどのシステムで冷却エネルギー消費量や冷却速度を測定するために使用される重要な装置であり、温度、流量、エネルギー使用量などのパラメータを監視する上で重要な役割を果たしています。
これらの機器は、冷却効率とエネルギー管理の最適化に役立つため、エネルギー意識の高い産業や建物ではますます欠かせないものとなっています。エネルギーコストの上昇や環境問題への懸念から、エネルギー効率の高いシステムへの需要が高まるにつれ、冷却メーターは持続可能性への取り組みに不可欠な存在となっています。さらに、技術革新が進むにつれ、これらの機器の機能性と魅力が強化され、さまざまな分野での採用がさらに進んでいます。また、エネルギー消費の削減を目的としたより厳しい規制とともに、気候変動に対する意識の高まりも市場の拡大に寄与しています。
| 市場範囲 | |
|---|---|
| 開始年 | 2024 |
| 予測年 | 2025-2034 |
| 開始金額 | 13億米ドル |
| 予測金額 | 23億米ドル |
| CAGR | 6% |
冷却メーター市場は、技術によって機械式と静止式に分けられます。機械式セグメントは、2034年までに5億米ドルを創出すると予想されています。この成長は、冷水流量と温度差を直接測定する機械式冷却メーターの効率的で費用対効果が高く、信頼性の高い設計に起因しています。これらのメーターは、高度なスマート技術が必要ない環境で特に人気があります。LEEDのようなグリーン認証を目指す住宅や商業ビルで広く採用されており、市場需要をさらに高めています。
用途を考慮すると、冷却メーター市場は住宅、商業、工業セクターに区分されます。商業セクターは2034年までCAGR 5.5%で成長すると予測されています。企業や商業スペースがエネルギー効率を改善し、運用コストを削減する方法を模索する中、オフィス、モール、ホテルでの冷却メーターの需要は増加し続けています。特に、エネルギー集約型の冷房システムが環境に与える影響を軽減する持続可能なソリューションを企業が求めているため、冷却メーターはこれらのスペースでますます使用され、エネルギー使用の最適化に役立っています。
米国では、冷却メーター市場は2034年までに7億米ドルを創出すると予想されています。この成長を支えているのは、気候変動への対応を目的とした高度な建築基準の採用など、持続可能な建築慣行を促進する政府の奨励策や取り組みです。また、エネルギーの最適化とコスト削減の可能性に関する企業や消費者の意識の高まりも、市場拡大の原動力となっています。こうした市場動向と開発により、冷却メーターは今後も冷房エネルギー消費の最適化において重要な役割を果たし続けるものと思われます。
目次
第1章 調査手法と調査範囲
- 調査デザイン
- 基本推定と計算
- 予測モデル
- 1次調査と検証
- 一次情報
- データマイニングソース
- 市場定義
第2章 エグゼクティブサマリー
第3章 業界洞察
- 業界エコシステム
- 規制状況
- 業界への影響要因
- 促進要因
- 業界の潜在的リスク&課題
- 成長可能性分析
- ポーターの分析
- 供給企業の交渉力
- 買い手の交渉力
- 新規参入業者の脅威
- 代替品の脅威
- PESTEL分析
第4章 競争情勢
- イントロダクション
- 戦略ダッシュボード
- イノベーションとテクノロジーの展望
第5章 市場規模・予測:製品別、2021年~2034年
- 主要動向
- 超音波
- ボルテックス
- その他
第6章 市場規模・予測:技術別、2021年~2034年
- 主要動向
- 機械式
- 静止
第7章 市場規模・予測:用途別、2021年~2034年
- 主要動向
- 住宅用
- 商業用
- 大学
- オフィスビル
- 官公庁ビル
- その他
- 産業用
第8章 市場規模・予測:地域別、2021年~2034年
- 主要動向
- 北米
- 米国
- カナダ
- 欧州
- ドイツ
- ポーランド
- スウェーデン
- イタリア
- フランス
- アジア太平洋
- 中国
- 日本
- 韓国
- シンガポール
- インド
- 中東
- サウジアラビア
- UAE
- カタール
- オマーン
- クウェート
第9章 企業プロファイル
- Axioma Metering
- Danfoss
- Diehl Stiftung &Co. KG
- Honeywell International Inc.
- Integra
- Itron Inc.
- ista Energy Solutions Limited
- Kamstrup
- Landis+Gyr
- RB Flowmeter
- Schneider Electric
- Secure Meters Ltd.
- Siemens
- Smartdhome Srl
- Sontex SA
- Xylem
- ZENNER International GmbH &Co. KG
The Global Cooling Meters Market was valued at USD 1.3 billion in 2024 and is projected to grow at a steady CAGR of 6% from 2025 to 2034. Cooling meters, crucial devices used to measure cooling energy consumption or cooling rates in systems like air conditioning, refrigeration, and district cooling networks, play a vital role in monitoring parameters such as temperature, flow rate, and energy usage.
These devices help optimize cooling efficiency and energy management, making them increasingly indispensable in energy-conscious industries and buildings. As the demand for energy-efficient systems grows, driven by rising energy costs and environmental concerns, cooling meters are becoming an essential part of sustainability efforts. Additionally, ongoing innovations in technology continue to enhance the functionality and appeal of these devices, further driving their adoption across various sectors. Increasing awareness about climate change, along with more stringent regulations aimed at reducing energy consumption, also contributes to the market's expansion.
| Market Scope | |
|---|---|
| Start Year | 2024 |
| Forecast Year | 2025-2034 |
| Start Value | $1.3 Billion |
| Forecast Value | $2.3 Billion |
| CAGR | 6% |
The market is divided into mechanical and static cooling meters based on technology. The mechanical segment is expected to generate USD 500 million by 2034. This growth can be attributed to the efficient, cost-effective, and reliable design of mechanical cooling meters, which directly measure the flow of chilled water and temperature differences. These meters are particularly popular in settings where advanced smart technologies are not necessary. They are widely adopted in residential and commercial buildings that aim for green certifications, such as LEED, which further strengthens their market demand.
When considering applications, the cooling meters market is segmented into residential, commercial, and industrial sectors. The commercial sector is projected to grow at a CAGR of 5.5% through 2034. As businesses and commercial spaces look for ways to improve energy efficiency and reduce operational costs, the demand for cooling meters in offices, malls, and hotels continues to rise. Cooling meters are increasingly used in these spaces to help optimize energy usage, especially as companies look for sustainable solutions to mitigate the environmental impact of energy-intensive cooling systems.
In the U.S., the cooling meters market is expected to generate USD 700 million by 2034. This growth is supported by government incentives and initiatives promoting sustainable building practices, such as the adoption of advanced building codes aimed at addressing climate change. The increasing awareness among businesses and consumers about energy optimization and the potential for cost savings is also driving market expansion. With these market trends and developments, cooling meters are poised to continue playing a crucial role in optimizing cooling energy consumption in the years ahead.
Table of Contents
Chapter 1 Methodology & Scope
- 1.1 Research design
- 1.2 Base estimates & calculations
- 1.3 Forecast model
- 1.4 Primary research & validation
- 1.4.1 Primary sources
- 1.4.2 Data mining sources
- 1.5 Market definitions
Chapter 2 Executive Summary
- 2.1 Industry synopsis, 2021 – 2034
Chapter 3 Industry Insights
- 3.1 Industry ecosystem
- 3.2 Regulatory landscape
- 3.3 Industry impact forces
- 3.3.1 Growth drivers
- 3.3.2 Industry pitfalls & challenges
- 3.4 Growth potential analysis
- 3.5 Porter's analysis
- 3.5.1 Bargaining power of suppliers
- 3.5.2 Bargaining power of buyers
- 3.5.3 Threat of new entrants
- 3.5.4 Threat of substitutes
- 3.6 PESTEL analysis
Chapter 4 Competitive landscape, 2024
- 4.1 Introduction
- 4.2 Strategic dashboard
- 4.3 Innovation & technology landscape
Chapter 5 Market Size and Forecast, By Product, 2021 – 2034 (USD Million & ‘000 Units)
- 5.1 Key trends
- 5.2 Ultrasonic
- 5.3 Vortex
- 5.4 Others
Chapter 6 Market Size and Forecast, By Technology, 2021 – 2034 (USD Million & ‘000 Units)
- 6.1 Key trends
- 6.2 Mechanical
- 6.3 Static
Chapter 7 Market Size and Forecast, By Application, 2021 – 2034 (USD Million & ‘000 Units)
- 7.1 Key trends
- 7.2 Residential
- 7.3 Commercial
- 7.3.1 College/University
- 7.3.2 Office building
- 7.3.3 Government building
- 7.3.4 Others
- 7.4 Industrial
Chapter 8 Market Size and Forecast, By Region, 2021 – 2034 (USD Million & ‘000 Units)
- 8.1 Key trends
- 8.2 North America
- 8.2.1 U.S.
- 8.2.2 Canada
- 8.3 Europe
- 8.3.1 Germany
- 8.3.2 Poland
- 8.3.3 Sweden
- 8.3.4 Italy
- 8.3.5 France
- 8.4 Asia Pacific
- 8.4.1 China
- 8.4.2 Japan
- 8.4.3 South Korea
- 8.4.4 Singapore
- 8.4.5 India
- 8.5 Middle East
- 8.5.1 Saudi Arabia
- 8.5.2 UAE
- 8.5.3 Qatar
- 8.5.4 Oman
- 8.5.5 Kuwait
Chapter 9 Company Profiles
- 9.1 Axioma Metering
- 9.2 Danfoss
- 9.3 Diehl Stiftung & Co. KG
- 9.4 Honeywell International Inc.
- 9.5 Integra
- 9.6 Itron Inc.
- 9.7 ista Energy Solutions Limited
- 9.8 Kamstrup
- 9.9 Landis+Gyr
- 9.10 RB Flowmeter
- 9.11 Schneider Electric
- 9.12 Secure Meters Ltd.
- 9.13 Siemens
- 9.14 Smartdhome Srl
- 9.15 Sontex SA
- 9.16 Xylem
- 9.17 ZENNER International GmbH & Co. KG

