|
|
市場調査レポート
商品コード
1182873
北米の中圧スイッチギア市場 (2023年~2032年):市場規模 (電圧・コンポーネント・絶縁材・エンドユーザー・用途別)・国別展望・成長の潜在性・競合市場シェア・予測North America Medium Voltage Switchgear Market Size By Voltage, By Component, By Insulation, By End-Use, By Application, Country Outlook, Growth Potential, Competitive Market Share & Forecast, 2023 - 2032 |
||||||
|
|
|||||||
|
● お客様のご希望に応じて、既存データの加工や未掲載情報(例:国別セグメント)の追加などの対応が可能です。 詳細はお問い合わせください。 |
|||||||


| 北米の中圧スイッチギア市場 (2023年~2032年):市場規模 (電圧・コンポーネント・絶縁材・エンドユーザー・用途別)・国別展望・成長の潜在性・競合市場シェア・予測 |
|
出版日: 2022年12月19日
発行: Global Market Insights Inc.
ページ情報: 英文 230 Pages
納期: 2~3営業日
|
- 全表示
- 概要
- 図表
- 目次
北米の中圧スイッチギアの市場は、持続可能な送配電網のためのエネルギー効率の高い技術に対する需要の急増から、2032年にかけて飛躍的な成長を遂げると予想されています。
また、急増するエネルギー需要を満たすための政府による対策の強化、急速に進む都市化と消費者への電力供給の品質、価格、信頼性の向上などの要因も市場の拡大をもたらす見通しです。
電圧別で見ると、3~9kVの部門が今後数年で大きな成長を遂げると予想されています。この成長は、地域の分散型電力ネットワークに広く適用できることに起因しています。また、コンポーネント別では、スイッチ・断路器の部門が、製品の汎用性と配電ネットワーク全体の多様な用途から、有利な成長を示しています。
当レポートでは、北米の中圧スイッチギアの市場を調査し、市場概要、市場成長への各種影響因子の分析、法規制環境、イノベーションと技術の情勢、市場規模の推移・予測、各種区分・国別の内訳、競合環境、主要企業のプロファイルなどをまとめています。
目次
第1章 調査手法・調査範囲
第2章 エグゼクティブサマリー
第3章 北米の中圧スイッチギア産業の考察
- 産業エコシステム分析
- 規制状況
- COVID-19が産業の見通しに与える影響
- 価格動向分析
- 産業への影響要因
- 促進要因
- 潜在的リスク&課題
- 成長性分析
- ポーターの分析
- PESTEL分析
第3章 競合情勢
- イノベーション・技術の情勢
- 競合情勢
第4章 北米の中圧スイッチギア市場:電圧別
- 主要動向
- 3 kV~9 kV
- 9 kV~15 kV
- 15 kV~21 kV
- 21 kV~27 kV
- 27 kV~33 kV
- 33kV以上
第5章 北米の中圧スイッチギア市場:コンポーネント別
- 主要動向
- サーキットブレーカー
- コンタクター
- スイッチ・断路器
- ヒューズ
- その他
第6章 北米の中圧スイッチギア市場:絶縁材別
- 主要動向
- エア
- ガス
- オイル
- 真空
- その他
第7章 北米の中圧スイッチギア市場:エンドユーザー別
- 主要動向
- 発電所
- 変電所
- 地域電力供給
- その他
第8章 北米の中圧スイッチギア市場:用途別
- 主要動向
- 住宅
- 商業
- 産業
- ユーティリティ
第9章 北米の中圧スイッチギア市場:国別
- 主要動向
- 米国
- カナダ
- メキシコ
第10章 企業プロファイル
- ABB
- General Electric
- Siemens
- Eaton
- Ormazabal
- Toshiba Corporation
- CHINT Group
- Hyosung Heavy Industries
- Powell Industries
- Hyundai Electric & Energy Systems Co., Ltd.
- Avail Infrastructure Solutions
- Schneider Electric
- Mitsubishi Electric Corporation
- WEG
- CG Power & Industrial Solutions Ltd.
Data Tables
- TABLE 1 Industry impact forces
- TABLE 2 North America market from ≥ 3 kV to < 9 kV, 2019 - 2022 (Volume & Revenue)
- TABLE 3 North America market from ≥ 3 kV to < 9 kV, 2023 - 2027 (Volume & Revenue)
- TABLE 4 North America market from ≥ 3 kV to < 9 kV, 2028 - 2032 (Volume & Revenue)
- TABLE 5 North America market from ≥ 3 kV to < 9 kV, by country, 2019 - 2022 (‘000 Units)
- TABLE 6 North America market from ≥ 3 kV to < 9 kV, by country, 2023 - 2027 (‘000 Units)
- TABLE 7 North America market from ≥ 3 kV to < 9 kV, by country, 2028 - 2032 (‘000 Units)
- TABLE 8 North America market from ≥ 3 kV to < 9 kV, by country, 2019 - 2022 (USD Million)
- TABLE 9 North America market from ≥ 3 kV to < 9 kV, by country, 2023 - 2027 (USD Million)
- TABLE 10 North America market from ≥ 3 kV to < 9 kV, by country, 2028 - 2032 (USD Million)
- TABLE 11 North America market from ≥ 9 kV to < 15 kV, 2019 - 2022 (Volume & Revenue)
- TABLE 12 North America market from ≥ 9 kV to < 15 kV, 2023 - 2027 (Volume & Revenue)
- TABLE 13 North America market from ≥ 9 kV to < 15 kV, 2028 - 2032 (Volume & Revenue)
- TABLE 14 North America market from ≥ 9 kV to < 15 kV, by country, 2019 - 2022 (‘000 Units)
- TABLE 15 North America market from ≥ 9 kV to < 15 kV, by country, 2023 - 2027 (‘000 Units)
- TABLE 16 North America market from ≥ 9 kV to < 15 kV, by country, 2028 - 2032 (‘000 Units)
- TABLE 17 North America market from ≥ 9 kV to < 15 kV, by country, 2019 - 2022 (USD Million)
- TABLE 18 North America market from ≥ 9 kV to < 15 kV, by country, 2023 - 2027 (USD Million)
- TABLE 19 North America market from ≥ 9 kV to < 15 kV, by country, 2028 - 2032 (USD Million)
- TABLE 20 North America market from ≥ 15 kV to < 21 kV, 2019 - 2022 (Volume & Revenue)
- TABLE 21 North America market from ≥ 15 kV to < 21 kV, 2023 - 2027 (Volume & Revenue)
- TABLE 22 North America market from ≥ 15 kV to < 21 kV, 2028 - 2032 (Volume & Revenue)
- TABLE 23 North America market from ≥ 15 kV to < 21 kV, by country, 2019 - 2022 (‘000 Units)
- TABLE 24 North America market from ≥ 15 kV to < 21 kV, by country, 2023 - 2027 (‘000 Units)
- TABLE 25 North America market from ≥ 15 kV to < 21 kV, by country, 2028 - 2032 (‘000 Units)
- TABLE 26 North America market from ≥ 15 kV to < 21 kV, by country, 2019 - 2022 (USD Million)
- TABLE 27 North America market from ≥ 15 kV to < 21 kV, by country, 2023 - 2027 (USD Million)
- TABLE 28 North America market from ≥ 15 kV to < 21 kV, by country, 2028 - 2032 (USD Million)
- TABLE 29 North America market from ≥ 21 kV to < 27 kV, 2019 - 2022 (Volume & Revenue)
- TABLE 30 North America market from ≥ 21 kV to < 27 kV, 2023 - 2027 (Volume & Revenue)
- TABLE 31 North America market from ≥ 21 kV to < 27 kV, 2028 - 2032 (Volume & Revenue)
- TABLE 32 North America market from ≥ 21 kV to < 27 kV, by country, 2019 - 2022 (‘000 Units)
- TABLE 33 North America market from ≥ 21 kV to < 27 kV, by country, 2023 - 2027 (‘000 Units)
- TABLE 34 North America market from ≥ 21 kV to < 27 kV, by country, 2028 - 2032 (‘000 Units)
- TABLE 35 North America market from ≥ 21 kV to < 27 kV, by country, 2019 - 2022 (USD Million)
- TABLE 36 North America market from ≥ 21 kV to < 27 kV, by country, 2023 - 2027 (USD Million)
- TABLE 37 North America market from ≥ 21 kV to < 27 kV, by country, 2028 - 2032 (USD Million)
- TABLE 38 North America market from ≥ 27 kV to < 33 kV, 2019 - 2022 (Volume & Revenue)
- TABLE 39 North America market from ≥ 27 kV to < 33 kV, 2023 - 2027 (Volume & Revenue)
- TABLE 40 North America market from ≥ 27 kV to < 33 kV, 2028 - 2032 (Volume & Revenue)
- TABLE 41 North America market from ≥ 27 kV to < 33 kV, by country, 2019 - 2022 (‘000 Units)
- TABLE 42 North America market from ≥ 27 kV to < 33 kV, by country, 2023 - 2027 (‘000 Units)
- TABLE 43 North America market from ≥ 27 kV to < 33 kV, by country, 2028 - 2032 (‘000 Units)
- TABLE 44 North America market from ≥ 27 kV to < 33 kV, by country, 2019 - 2022 (USD Million)
- TABLE 45 North America market from ≥ 27 kV to < 33 kV, by country, 2023 - 2027 (USD Million)
- TABLE 46 North America market from ≥ 27 kV to < 33 kV, by country, 2028 - 2032 (USD Million)
- TABLE 47 North America market from ≥ 33 kV, 2019 - 2022 (Volume & Revenue)
- TABLE 48 North America market from ≥ 33 kV, 2023 - 2027 (Volume & Revenue)
- TABLE 49 North America market from ≥ 33 kV, 2028 - 2032 (Volume & Revenue)
- TABLE 50 North America market from ≥ 33 kV, by country, 2019 - 2022 (‘000 Units)
- TABLE 51 North America market from ≥ 33 kV, by country, 2023 - 2027 (‘000 Units)
- TABLE 52 North America market from ≥ 33 kV, by country, 2028 - 2032 (‘000 Units)
- TABLE 53 North America market from ≥ 33 kV, by country, 2019 - 2022 (USD Million)
- TABLE 54 North America market from ≥ 33 kV, by country, 2023 - 2027 (USD Million)
- TABLE 55 North America market from ≥ 33 kV, by country, 2028 - 2032 (USD Million)
- TABLE 56 North America market from circuit breakers, 2019 - 2022 (Volume & Revenue)
- TABLE 57 North America market from circuit breakers, 2023 - 2027 (Volume & Revenue)
- TABLE 58 North America market from circuit breakers, 2028 - 2032 (Volume & Revenue)
- TABLE 59 North America market from circuit breakers, by country, 2019 - 2022 (‘000 Units)
- TABLE 60 North America market from circuit breakers, by country, 2023 - 2027 (‘000 Units)
- TABLE 61 North America market from circuit breakers, by country, 2028 - 2032 (‘000 Units)
- TABLE 62 North America market from circuit breakers, by country, 2019 - 2022 (USD Million)
- TABLE 63 North America market from circuit breakers, by country, 2023 - 2027 (USD Million)
- TABLE 64 North America market from circuit breakers, by country, 2028 - 2032 (USD Million)
- TABLE 65 North America market from contactors, 2019 - 2022 (Volume & Revenue)
- TABLE 66 North America market from contactors, 2023 - 2027 (Volume & Revenue)
- TABLE 67 North America market from contactors, 2028 - 2032 (Volume & Revenue)
- TABLE 68 North America market from contactors, by country, 2019 - 2022 (‘000 Units)
- TABLE 69 North America market from contactors, by country, 2023 - 2027 (‘000 Units)
- TABLE 70 North America market from contactors, by country, 2028 - 2032 (‘000 Units)
- TABLE 71 North America market from contactors, by country, 2019 - 2022 (USD Million)
- TABLE 72 North America market from contactors, by country, 2023 - 2027 (USD Million)
- TABLE 73 North America market from contactors, by country, 2028 - 2032 (USD Million)
- TABLE 74 North America market from switches & disconnectors, 2019 - 2022 (Volume & Revenue)
- TABLE 75 North America market from switches & disconnectors, 2023 - 2027 (Volume & Revenue)
- TABLE 76 North America market from switches & disconnectors, 2028 - 2032 (Volume & Revenue)
- TABLE 77 North America market from switches & disconnectors, by country, 2019 - 2022 (‘000 Units)
- TABLE 78 North America market from switches & disconnectors, by country, 2023 - 2027 (‘000 Units)
- TABLE 79 North America market from switches & disconnectors, by country, 2028 - 2032 (‘000 Units)
- TABLE 80 North America market from switches & disconnectors, by country, 2019 - 2022 (USD Million)
- TABLE 81 North America market from switches & disconnectors, by country, 2023 - 2027 (USD Million)
- TABLE 82 North America market from switches & disconnectors, by country, 2028 - 2032 (USD Million)
- TABLE 83 North America market from fuses, 2019 - 2022 (Volume & Revenue)
- TABLE 84 North America market from fuses, 2023 - 2027 (Volume & Revenue)
- TABLE 85 North America market from fuses, 2028 - 2032 (Volume & Revenue)
- TABLE 86 North America market from fuses, by country, 2019 - 2022 (‘000 Units)
- TABLE 87 North America market from fuses, by country, 2023 - 2027 (‘000 Units)
- TABLE 88 North America market from fuses, by country, 2028 - 2032 (‘000 Units)
- TABLE 89 North America market from fuses, by country, 2019 - 2022 (USD Million)
- TABLE 90 North America market from fuses, by country, 2023 - 2027 (USD Million)
- TABLE 91 North America market from fuses, by country, 2028 - 2032 (USD Million)
- TABLE 92 North America market from others, 2019 - 2022 (Volume & Revenue)
- TABLE 93 North America market from others, 2023 - 2027 (Volume & Revenue)
- TABLE 94 North America market from others, 2028 - 2032 (Volume & Revenue)
- TABLE 95 North America market from others, by country, 2019 - 2022 (‘000 Units)
- TABLE 96 North America market from others, by country, 2023 - 2027 (‘000 Units)
- TABLE 97 North America market from others, by country, 2028 - 2032 (‘000 Units)
- TABLE 98 North America market from others, by country, 2019 - 2022 (USD Million)
- TABLE 99 North America market from others, by country, 2023 - 2027 (USD Million)
- TABLE 100 North America market from others, by country, 2028 - 2032 (USD Million)
- TABLE 101 North America market from air, 2019 - 2022 (Volume & Revenue)
- TABLE 102 North America market from air, 2023 - 2027 (Volume & Revenue)
- TABLE 103 North America market from air, 2028 - 2032 (Volume & Revenue)
- TABLE 104 North America market from air, by country, 2019 - 2022 (‘000 Units)
- TABLE 105 North America market from air, by country, 2023 - 2027 (‘000 Units)
- TABLE 106 North America market from air, by country, 2028 - 2032 (‘000 Units)
- TABLE 107 North America market from air, by country, 2019 - 2022 (USD Million)
- TABLE 108 North America market from air, by country, 2023 - 2027 (USD Million)
- TABLE 109 North America market from air, by country, 2028 - 2032 (USD Million)
- TABLE 110 North America market from gas, 2019 - 2022 (Volume & Revenue)
- TABLE 111 North America market from gas, 2023 - 2027 (Volume & Revenue)
- TABLE 112 North America market from gas, 2028 - 2032 (Volume & Revenue)
- TABLE 113 North America market from gas, by country, 2019 - 2022 (‘000 Units)
- TABLE 114 North America market from gas, by country, 2023 - 2027 (‘000 Units)
- TABLE 115 North America market from gas, by country, 2028 - 2032 (‘000 Units)
- TABLE 116 North America market from gas, by country, 2019 - 2022 (USD Million)
- TABLE 117 North America market from gas, by country, 2023 - 2027 (USD Million)
- TABLE 118 North America market from gas, by country, 2028 - 2032 (USD Million)
- TABLE 119 North America market from oil, 2019 - 2022 (Volume & Revenue)
- TABLE 120 North America market from oil, 2023 - 2027 (Volume & Revenue)
- TABLE 121 North America market from oil, 2028 - 2032 (Volume & Revenue)
- TABLE 122 North America market from oil, by country, 2019 - 2022 (‘000 Units)
- TABLE 123 North America market from oil, by country, 2023 - 2027 (‘000 Units)
- TABLE 124 North America market from oil, by country, 2028 - 2032 (‘000 Units)
- TABLE 125 North America market from oil, by country, 2019 - 2022 (USD Million)
- TABLE 126 North America market from oil, by country, 2023 - 2027 (USD Million)
- TABLE 127 North America market from oil, by country, 2028 - 2032 (USD Million)
- TABLE 128 North America market from vacuum, 2019 - 2022 (Volume & Revenue)
- TABLE 129 North America market from vacuum, 2023 - 2027 (Volume & Revenue)
- TABLE 130 North America market from vacuum, 2028 - 2032 (Volume & Revenue)
- TABLE 131 North America market from vacuum, by country, 2019 - 2022 (‘000 Units)
- TABLE 132 North America market from vacuum, by country, 2023 - 2027 (‘000 Units)
- TABLE 133 North America market from vacuum, by country, 2028 - 2032 (‘000 Units)
- TABLE 134 North America market from vacuum, by country, 2019 - 2022 (USD Million)
- TABLE 135 North America market from vacuum, by country, 2023 - 2027 (USD Million)
- TABLE 136 North America market from vacuum, by country, 2028 - 2032 (USD Million)
- TABLE 137 North America market from others, 2019 - 2022 (Volume & Revenue)
- TABLE 138 North America market from others, 2023 - 2027 (Volume & Revenue)
- TABLE 139 North America market from others, 2028 - 2032 (Volume & Revenue)
- TABLE 140 North America market from others, by country, 2019 - 2022 (‘000 Units)
- TABLE 141 North America market from others, by country, 2023 - 2027 (‘000 Units)
- TABLE 142 North America market from others, by country, 2028 - 2032 (‘000 Units)
- TABLE 143 North America market from others, by country, 2019 - 2022 (USD Million)
- TABLE 144 North America market from others, by country, 2023 - 2027 (USD Million)
- TABLE 145 North America market from others, by country, 2028 - 2032 (USD Million)
- TABLE 146 North America market from power stations, 2019 - 2022 (Volume & Revenue)
- TABLE 147 North America market from power stations, 2023 - 2027 (Volume & Revenue)
- TABLE 148 North America market from power stations, 2028 - 2032 (Volume & Revenue)
- TABLE 149 North America market from power stations, by country, 2019 - 2022 (‘000 Units)
- TABLE 150 North America market from power stations, by country, 2023 - 2027 (‘000 Units)
- TABLE 151 North America market from power stations, by country, 2028 - 2032 (‘000 Units)
- TABLE 152 North America market from power stations, by country, 2019 - 2022 (USD Million)
- TABLE 153 North America market from power stations, by country, 2023 - 2027 (USD Million)
- TABLE 154 North America market from power stations, by country, 2028 - 2032 (USD Million)
- TABLE 155 North America market from transformer substations, 2019 - 2022 (Volume & Revenue)
- TABLE 156 North America market from transformer substations, 2023 - 2027 (Volume & Revenue)
- TABLE 157 North America market from transformer substations, 2028 - 2032 (Volume & Revenue)
- TABLE 158 North America market from transformer substations, by country, 2019 - 2022 (‘000 Units)
- TABLE 159 North America market from transformer substations, by country, 2023 - 2027 (‘000 Units)
- TABLE 160 North America market from transformer substations, by country, 2028 - 2032 (‘000 Units)
- TABLE 161 North America market from transformer substations, by country, 2019 - 2022 (USD Million)
- TABLE 162 North America market from transformer substations, by country, 2023 - 2027 (USD Million)
- TABLE 163 North America market from transformer substations, by country, 2028 - 2032 (USD Million)
- TABLE 164 North America market from local electricity supply, 2019 - 2022 (Volume & Revenue)
- TABLE 165 North America market from local electricity supply, 2023 - 2027 (Volume & Revenue)
- TABLE 166 North America market from local electricity supply, 2028 - 2032 (Volume & Revenue)
- TABLE 167 North America market from local electricity supply, by country, 2019 - 2022 (‘000 Units)
- TABLE 168 North America market from local electricity supply, by country, 2023 - 2027 (‘000 Units)
- TABLE 169 North America market from local electricity supply, by country, 2028 - 2032 (‘000 Units)
- TABLE 170 North America market from local electricity supply, by country, 2019 - 2022 (USD Million)
- TABLE 171 North America market from local electricity supply, by country, 2023 - 2027 (USD Million)
- TABLE 172 North America market from local electricity supply, by country, 2028 - 2032 (USD Million)
- TABLE 173 North America market from others, 2019 - 2022 (Volume & Revenue)
- TABLE 174 North America market from others, 2023 - 2027 (Volume & Revenue)
- TABLE 175 North America market from others, 2028 - 2032 (Volume & Revenue)
- TABLE 176 North America market from others, by country, 2019 - 2022 (‘000 Units)
- TABLE 177 North America market from others, by country, 2023 - 2027 (‘000 Units)
- TABLE 178 North America market from others, by country, 2028 - 2032 (‘000 Units)
- TABLE 179 North America market from others, by country, 2019 - 2022 (USD Million)
- TABLE 180 North America market from others, by country, 2023 - 2027 (USD Million)
- TABLE 181 North America market from others, by country, 2028 - 2032 (USD Million)
- TABLE 182 North America market from residential, 2019 - 2022 (Volume & Revenue)
- TABLE 183 North America market from residential, 2023 - 2027 (Volume & Revenue)
- TABLE 184 North America market from residential, 2028 - 2032 (Volume & Revenue)
- TABLE 185 North America market from residential, by country, 2019 - 2022 (‘000 Units)
- TABLE 186 North America market from residential, by country, 2023 - 2027 (‘000 Units)
- TABLE 187 North America market from residential, by country, 2028 - 2032 (‘000 Units)
- TABLE 188 North America market from residential, by country, 2019 - 2022 (USD Million)
- TABLE 189 North America market from residential, by country, 2023 - 2027 (USD Million)
- TABLE 190 North America market from residential, by country, 2028 - 2032 (USD Million)
- TABLE 191 North America market from commercial, 2019 - 2022 (Volume & Revenue)
- TABLE 192 North America market from commercial, 2023 - 2027 (Volume & Revenue)
- TABLE 193 North America market from commercial, 2028 - 2032 (Volume & Revenue)
- TABLE 194 North America market from commercial, by country, 2019 - 2022 (‘000 Units)
- TABLE 195 North America market from commercial, by country, 2023 - 2027 (‘000 Units)
- TABLE 196 North America market from commercial, by country, 2028 - 2032 (‘000 Units)
- TABLE 197 North America market from commercial, by country, 2019 - 2022 (USD Million)
- TABLE 198 North America market from commercial, by country, 2023 - 2027 (USD Million)
- TABLE 199 North America market from commercial, by country, 2028 - 2032 (USD Million)
- TABLE 200 North America market from industrial, 2019 - 2022 (Volume & Revenue)
- TABLE 201 North America market from industrial, 2023 - 2027 (Volume & Revenue)
- TABLE 202 North America market from industrial, 2028 - 2032 (Volume & Revenue)
- TABLE 203 North America market from industrial, by country, 2019 - 2022 (‘000 Units)
- TABLE 204 North America market from industrial, by country, 2023 - 2027 (‘000 Units)
- TABLE 205 North America market from industrial, by country, 2028 - 2032 (‘000 Units)
- TABLE 206 North America market from industrial, by country, 2019 - 2022 (USD Million)
- TABLE 207 North America market from industrial, by country, 2023 - 2027 (USD Million)
- TABLE 208 North America market from industrial, by country, 2028 - 2032 (USD Million)
- TABLE 209 North America market from utility, 2019 - 2022 (Volume & Revenue)
- TABLE 210 North America market from utility, 2023 - 2027 (Volume & Revenue)
- TABLE 211 North America market from utility, 2028 - 2032 (Volume & Revenue)
- TABLE 212 North America market from utility, by country, 2019 - 2022 (‘000 Units)
- TABLE 213 North America market from utility, by country, 2023 - 2027 (‘000 Units)
- TABLE 214 North America market from utility, by country, 2028 - 2032 (‘000 Units)
- TABLE 215 North America market from utility, by country, 2019 - 2022 (USD Million)
- TABLE 216 North America market from utility, by country, 2023 - 2027 (USD Million)
- TABLE 217 North America market from utility, by country, 2028 - 2032 (USD Million)
- TABLE 218 U.S. market, 2019 - 2022 (Volume & Revenue)
- TABLE 219 U.S. market, 2023 - 2027 (Volume & Revenue)
- TABLE 220 U.S. market, 2028 - 2032 (Volume & Revenue)
- TABLE 221 U.S. market by voltage, 2019 - 2022 (Units)
- TABLE 222 U.S. market by voltage, 2023 - 2027 (Units)
- TABLE 223 U.S. market by voltage, 2028 - 2032 (Units)
- TABLE 224 U.S. market by voltage, 2019 - 2022 (USD Million)
- TABLE 225 U.S. market by voltage, 2023 - 2027 (USD Million)
- TABLE 226 U.S. market by voltage, 2028 - 2032 (USD Million)
- TABLE 227 U.S. market by component, 2019 - 2022 (Units)
- TABLE 228 U.S. market by component, 2023 - 2027 (Units)
- TABLE 229 U.S. market by component, 2028 - 2032 (Units)
- TABLE 230 U.S. market by component, 2019 - 2022 (USD Million)
- TABLE 231 U.S. market by component, 2023 - 2027 (USD Million)
- TABLE 232 U.S. market by component, 2028 - 2032 (USD Million)
- TABLE 233 U.S. market by insulation, 2019 - 2022 (Units)
- TABLE 234 U.S. market by insulation, 2023 - 2027 (Units)
- TABLE 235 U.S. market by insulation, 2028 - 2032 (Units)
- TABLE 236 U.S. market by insulation, 2019 - 2022 (USD Million)
- TABLE 237 U.S. market by insulation, 2023 - 2027 (USD Million)
- TABLE 238 U.S. market by insulation, 2028 - 2032 (USD Million)
- TABLE 239 U.S. market by end use, 2019 - 2022 (Units)
- TABLE 240 U.S. market by end use, 2023 - 2027 (Units)
- TABLE 241 U.S. market by end use, 2028 - 2032 (Units)
- TABLE 242 U.S. market by end use, 2019 - 2022 (USD Million)
- TABLE 243 U.S. market by end use, 2023 - 2027 (USD Million)
- TABLE 244 U.S. market by end use, 2028 - 2032 (USD Million)
- TABLE 245 U.S. market by application, 2019 - 2022 (Units)
- TABLE 246 U.S. market by application, 2023 - 2027 (Units)
- TABLE 247 U.S. market by application, 2028 - 2032 (Units)
- TABLE 248 U.S. market by application, 2019 - 2022 (USD Million)
- TABLE 249 U.S. market by application, 2023 - 2027 (USD Million)
- TABLE 250 U.S. market by application, 2028 - 2032 (USD Million)
- TABLE 251 Canada market, 2019 - 2022 (Volume & Revenue)
- TABLE 252 Canada market, 2023 - 2027 (Volume & Revenue)
- TABLE 253 Canada market, 2028 - 2032 (Volume & Revenue)
- TABLE 254 Canada market by voltage, 2019 - 2022 (Units)
- TABLE 255 Canada market by voltage, 2023 - 2027 (Units)
- TABLE 256 Canada market by voltage, 2028 - 2032 (Units)
- TABLE 257 Canada market by voltage, 2019 - 2022 (USD Million)
- TABLE 258 Canada market by voltage, 2023 - 2027 (USD Million)
- TABLE 259 Canada market by voltage, 2028 - 2032 (USD Million)
- TABLE 260 Canada market by component, 2019 - 2022 (Units)
- TABLE 261 Canada market by component, 2023 - 2027 (Units)
- TABLE 262 Canada market by component, 2028 - 2032 (Units)
- TABLE 263 Canada market by component, 2019 - 2022 (USD Million)
- TABLE 264 Canada market by component, 2023 - 2027 (USD Million)
- TABLE 265 Canada market by component, 2028 - 2032 (USD Million)
- TABLE 266 Canada market by insulation, 2019 - 2022 (Units)
- TABLE 267 Canada market by insulation, 2023 - 2027 (Units)
- TABLE 268 Canada market by insulation, 2028 - 2032 (Units)
- TABLE 269 Canada market by insulation, 2019 - 2022 (USD Million)
- TABLE 270 Canada market by insulation, 2023 - 2027 (USD Million)
- TABLE 271 Canada market by insulation, 2028 - 2032 (USD Million)
- TABLE 272 Canada market by end use, 2019 - 2022 (Units)
- TABLE 273 Canada market by end use, 2023 - 2027 (Units)
- TABLE 274 Canada market by end use, 2028 - 2032 (Units)
- TABLE 275 Canada market by end use, 2019 - 2022 (USD Million)
- TABLE 276 Canada market by end use, 2023 - 2027 (USD Million)
- TABLE 277 Canada market by end use, 2028 - 2032 (USD Million)
- TABLE 278 Canada market by application, 2019 - 2022 (Units)
- TABLE 279 Canada market by application, 2023 - 2027 (Units)
- TABLE 280 Canada market by application, 2028 - 2032 (Units)
- TABLE 281 Canada market by application, 2019 - 2022 (USD Million)
- TABLE 282 Canada market by application, 2023 - 2027 (USD Million)
- TABLE 283 Canada market by application, 2028 - 2032 (USD Million)
- TABLE 284 Mexico market, 2019 - 2022 (Volume & Revenue)
- TABLE 285 Mexico market, 2023 - 2027 (Volume & Revenue)
- TABLE 286 Mexico market, 2028 - 2032 (Volume & Revenue)
- TABLE 287 Mexico market by voltage, 2019 - 2022 (Units)
- TABLE 288 Mexico market by voltage, 2023 - 2027 (Units)
- TABLE 289 Mexico market by voltage, 2028 - 2032 (Units)
- TABLE 290 Mexico market by voltage, 2019 - 2022 (USD Million)
- TABLE 291 Mexico market by voltage, 2023 - 2027 (USD Million)
- TABLE 292 Mexico market by voltage, 2028 - 2032 (USD Million)
- TABLE 293 Mexico market by component, 2019 - 2022 (Units)
- TABLE 294 Mexico market by component, 2023 - 2027 (Units)
- TABLE 295 Mexico market by component, 2028 - 2032 (Units)
- TABLE 296 Mexico market by component, 2019 - 2022 (USD Million)
- TABLE 297 Mexico market by component, 2023 - 2027 (USD Million)
- TABLE 298 Mexico market by component, 2028 - 2032 (USD Million)
- TABLE 299 Mexico market by insulation, 2019 - 2022 (Units)
- TABLE 300 Mexico market by insulation, 2023 - 2027 (Units)
- TABLE 301 Mexico market by insulation, 2028 - 2032 (Units)
- TABLE 302 Mexico market by insulation, 2019 - 2022 (USD Million)
- TABLE 303 Mexico market by insulation, 2023 - 2027 (USD Million)
- TABLE 304 Mexico market by insulation, 2028 - 2032 (USD Million)
- TABLE 305 Mexico market by end use, 2019 - 2022 (Units)
- TABLE 306 Mexico market by end use, 2023 - 2027 (Units)
- TABLE 307 Mexico market by end use, 2028 - 2032 (Units)
- TABLE 308 Mexico market by end use, 2019 - 2022 (USD Million)
- TABLE 309 Mexico market by end use, 2023 - 2027 (USD Million)
- TABLE 310 Mexico market by end use, 2028 - 2032 (USD Million)
- TABLE 311 Mexico market by application, 2019 - 2022 (Units)
- TABLE 312 Mexico market by application, 2023 - 2027 (Units)
- TABLE 313 Mexico market by application, 2028 - 2032 (Units)
- TABLE 314 Mexico market by application, 2019 - 2022 (USD Million)
- TABLE 315 Mexico market by application, 2023 - 2027 (USD Million)
- TABLE 316 Mexico market by application, 2028 - 2032 (USD Million)
Charts & Figures
- FIG. 1 GMI report coverage: critical research elements
- FIG. 2 Industry segmentation
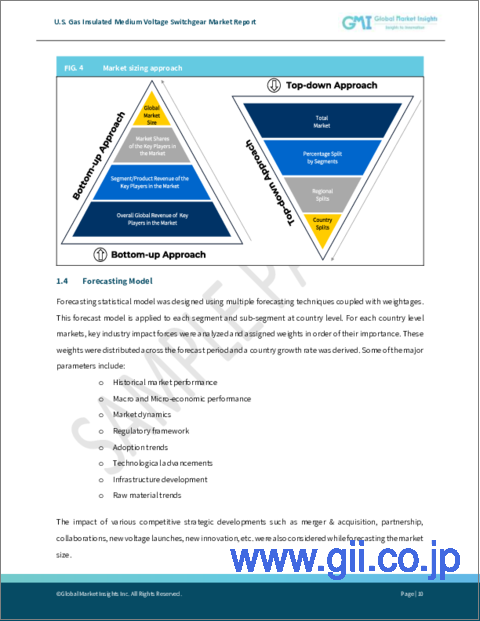
- FIG. 3 Market forecasting methodology
- FIG. 4 Industry ecosystem analysis
- FIG. 5 Overall impact of COVID- 19, 2019 - 2032 (USD Million)
- FIG. 6 Price trend analysis (USD/Unit)
- FIG. 7 Growth potential analysis
- FIG. 8 Porter's Analysis
- FIG. 9 PESTEL Analysis
- FIG. 10 SWOT Analysis, ABB
- FIG. 11 SWOT Analysis, General Electric
- FIG. 12 SWOT Analysis, Siemens
- FIG. 13 SWOT Analysis, Eaton
- FIG. 14 SWOT Analysis, Ormazabal
- FIG. 15 SWOT Analysis, Toshiba Corporation
- FIG. 16 SWOT Analysis, CHINT Group
- FIG. 17 SWOT Analysis, Hyosung Heavy Industries
- FIG. 18 SWOT Analysis, Powell Industries
- FIG. 19 SWOT Analysis, Hyundai Electric & Energy Systems Co, Ltd.
- FIG. 20 SWOT Analysis, Avail Infrastructure Solutions
- FIG. 21 SWOT Analysis, Schneider Electric
- FIG. 22 SWOT Analysis, Mitsubishi Electric Corporation
- FIG. 23 SWOT analysis, WEG
- FIG. 24 SWOT Analysis, CG Power and Industrial Solutions Ltd.
North America Medium Voltage Switchgear Market share is slated to grow exponentially through 2032, owing to the constantly surging demand for energy-efficient technologies for sustainable transmission and distribution networks. Besides, constant measures taken by central governments to encourage the adoption of enhanced technological systems to suffice the surging energy demand will further offer several growth prospects to the market.
In addition, the rapidly increasing urbanization rate combined with enhancing the quality, affordability, and reliability of electricity supply to consumers are some of the crucial factors driving the integration of sustainable infrastructure, thereby resulting in the market expansion.
Overall, the North America medium voltage switchgear market is segmented in terms of voltage, component, insulation, end-use, application, and country.
Considering the voltage, the ≥ 3 kV to < 9 kV high voltage switchgear segment is expected to register considerable growth over the forthcoming years. The growth can be attributed to its widespread applicability across decentralized power networks in the region.
Based on components, the switches and disconnectors segment will showcase lucrative growth owing to the product versatility and diverse applicability across distribution networks. Besides, switches and disconnectors are among the most commonly used electrical devices across different circuits, which is further expected to spur product adoption over the coming years.
Based on insulation, the air-insulated switchgear segment is projected to witness massive growth by 2032. The product benefits that prompt its adoption across North America include less construction work, less time for the erection of air-insulated substations, and reduced fault risks. Moreover, the switchgears are also largely incorporated and best suited for low voltage rating substations, which will eventually support the segmental expansion.
By end-use, the local electricity supply segment is anticipated to exhibit massive growth between 2023 and 2032, as local electricity supply offers several significant economic as well as environmental benefits to a community. Besides, ongoing initiatives by the US and Canada governments to promote energy efficiency, both in their operations and in their communities, will further offer significant prospects for segmental growth in the near future.
Considering the application, the commercial applications segment is set to grow positively owing to the mounting electricity demand from healthcare establishments, educational institutes, and banks, among many others. It is worth noting that the healthcare facilities across the United States consume approximately 10% of the total energy used in the commercial buildings across the country.
In the regional context, Canada medium voltage switchgear market is expected to grow rapidly owing to the ongoing investments in development of the renewable energy sector and microgrid networks. In addition, introduction of Foreign Direct Investment (FDI) schemes to update the overall economic growth and constant commercialization and industrialization will drive the regional growth further over the forecast period.
Table of Contents
Chapter 1 Methodology & Scope
- 1.1 Market scope and definitions
- 1.2 Base estimates & calculations
- 1.3 Forecast calculations
- 1.4 Data sources
- 1.4.1 Primary
- 1.4.2 Secondary
- 1.4.2.1 Paid sources
- 1.4.2.2 Public sources
Chapter 2 North America Medium Voltage Switchgear Industry Insights
- 2.1 Industry ecosystem analysis
- 2.1.1 Vendor matrix
- 2.2 Regulatory Landscape
- 2.2.1 North America
- 2.2.1.1 U.S.
- 2.2.1.1.1 IEC vs ANSI Switchgear - Understanding the Global Standards
- 2.2.1.1.2 ANSI and IEEE voltage classes
- 2.2.1.1.3 30 CFR § 56.12020 - Protection of persons at switchgear.
- 2.2.1.1.4 Cal. Code Regs. Tit. 8, § 2858 - Metal-enclosed Power Switchgear
- 2.2.1.1.5 NEMA 260 1996 (2004)
- 2.2.1.1.6 The U.S. approval system for electrical switchgear
- 2.2.1.1.7 Sulfur Hexafluoride (SF6)
- 2.2.1.1.8 Key Elements of the Regulation
- 2.2.1.1.9 Environmental Objectives
- 2.2.1.1.10 Affected Entities
- 2.2.1.1 U.S.
- 2.2.2 IEC standards for switchgears
- 2.2.2.1 Canada
- 2.2.2.1.1 National Standard of Canada - Domestic
- 2.2.2.1.2 C22.2 NO. 31-14 - Switchgear assemblies
- 2.2.2.2 Mexico
- 2.2.2.2.1 Mexico Market Access for Safety Requirements
- 2.2.2.1 Canada
- 2.2.1 North America
- 2.3 COVID- 19 impact on the industry outlook
- 2.4 Price trend analysis
- 2.5 Industry impact forces
- 2.5.1 Growth drivers
- 2.5.1.1 Expansion of smart grid networks
- 2.5.1.2 Refurbishment & retrofit of the existing grid infrastructure
- 2.5.1.3 Grid stability & security of supply concerns
- 2.5.2 Industry pitfalls and challenges
- 2.5.2.1 High dependency on imports
- 2.5.1 Growth drivers
- 2.6 Growth potential analysis
- 2.7 Porter's Analysis
- 2.7.1 Bargaining power of suppliers
- 2.7.2 Bargaining power of buyers
- 2.7.3 Threat of new entrants
- 2.7.4 Threat of substitutes
- 2.8 PESTEL Analysis
Chapter 3 Competitive Landscape, 2021
- 3.1 Innovation & technology landscape
- 3.1.1 Schneider Electric
- 3.1.2 General Electric
- 3.1.3 Eaton
- 3.1.4 ABB
- 3.1.5 Siemens
- 3.1.6 Mitsubishi Electric Corporation
- 3.1.7 Other innovations
- 3.2 Competitive landscape, 2022
- 3.2.1 Strategy dashboard
- 3.2.1.1 ABB
- 3.2.1.1.1 Product launch
- 3.2.1.2 Siemens
- 3.2.1.2.1 Collaboration
- 3.2.1.2.2 Product launch
- 3.2.1.2.3 Acquisition
- 3.2.1.3 GE
- 3.2.1.3.1 Product launch
- 3.2.1.4 Schneider Electric
- 3.2.1.4.1 Product launch
- 3.2.1.4.2 Acquisition
- 3.2.1.4.3 Product launch
- 3.2.1.5 Mitsubishi Electric
- 3.2.1.5.1 Collaboration
- 3.2.1.6 Toshiba Corporation
- 3.2.1.6.1 Collaboration
- 3.2.1.1 ABB
- 3.2.1 Strategy dashboard
Chapter 4 North America Medium Voltage Switchgear Market, By Voltage
- 4.1 Key voltage trends
- 4.2 ≥ 3 kV to < 9 kV
- 4.2.1 North America market from ≥ 3 kV to < 9 kV, 2019 - 2032
- 4.2.2 North America market from ≥ 3 kV to < 9 kV, by country, 2019 - 2032
- 4.3 ≥ 9 kV to < 15 kV
- 4.3.1 North America market from ≥ 9 kV to < 15 kV, 2019 - 2032
- 4.3.2 North America market from ≥ 9 kV to < 15 kV, by country, 2019 - 2032
- 4.4 ≥ 15 kV to < 21 kV
- 4.4.1 North America market from ≥ 15 kV to < 21 kV, 2019 - 2032
- 4.4.2 North America market from ≥ 15 kV to < 21 kV, by country, 2019 - 2032
- 4.5 ≥ 21 kV to < 27 kV
- 4.5.1 North America market from ≥ 21 kV to < 27 kV, 2019 - 2032
- 4.5.2 North America market from ≥ 21 kV to < 27 kV, by country, 2019 - 2032
- 4.6 ≥ 27 kV to < 33 kV
- 4.6.1 North America market from ≥ 27 kV to < 33 kV, 2019 - 2032
- 4.6.2 North America market from ≥ 27 kV to < 33 kV, by country, 2019 - 2032
- 4.7 ≥ 33 kV
- 4.7.1 North America market from ≥ 33 kV, 2019 - 2032
- 4.7.2 North America market from ≥ 33 kV, by country, 2019 - 2032
Chapter 5 North America Medium Voltage Switchgear Market, By Component
- 5.1 Key component trends
- 5.2 Circuit breakers
- 5.2.1 North America market from circuit breakers, 2019 - 2032
- 5.2.2 North America market from circuit breakers, by country, 2019 - 2032
- 5.3 Contactors
- 5.3.1 North America market from contactors, 2019 - 2032
- 5.3.2 North America market from contactors, by country, 2019 - 2032
- 5.4 Switches & disconnectors
- 5.4.1 North America market from switches & disconnectors, 2019 - 2032
- 5.4.2 North America market from switches & disconnectors, by country, 2019 - 2032
- 5.5 Fuses
- 5.5.1 North America market from fuses, 2019 - 2032
- 5.5.2 North America market from fuses, by country, 2019 - 2032
- 5.6 Others
- 5.6.1 North America market from others, 2019 - 2032
- 5.6.2 North America market from others, by country, 2019 - 2032
Chapter 6 North America Medium Voltage Switchgear Market, By Insulation
- 6.1 Key insulation trends
- 6.2 Air
- 6.2.1 North America market from air, 2019 - 2032
- 6.2.2 North America market from air, by country, 2019 - 2032
- 6.3 Gas
- 6.3.1 North America market from gas, 2019 - 2032
- 6.3.2 North America market from gas, by country, 2019 - 2032
- 6.4 Oil
- 6.4.1 North America market from oil, 2019 - 2032
- 6.4.2 North America market from oil, by country, 2019 - 2032
- 6.5 Vacuum
- 6.5.1 North America market from vacuum, 2019 - 2032
- 6.5.2 North America market from vacuum, by country, 2019 - 2032
- 6.6 Others
- 6.6.1 North America market from others, 2019 - 2032
- 6.6.2 North America market from others, by country, 2019 - 2032
Chapter 7 North America Medium Voltage Switchgear Market, By End Use
- 7.1 Key end use trends
- 7.2 Power stations
- 7.2.1 North America market from power stations, 2019 - 2032
- 7.2.2 North America market from power stations, by country, 2019 - 2032
- 7.3 Transformer substations
- 7.3.1 North America market from transformer substations, 2019 - 2032
- 7.3.2 North America market from transformer substations, by country, 2019 - 2032
- 7.4 Local electricity supply
- 7.4.1 North America market from local electricity supply, 2019 - 2032
- 7.4.2 North America market from local electricity supply, by country, 2019 - 2032
- 7.5 Others
- 7.5.1 North America market from others, 2019 - 2032
- 7.5.2 North America market from others, by country, 2019 - 2032
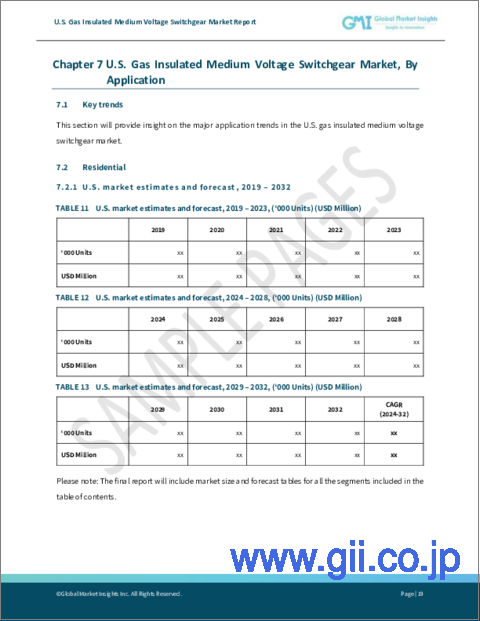
Chapter 8 North America Medium Voltage Switchgear Market, By Application
- 8.1 Key application trends
- 8.2 Residential
- 8.2.1 North America market from residential, 2019 - 2032
- 8.2.2 North America market from residential, by country, 2019 - 2032
- 8.3 Commercial
- 8.3.1 North America market from commercial, 2019 - 2032
- 8.3.2 North America market from commercial, by country, 2019 - 2032
- 8.4 Industrial
- 8.4.1 North America market from industrial, 2019 - 2032
- 8.4.2 North America market from industrial, by country, 2019 - 2032
- 8.5 Utility
- 8.5.1 North America market from utility, 2019 - 2032
- 8.5.2 North America market from utility, by country, 2019 - 2032
Chapter 9 North America Medium Voltage Switchgear Market, By Country
- 9.1 Key country trends
- 9.2 U.S.
- 9.2.1 U.S. market, 2019 - 2032
- 9.2.2 U.S. market by voltage, 2019 - 2032
- 9.2.3 U.S. market by component, 2019 - 2032
- 9.2.4 U.S. market by insulation, 2019 - 2032
- 9.2.5 U.S. market by end use, 2019 - 2032
- 9.2.6 U.S. market by application, 2019 - 2032
- 9.3 Canada
- 9.3.1 Canada market, 2019 - 2032
- 9.3.2 Canada market by voltage, 2019 - 2032
- 9.3.3 Canada market by component, 2019 - 2032
- 9.3.4 Canada market by insulation, 2019 - 2032
- 9.3.5 Canada market by end use, 2019 - 2032
- 9.3.6 Canada market by application, 2019 - 2032
- 9.4 Mexico
- 9.4.1 Mexico market, 2019 - 2032
- 9.4.2 Mexico market by voltage, 2019 - 2032
- 9.4.3 Mexico market by component, 2019 - 2032
- 9.4.4 Mexico market by insulation, 2019 - 2032
- 9.4.5 Mexico market by end use, 2019 - 2032
- 9.4.6 Mexico market by application, 2019 - 2032
Chapter 10 Company Profiles
- 10.1 ABB
- 10.1.1 Business overview
- 10.1.2 Financial data
- 10.1.3 Product landscape
- 10.1.4 SWOT analysis
- 10.2 General Electric
- 10.2.1 Business overview
- 10.2.2 Financial data
- 10.2.3 Product landscape
- 10.2.4 SWOT analysis
- 10.3 Siemens
- 10.3.1 Business overview
- 10.3.2 Financial data
- 10.3.3 Product landscape
- 10.3.4 Strategic outlook
- 10.3.5 SWOT analysis
- 10.4 Eaton
- 10.4.1 Business overview
- 10.4.2 Financial data
- 10.4.3 Product landscape
- 10.4.4 SWOT analysis
- 10.5 Ormazabal
- 10.5.1 Business overview
- 10.5.2 Financial data
- 10.5.3 Product landscape
- 10.5.4 SWOT analysis
- 10.6 Toshiba Corporation
- 10.6.1 Business overview
- 10.6.2 Financial data
- 10.6.3 Product landscape
- 10.6.4 Strategic outlook
- 10.6.5 SWOT analysis
- 10.7 CHINT Group
- 10.7.1 Business overview
- 10.7.2 Financial data
- 10.7.3 Product landscape
- 10.7.4 SWOT analysis
- 10.8 Hyosung Heavy Industries
- 10.8.1 Business overview
- 10.8.2 Financial data
- 10.8.3 Product landscape
- 10.8.4 SWOT analysis
- 10.9 Powell Industries
- 10.9.1 Business overview
- 10.9.2 Financial data
- 10.9.3 Product landscape
- 10.9.4 SWOT analysis
- 10.10 Hyundai Electric & Energy Systems Co., Ltd.
- 10.10.1 Business overview
- 10.10.2 Financial data
- 10.10.3 Product landscape
- 10.10.4 SWOT analysis
- 10.11 Avail Infrastructure Solutions
- 10.11.1 Business overview
- 10.11.2 Financial data
- 10.11.3 Product landscape
- 10.11.4 SWOT analysis
- 10.12 Schneider Electric
- 10.12.1 Business overview
- 10.12.2 Financial data
- 10.12.3 Product landscape
- 10.12.4 Strategic outlook
- 10.12.5 SWOT analysis
- 10.13 Mitsubishi Electric Corporation
- 10.13.1 Business overview
- 10.13.2 Financial data
- 10.13.3 Product landscape
- 10.13.4 SWOT analysis
- 10.14 WEG
- 10.14.1 Business overview
- 10.14.2 Financial data
- 10.14.3 Product landscape
- 10.14.4 SWOT analysis
- 10.15 CG Power & Industrial Solutions Ltd.
- 10.15.1 Business overview
- 10.15.2 Financial data
- 10.15.3 Product landscape
- 10.15.4 SWOT analysis