
世界の水素市場における機会、成長要因、業界動向分析、および2026年から2035年までの予測
Global Hydrogen Market Opportunity, Growth Drivers, Industry Trend Analysis, and Forecast 2026 - 2035- 発行日
- ページ情報
- 英文 150 Pages
- 納期
- 2~3営業日
- 商品コード
- 1936657
- カスタマイズ可能 お客様のご希望に応じて、既存データの加工や未掲載情報(例:国別セグメント)の追加などの対応が可能です。詳細はお問い合わせください。
- 翻訳ツール提供対象 PDF対応AI翻訳ツールの無料貸し出しサービスのご利用が可能です
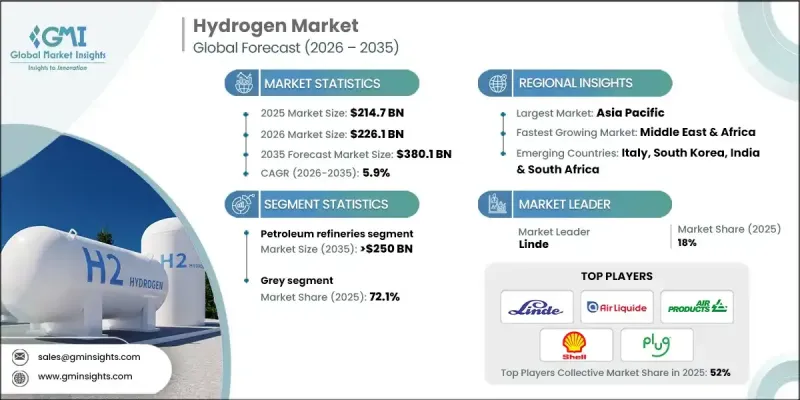
世界の水素市場は2025年に2,147億米ドルと評価され、2035年までにCAGR5.9%で成長し、3,801億米ドルに達すると予測されています。
市場拡大は、気候変動対策への取り組み、技術進歩、政策枠組みの進化を背景に、化石燃料ベースの水素製造から低炭素経路への移行が継続していることに起因しております。エネルギー集約型産業や化学製造(アンモニア・メタノール生産を含む)における水素の採用拡大が、強力な成長の勢いを生み出しております。企業は排出量を最小化するため、天然ガスと炭素回収・貯留(CCS)を組み合わせたブルー水素ソリューションへの注力を強化しています。一方、脱炭素化目標に沿ってグリーン水素の導入も加速しています。低炭素水素の生産コスト低下に加え、政府の支援策やクリーンエネルギー義務化が市場力学を強化しています。中国は世界の生産能力を支配し、電解装置設置量の約3分の2、生産量の約60%を占め、国内製造量は年間20GWを超え、世界の総需要を上回っています。
| 市場範囲 | |
|---|---|
| 開始年 | 2025年 |
| 予測年度 | 2026-2035 |
| 開始時価値 | 2,147億米ドル |
| 予測金額 | 3,801億米ドル |
| CAGR | 5.9% |
2025年には、従来型精製と原油消費への依存が続いたため、グレー水素セグメントが72.1%のシェアを占めました。しかしながら、水蒸気メタン改質法の高い炭素強度により、グリーン水素への移行が加速しています。温室効果ガス排出量の削減と持続可能性目標の達成に向けた圧力により、産業は低排出水素の代替案を模索しており、新たな成長機会が生まれています。
石油精製部門は、脱硫プロセスにおける水素の統合拡大を背景に、2035年までに2,500億米ドル規模に達すると予測されます。水素は燃料中の硫黄含有量削減に不可欠であり、精製所はネットゼロ目標に沿うためグリーン水素の採用を段階的に進めています。この継続的な変革が市場全体の成長を支えています。
北米水素市場は2025年に12.1%のシェアを占め、政府主導の取り組みやクリーンエネルギー政策に支えられています。カリフォルニア州などの地域では燃料電池車の導入とインフラ拡充を主導し、カナダは世界市場に向けた主要なクリーン水素輸出国としての地位を確立しつつあります。脱炭素化、エネルギー転換、技術革新に対する地域的な強いコミットメントが、水素の普及を促進すると見込まれます。
よくあるご質問
目次
第1章 調査手法と範囲
第2章 エグゼクティブサマリー
第3章 業界考察
- 業界のエコシステム
- 原材料の入手可能性と調達分析
- 製造能力評価
- サプライチェーンの回復力とリスク要因
- 流通ネットワーク分析
- 規制情勢
- 業界への影響要因
- 促進要因
- 業界の潜在的リスク&課題
- 成長可能性分析
- 価格動向分析
- 容量別
- 地域別
- コスト構造分析
- ポーター分析
- PESTEL分析
- 新たな機会と動向
- デジタル化とIoT統合
- 新興市場への進出
- 投資分析と将来展望
第4章 競合情勢
- イントロダクション
- 企業の市場シェア分析
- 北米
- 欧州
- アジア太平洋地域
- 中東・アフリカ
- ラテンアメリカ
- 戦略的ダッシュボード
- 戦略的取り組み
- イノベーションと技術動向
第5章 市場規模・予測:タイプ別、2023-2035
- グレー
- 青
- グリーン
第6章 市場規模・予測:用途別、2023-2035
- 石油精製所
- 化学
- その他
第7章 市場規模・予測:地域別、2023-2035
- 北米
- 米国
- カナダ
- メキシコ
- 欧州
- ドイツ
- 英国
- フランス
- イタリア
- オランダ
- ロシア
- アジア太平洋地域
- 中国
- 日本
- インド
- オーストラリア
- 中東・アフリカ
- サウジアラビア
- イラン
- アラブ首長国連邦
- 南アフリカ
- カタール
- クウェート
- ラテンアメリカ
- ブラジル
- アルゼンチン
- チリ
第8章 企業プロファイル
- Air Liquide
- Air Products &Chemicals
- Ally Hi Tech
- Ballard Power Systems
- Caloric
- Claind
- Cummins
- ENGIE
- HyGear
- Infinite Green Energy
- Iwatani Corporation
- Linde
- Mahler AGS
- Mcphy Energy
- Messer
- Nel ASA
- Nuvera Fuel Cells
- Plug Power
- Resonac Holdings Corporation
- Taiyo Nippon Sanso Corporation
- Teledyne Technologies Incorporated
- Xebec Adsorption
- 発行日
- 発行
- Global Market Insights Inc.
- ページ情報
- 英文 150 Pages
- 納期
- 2~3営業日