|
|
市場調査レポート
商品コード
1166330
電話リレーサービス(TRS)の世界市場 - サービス別、技術別、最終用途別の市場規模、地域の見通し、成長可能性、競合の市場シェア、予測(2023年~2032年)Telecommunication Relay Service Market Size By Service, By Technology, By End Use, Regional Outlook, Growth Potential, Competitive Market Share & Forecast, 2023 - 2032 |
||||||
|
|
|||||||
|
● お客様のご希望に応じて、既存データの加工や未掲載情報(例:国別セグメント)の追加などの対応が可能です。 詳細はお問い合わせください。 |
|||||||


| 電話リレーサービス(TRS)の世界市場 - サービス別、技術別、最終用途別の市場規模、地域の見通し、成長可能性、競合の市場シェア、予測(2023年~2032年) |
|
出版日: 2022年11月25日
発行: Global Market Insights Inc.
ページ情報: 英文 230 Pages
納期: 2~3営業日
|
- 全表示
- 概要
- 図表
- 目次
世界の電話リレーサービス(TRS)の市場規模は、2022年に50億米ドルを超えました。
市場は、インターネットプロトコル(IP)リレーに対する需要の増加により、2032年まで健全な成長が予測されています。
当レポートでは、世界の電話リレーサービス(TRS)市場について調査分析し、業界の考察、セグメント分析、地域分析、企業プロファイルなどを提供しています。
目次
第1章 調査手法と範囲
第2章 エグゼクティブサマリー
第3章 電話リレーサービス(TRS)業界の考察
- イントロダクション
- COVID-19発生の影響
- 北米
- 欧州
- アジア太平洋
- ラテンアメリカ
- 中東・アフリカ
- 電話リレーサービス(TRS)業界に対するロシア・ウクライナ戦争の影響
- 業界エコシステム分析
- 電話機器プロバイダー
- 通信サービスプロバイダー
- 政府当局
- サードパーティのサービスプロバイダー
- エンドユーザー
- 利益率分析
- ベンダーマトリックス
- 技術情勢
- VoIP
- ユニファイドコミュニケーション・コラボレーション
- 自動音声認識(ASR)
- 基盤技術プロバイダーの将来性
- Apple Inc.
- Google LLC
- Microsoft Corporation
- 特許分析
- 投資ポートフォリオ
- ニュース
- 北米
- 欧州
- アジア太平洋
- ラテンアメリカ
- 中東・アフリカ
- 規制情勢
- 業界に対する影響要因
- 成長促進要因
- 業界の潜在的リスク・課題
- 成長可能性分析
- ポーターのファイブフォース分析
- PESTEL分析
第4章 競合情勢(2022年)
- イントロダクション
- 企業の市場シェア(2022年)
- 主な市場企業の競合の分析(2022年)
- Bell Canada
- Cisco Systems Inc.
- Relay UK BT
- Skype Technologies S.A.R.L
- Sprint Relay (T-Mobile)
- 革新的な市場企業の競合の分析(2022年)
- Avaya Inc.
- Captel Inc.
- KCOM Group Limited
- Sorenson Communciations LLC
- 競合のポジショニングマトリックス(2022年)
- 戦略的見通しマトリックス(2022年)
第5章 電話リレーサービス(TRS)市場:サービス別
- 主な動向:サービス別
- テキストから音声
- ボイスキャリーオーバー
- 字幕電話サービス
- IP字幕電話サービス
- インターネットプロトコル中継サービス
- ビデオリレーサービス(VRS)
- その他
第6章 電話リレーサービス(TRS)市場:技術別
- 主な動向:技術別
- IPリレー
- 従来のリレー
第7章 電話リレーサービス(TRS)市場:最終用途別
- 主な動向:最終用途別
- 個人
- 政府
- 企業
第8章 電話リレーサービス(TRS)市場:地域別
- 主な動向:地域別
- 北米
- 市場の推計と予測(2018年~2032年)
- 市場の推計と予測:サービス別(2018年~2032年)
- 市場の推計と予測:技術別(2018年~2032年)
- 市場の推計と予測:最終用途別(2018年~2032年)
- 米国
- カナダ
- 欧州
- 市場の推計と予測(2018年~2032年)
- 市場の推計と予測:サービス別(2018年~2032年)
- 市場の推計と予測:技術別(2018年~2032年)
- 市場の推計と予測:最終用途別(2018年~2032年)
- 英国
- ドイツ
- フランス
- イタリア
- スペイン
- オランダ
- アジア太平洋
- 市場の推計と予測(2018年~2032年)
- 市場の推計と予測:サービス別(2018年~2032年)
- 市場の推計と予測:技術別(2018年~2032年)
- 市場の推計と予測:最終用途別(2018年~2032年)
- 中国
- インド
- 日本
- 韓国
- オーストラリア・ニュージーランド
- 東南アジア
- ラテンアメリカ
- 市場の推計と予測(2018年~2032年)
- 市場の推計と予測:サービス別(2018年~2032年)
- 市場の推計と予測:技術別(2018年~2032年)
- 市場の推計と予測:最終用途別(2018年~2032年)
- ブラジル
- メキシコ
- コロンビア
- 中東・アフリカ
- 市場の推計と予測(2018年~2032年)
- 市場の推計と予測:サービス別(2018年~2032年)
- 市場の推計と予測:技術別(2018年~2032年)
- 市場の推計と予測:最終用途別(2018年~2032年)
- 南アフリカ
- サウジアラビア
- アラブ首長国連邦
第9章 企業プロファイル
- Avaya Inc.
- Bell Canada
- Captel Inc.
- Cisco Systems Inc.
- Convo Communications LLC
- Cox Communications, Inc.
- DeafTawk
- KCOM Group Limited
- nWise AB
- Relay UK BT (BT Group PLC)
- Skype Technologies S.A.R.L (Microsoft Corporation)
- Sorenson Communications LLC
- Spectrum
- Sprint Relay (T-Mobile USA Inc.)
- T-Meeting
- ZVRS (ZP Better Together LLC)
Data Tables
- TABLE 1 Telecommunication Relay Service (TRS) market share, by region
- TABLE 2 North America market share, by region, 2022
- TABLE 3 U.S. market revenue, by Service, 2022 (USD Million)
- TABLE 4 Sources, by region
- TABLE 5 Telecommunication Relay Service (TRS) market, 2018 - 2022, (USD Million)
- TABLE 6 Telecommunication Relay Service (TRS) market, 2023 - 2032, (USD Million)
- TABLE 7 Telecommunication Relay Service (TRS) TAM, 2023 - 2032, (USD Billion)
- TABLE 8 Telecommunication Relay Service (TRS) market estimates and forecast, by region, 2018 - 2022 (USD Million)
- TABLE 9 Telecommunication Relay Service (TRS) market estimates and forecast, by region, 2023 - 2032 (USD Million)
- TABLE 10 Telecommunication Relay Service (TRS) market estimates and forecast, by service, 2018 - 2022 (USD Million)
- TABLE 11 Telecommunication Relay Service (TRS) market estimates and forecast, by service, 2023 - 2032 (USD Million)
- TABLE 12 Telecommunication Relay Service (TRS) market estimates and forecast, by technology, 2018 - 2022 (USD Million)
- TABLE 13 Telecommunication Relay Service (TRS) market estimates and forecast, by technology, 2023 - 2032 (USD Million)
- TABLE 14 Telecommunication Relay Service (TRS) market estimates and forecast, by end-use, 2018 - 2022 (USD Million)
- TABLE 15 Telecommunication Relay Service (TRS) market estimates and forecast, by end-use, 2023 - 2032 (USD Million)
- TABLE 16 Vendor matrix
- TABLE 17 Patent analysis
- TABLE 18 Industry impact forces
- TABLE 19 Company market share, 2022
- TABLE 20 Competitive benchmarking of major market players
- TABLE 21 Competitive benchmarking of innovative market players
- TABLE 22 Competitive positioning matrix: Classification criteria
- TABLE 23 Text-to-Voice market, 2018 - 2022 (USD Million)
- TABLE 24 Text-to-Voice market, 2023 - 2032 (USD Million)
- TABLE 25 Voice carry over market, 2018 - 2022 (USD Million)
- TABLE 26 Voice carry over market, 2023 - 2032 (USD Million)
- TABLE 27 Captioned telephone service market, 2018 - 2022 (USD Million)
- TABLE 28 Captioned telephone service market, 2023 - 2032 (USD Million)
- TABLE 29 IP captioned telephone market, 2018 - 2022 (USD Million)
- TABLE 30 IP captioned telephone market, 2023 - 2032 (USD Million)
- TABLE 31 Internet protocol relay service market, 2018 - 2022 (USD Million)
- TABLE 32 Internet protocol relay service market, 2023 - 2032 (USD Million)
- TABLE 33 Video Relay Service (VRS) market, 2018 - 2022 (USD Million)
- TABLE 34 Video Relay Service (VRS) market, 2023 - 2032 (USD Million)
- TABLE 35 Others market, 2018 - 2022 (USD Million)
- TABLE 36 Others market, 2023 - 2032 (USD Million)
- TABLE 37 IP relay market, 2018 - 2022 (USD Million)
- TABLE 38 IP relay market, 2023 - 2032 (USD Million)
- TABLE 39 Traditional relay market, 2018 - 2022 (USD Million)
- TABLE 40 Traditional relay market, 2023 - 2032 (USD Million)
- TABLE 41 Personal market, 2018 - 2022 (USD Million)
- TABLE 42 Personal market, 2023 - 2032 (USD Million)
- TABLE 43 Government market, 2018 - 2022 (USD Million)
- TABLE 44 Government market, 2023 - 2032 (USD Million)
- TABLE 45 Enterprise market, 2018 - 2022 (USD Million)
- TABLE 46 Enterprise market, 2023 - 2032 (USD Million)
- TABLE 47 North America Telecommunication Relay Service (TRS) market, 2018 - 2022 (USD Million)
- TABLE 48 North America Telecommunication Relay Service (TRS) market, 2023 - 2032 (USD Million)
- TABLE 49 North America Telecommunication Relay Service (TRS) market, by service, 2018 - 2022 (USD Million)
- TABLE 50 North America Telecommunication Relay Service (TRS) market, by service, 2023 - 2032 (USD Million)
- TABLE 51 North America Telecommunication Relay Service (TRS) market, by technology, 2018 - 2022 (USD Million)
- TABLE 52 North America Telecommunication Relay Service (TRS) market, by technology, 2023 - 2032 (USD Million)
- TABLE 53 North America Telecommunication Relay Service (TRS) market, by end-use, 2018 - 2022 (USD Million)
- TABLE 54 North America Telecommunication Relay Service (TRS) market, by end-use, 2023 - 2032 (USD Million)
- TABLE 55 U.S. Telecommunication Relay Service market, 2018 - 2022 (USD Million)
- TABLE 56 U.S. Telecommunication Relay Service (TRS) market, 2023 - 2032 (USD Million)
- TABLE 57 U.S. Telecommunication Relay Service (TRS) market, by service, 2018 - 2022 (USD Million)
- TABLE 58 U.S. Telecommunication Relay Service (TRS) market, by service, 2023 - 2032 (USD Million)
- TABLE 59 U.S. Telecommunication Relay Service (TRS) market, by technology, 2018 - 2022 (USD Million)
- TABLE 60 U.S. Telecommunication Relay Service (TRS) market, by technology, 2023 - 2032 (USD Million)
- TABLE 61 U.S. Telecommunication Relay Service (TRS) market, by end-use, 2018 - 2022 (USD Million)
- TABLE 62 U.S. Telecommunication Relay Service (TRS) market, by end-use, 2023 - 2032 (USD Million)
- TABLE 63 Canada Telecommunication Relay Service (TRS) market, 2018 - 2022 (USD Million)
- TABLE 64 Canada Telecommunication Relay Service (TRS) market, 2023 - 2032 (USD Million)
- TABLE 65 Canada Telecommunication Relay Service (TRS) market, by service, 2018 - 2022 (USD Million)
- TABLE 66 Canada Telecommunication Relay Service (TRS) market, by service, 2023 - 2032 (USD Million)
- TABLE 67 Canada Telecommunication Relay Service (TRS) market, by technology, 2018 - 2022 (USD Million)
- TABLE 68 Canada Telecommunication Relay Service (TRS) market, by technology, 2023 - 2032 (USD Million)
- TABLE 69 Canada Telecommunication Relay Service (TRS) market, by end-use, 2018 - 2022 (USD Million)
- TABLE 70 Canada Telecommunication Relay Service (TRS) market, by end-use, 2023 - 2032 (USD Million)
- TABLE 71 Europe Telecommunication Relay Service (TRS) market, 2018 - 2022 (USD Million)
- TABLE 72 Europe Telecommunication Relay Service (TRS) market, 2023 - 2032 (USD Million)
- TABLE 73 Europe Telecommunication Relay Service (TRS) market, by service, 2018 - 2022 (USD Million)
- TABLE 74 Europe Telecommunication Relay Service (TRS) market, by service, 2023 - 2032 (USD Million)
- TABLE 75 Europe Telecommunication Relay Service (TRS) market, by technology, 2018 - 2022 (USD Million)
- TABLE 76 Europe Telecommunication Relay Service (TRS) market, by technology, 2023 - 2032 (USD Million)
- TABLE 77 Europe Telecommunication Relay Service (TRS) market, by end-use, 2018 - 2022 (USD Million)
- TABLE 78 Europe Telecommunication Relay Service (TRS) market, by end-use, 2023 - 2032 (USD Million)
- TABLE 79 UK Telecommunication Relay Service (TRS) market, 2018 - 2022 (USD Million)
- TABLE 80 UK Telecommunication Relay Service (TRS) market, 2023 - 2032 (USD Million)
- TABLE 81 UK Telecommunication Relay Service (TRS) market, by service, 2018 - 2022 (USD Million)
- TABLE 82 UK Telecommunication Relay Service (TRS) market, by service, 2023 - 2032 (USD Million)
- TABLE 83 UK Telecommunication Relay Service (TRS) market, by technology, 2018 - 2022 (USD Million)
- TABLE 84 UK Telecommunication Relay Service (TRS) market, by technology, 2023 - 2032 (USD Million)
- TABLE 85 UK Telecommunication Relay Service (TRS) market, by end-use, 2018 - 2022 (USD Million)
- TABLE 86 UK Telecommunication Relay Service (TRS) market, by end-use, 2023 - 2032 (USD Million)
- TABLE 87 Germany Telecommunication Relay Service (TRS) market, 2018 - 2022 (USD Million)
- TABLE 88 Germany Telecommunication Relay Service (TRS) market, 2023 - 2032 (USD Million)
- TABLE 89 Germany Telecommunication Relay Service (TRS) market, by Service, 2018 - 2022 (USD Million)
- TABLE 90 Germany Telecommunication Relay Service (TRS) market, by Service, 2023 - 2032 (USD Million)
- TABLE 91 Germany Telecommunication Relay Service (TRS) market, by Technology, 2018 - 2022 (USD Million)
- TABLE 92 Germany Telecommunication Relay Service (TRS) market, by Technology, 2023 - 2032 (USD Million)
- TABLE 93 Germany Telecommunication Relay Service (TRS) market, by End-use, 2018 - 2022 (USD Million)
- TABLE 94 Germany Telecommunication Relay Service (TRS) market, by End-use, 2023 - 2032 (USD Million)
- TABLE 95 France Telecommunication Relay Service (TRS) market, 2018 - 2022 (USD Million)
- TABLE 96 France Telecommunication Relay Service (TRS) market, 2023 - 2032 (USD Million)
- TABLE 97 France Telecommunication Relay Service (TRS) market, by Service, 2018 - 2022 (USD Million)
- TABLE 98 France Telecommunication Relay Service (TRS) market, by Service, 2023 - 2032 (USD Million)
- TABLE 99 France Telecommunication Relay Service (TRS) market, by Technology, 2018 - 2022 (USD Million)
- TABLE 100 France Telecommunication Relay Service (TRS) market, by Technology, 2023 - 2032 (USD Million)
- TABLE 101 France Telecommunication Relay Service (TRS) market, by End-use, 2018 - 2022 (USD Million)
- TABLE 102 France Telecommunication Relay Service (TRS) market, by End-use, 2023 - 2032 (USD Million)
- TABLE 103 Italy Telecommunication Relay Service (TRS) market, 2018 - 2022 (USD Million)
- TABLE 104 Italy Telecommunication Relay Service (TRS) market, 2023 - 2032 (USD Million)
- TABLE 105 Italy Telecommunication Relay Service (TRS) market, by Service, 2018 - 2022 (USD Million)
- TABLE 106 Italy Telecommunication Relay Service (TRS) market, by Service, 2023 - 2032 (USD Million)
- TABLE 107 Italy Telecommunication Relay Service (TRS) market, by Technology, 2018 - 2022 (USD Million)
- TABLE 108 Italy Telecommunication Relay Service (TRS) market, by Technology, 2023 - 2032 (USD Million)
- TABLE 109 Italy Telecommunication Relay Service (TRS) market, by End-use, 2018 - 2022 (USD Million)
- TABLE 110 Italy Telecommunication Relay Service (TRS) market, by End-use, 2023 - 2032 (USD Million)
- TABLE 111 Spain Telecommunication Relay Service (TRS) market, 2018 - 2022 (USD Million)
- TABLE 112 Spain Telecommunication Relay Service (TRS) market, 2023 - 2032 (USD Million)
- TABLE 113 Spain Telecommunication Relay Service (TRS) market, by Service, 2018 - 2022 (USD Million)
- TABLE 114 Spain Telecommunication Relay Service (TRS) market, by Service, 2023 - 2032 (USD Million)
- TABLE 115 Spain Telecommunication Relay Service (TRS) market, by Technology, 2018 - 2022 (USD Million)
- TABLE 116 Spain Telecommunication Relay Service (TRS) market, by Technology, 2023 - 2032 (USD Million)
- TABLE 117 Spain Telecommunication Relay Service (TRS) market, by End-use, 2018 - 2022 (USD Million)
- TABLE 118 Spain Telecommunication Relay Service (TRS) market, by End-use, 2023 - 2032 (USD Million)
- TABLE 119 Netherland Telecommunication Relay Service (TRS) market, 2018 - 2022 (USD Million)
- TABLE 120 Netherland Telecommunication Relay Service (TRS) market, 2023 - 2032 (USD Million)
- TABLE 121 Netherland Telecommunication Relay Service (TRS) market, by Service, 2018 - 2022 (USD Million)
- TABLE 122 Netherland Telecommunication Relay Service (TRS) market, by Service, 2023 - 2032 (USD Million)
- TABLE 123 Netherland Telecommunication Relay Service (TRS) market, by Technology, 2018 - 2022 (USD Million)
- TABLE 124 Netherland Telecommunication Relay Service (TRS) market, by Technology, 2023 - 2032 (USD Million)
- TABLE 125 Netherland Telecommunication Relay Service (TRS) market, by End-use, 2018 - 2022 (USD Million)
- TABLE 126 Netherland Telecommunication Relay Service (TRS) market, by End-use, 2023 - 2032 (USD Million)
- TABLE 127 Asia Pacific Telecommunication Relay Service (TRS) market, 2018 - 2022 (USD Million)
- TABLE 128 Asia Pacific Telecommunication Relay Service (TRS) market, 2023 - 2032 (USD Million)
- TABLE 129 Asia Pacific Telecommunication Relay Service (TRS) market, by Service, 2018 - 2022 (USD Million)
- TABLE 130 Asia Pacific Telecommunication Relay Service (TRS) market, by Service, 2023 - 2032 (USD Million)
- TABLE 131 Asia Pacific Telecommunication Relay Service (TRS) market, by Technology, 2018 - 2022 (USD Million)
- TABLE 132 Asia Pacific Telecommunication Relay Service (TRS) market, by Technology, 2023 - 2032 (USD Million)
- TABLE 133 Asia Pacific Telecommunication Relay Service (TRS) market, by End-use, 2018 - 2022 (USD Million)
- TABLE 134 Asia Pacific Telecommunication Relay Service (TRS) market, by End-use, 2023 - 2032 (USD Million)
- TABLE 135 China Telecommunication Relay Service (TRS) market, 2018 - 2022 (USD Million)
- TABLE 136 China Telecommunication Relay Service (TRS) market, 2023 - 2032 (USD Million)
- TABLE 137 China Telecommunication Relay Service (TRS) market, by Service, 2018 - 2022 (USD Million)
- TABLE 138 China Telecommunication Relay Service (TRS) market, by Service, 2023 - 2032 (USD Million)
- TABLE 139 China Telecommunication Relay Service (TRS) market, by Technology, 2018 - 2022 (USD Million)
- TABLE 140 China Telecommunication Relay Service (TRS) market, by Technology, 2023 - 2032 (USD Million)
- TABLE 141 China Telecommunication Relay Service (TRS) market, by End-use, 2018 - 2022 (USD Million)
- TABLE 142 China Telecommunication Relay Service (TRS) market, by End-use, 2023 - 2032 (USD Million)
- TABLE 143 Japan Telecommunication Relay Service (TRS) market, 2018 - 2022 (USD Million)
- TABLE 144 Japan Telecommunication Relay Service (TRS) market, 2023 - 2032 (USD Million)
- TABLE 145 Japan Telecommunication Relay Service (TRS) market, by Service, 2018 - 2022 (USD Million)
- TABLE 146 Japan Telecommunication Relay Service (TRS) market, by Service, 2023 - 2032 (USD Million)
- TABLE 147 Japan Telecommunication Relay Service (TRS) market, by Technology, 2018 - 2022 (USD Million)
- TABLE 148 Japan Telecommunication Relay Service (TRS) market, by Technology, 2023 - 2032 (USD Million)
- TABLE 149 Japan Telecommunication Relay Service (TRS) market, by End-use, 2018 - 2022 (USD Million)
- TABLE 150 Japan Telecommunication Relay Service (TRS) market, by End-use, 2023 - 2032 (USD Million)
- TABLE 151 India Telecommunication Relay Service (TRS) market, 2018 - 2022 (USD Million)
- TABLE 152 India Telecommunication Relay Service (TRS) market, 2023 - 2032 (USD Million)
- TABLE 153 India Telecommunication Relay Service (TRS) market, by Service, 2018 - 2022 (USD Million)
- TABLE 154 India Telecommunication Relay Service (TRS) market, by Service, 2023 - 2032 (USD Million)
- TABLE 155 India Telecommunication Relay Service (TRS) market, by Technology, 2018 - 2022 (USD Million)
- TABLE 156 India Telecommunication Relay Service (TRS) market, by Technology, 2023 - 2032 (USD Million)
- TABLE 157 India Telecommunication Relay Service (TRS) market, by End-use, 2018 - 2022 (USD Million)
- TABLE 158 India Telecommunication Relay Service (TRS) market, by End-use, 2023 - 2032 (USD Million)
- TABLE 159 South Korea Telecommunication Relay Service (TRS) market, 2018 - 2022 (USD Million)
- TABLE 160 South Korea Telecommunication Relay Service (TRS) market, 2023 - 2032 (USD Million)
- TABLE 161 South Korea Telecommunication Relay Service (TRS) market, by Service, 2018 - 2022 (USD Million)
- TABLE 162 South Korea Telecommunication Relay Service (TRS) market, by Service, 2023 - 2032 (USD Million)
- TABLE 163 South Korea Telecommunication Relay Service (TRS) market, by Technology, 2018 - 2022 (USD Million)
- TABLE 164 South Korea Telecommunication Relay Service (TRS) market, by Technology, 2023 - 2032 (USD Million)
- TABLE 165 South Korea Telecommunication Relay Service (TRS) market, by End-use, 2018 - 2022 (USD Million)
- TABLE 166 South Korea Telecommunication Relay Service (TRS) market, by End-use, 2023 - 2032 (USD Million)
- TABLE 167 Australia and New Zealand Telecommunication Relay Service (TRS) market, 2018 - 2022 (USD Million)
- TABLE 168 Australia and New Zealand Telecommunication Relay Service (TRS) market, 2023 - 2032 (USD Million)
- TABLE 169 Australia and New Zealand Telecommunication Relay Service (TRS) market, by Service, 2018 - 2022 (USD Million)
- TABLE 170 Australia and New Zealand Telecommunication Relay Service (TRS) market, by service, 2023 - 2032 (USD Million)
- TABLE 171 Australia and New Zealand Telecommunication Relay Service (TRS) market, by Technology, 2018 - 2022 (USD Million)
- TABLE 172 Australia and New Zealand Telecommunication Relay Service (TRS) market, by Technology, 2023 - 2032 (USD Million)
- TABLE 173 Australia and New Zealand Telecommunication Relay Service (TRS) market, by End-use, 2018 - 2022 (USD Million)
- TABLE 174 Australia and New Zealand Telecommunication Relay Service (TRS) market, by End-use, 2023 - 2032 (USD Million)
- TABLE 175 Southeast Asia Telecommunication Relay Service (TRS) market, 2018 - 2022 (USD Million)
- TABLE 176 Southeast Asia Telecommunication Relay Service (TRS) market, 2023 - 2032 (USD Million)
- TABLE 177 Southeast Asia Telecommunication Relay Service (TRS) market, by Service, 2018 - 2022 (USD Million)
- TABLE 178 Southeast Asia Telecommunication Relay Service (TRS) market, by Service, 2023 - 2032 (USD Million)
- TABLE 179 Southeast Asia Telecommunication Relay Service (TRS) market, by Technology, 2018 - 2022 (USD Million)
- TABLE 180 Southeast Asia Telecommunication Relay Service (TRS) market, by Technology, 2023 - 2032 (USD Million)
- TABLE 181 Southeast Asia Telecommunication Relay Service (TRS) market, by End-use, 2018 - 2022 (USD Million)
- TABLE 182 Southeast Asia Telecommunication Relay Service (TRS) market, by End-use, 2023 - 2032 (USD Million)
- TABLE 183 Latin America Telecommunication Relay Service (TRS) market, 2018 - 2022 (USD Million)
- TABLE 184 Latin America Telecommunication Relay Service (TRS) market, 2023 - 2032 (USD Million)
- TABLE 185 Latin America Telecommunication Relay Service (TRS) market, by Service, 2018 - 2022 (USD Million)
- TABLE 186 Latin America Telecommunication Relay Service (TRS) market, by Service, 2023 - 2032 (USD Million)
- TABLE 187 Latin America Telecommunication Relay Service (TRS) market, by Technology, 2018 - 2022 (USD Million)
- TABLE 188 Latin America Telecommunication Relay Service (TRS) market, by Technology, 2023 - 2032 (USD Million)
- TABLE 189 Latin America Telecommunication Relay Service (TRS) market, by End-use, 2018 - 2022 (USD Million)
- TABLE 190 Latin America Telecommunication Relay Service (TRS) market, by End-use, 2023 - 2032 (USD Million)
- TABLE 191 Brazil Telecommunication Relay Service (TRS) market, 2018 - 2022 (USD Million)
- TABLE 192 Brazil Telecommunication Relay Service (TRS) market, 2023 - 2032 (USD Million)
- TABLE 193 Brazil Telecommunication Relay Service (TRS) market, by Service, 2018 - 2022 (USD Million)
- TABLE 194 Brazil Telecommunication Relay Service (TRS) market, by Service, 2023 - 2032 (USD Million)
- TABLE 195 Brazil Telecommunication Relay Service (TRS) market, by Technology, 2018 - 2022 (USD Million)
- TABLE 196 Brazil Telecommunication Relay Service (TRS) market, by Technology, 2023 - 2032 (USD Million)
- TABLE 197 Brazil Telecommunication Relay Service (TRS) market, by End-use, 2018 - 2022 (USD Million)
- TABLE 198 Brazil Telecommunication Relay Service (TRS) market, by End-use, 2023 - 2032 (USD Million)
- TABLE 199 Mexico Telecommunication Relay Service (TRS) market, 2018 - 2022 (USD Million)
- TABLE 200 Mexico Telecommunication Relay Service (TRS) market, 2023 - 2032 (USD Million)
- TABLE 201 Mexico Telecommunication Relay Service (TRS) market, by Service, 2018 - 2022 (USD Million)
- TABLE 202 Mexico Telecommunication Relay Service (TRS) market, by Service, 2023 - 2032 (USD Million)
- TABLE 203 Mexico Telecommunication Relay Service (TRS) market, by Technology, 2018 - 2022 (USD Million)
- TABLE 204 Mexico Telecommunication Relay Service (TRS) market, by Technology, 2023 - 2032 (USD Million)
- TABLE 205 Mexico Telecommunication Relay Service (TRS) market, by End-use, 2018 - 2022 (USD Million)
- TABLE 206 Mexico Telecommunication Relay Service (TRS) market, by End-use, 2023 - 2032 (USD Million)
- TABLE 207 Colombia Telecommunication Relay Service (TRS) market, 2018 - 2022 (USD Million)
- TABLE 208 Colombia Telecommunication Relay Service (TRS) market, 2023 - 2032 (USD Million)
- TABLE 209 Colombia Telecommunication Relay Service (TRS) market, by Service, 2018 - 2022 (USD Million)
- TABLE 210 Colombia Telecommunication Relay Service (TRS) market, by Service, 2023 - 2032 (USD Million)
- TABLE 211 Colombia Telecommunication Relay Service (TRS) market, by Technology, 2018 - 2022 (USD Million)
- TABLE 212 Colombia Telecommunication Relay Service (TRS) market, by Technology, 2023 - 2032 (USD Million)
- TABLE 213 Colombia Telecommunication Relay Service (TRS) market, by End-use, 2018 - 2022 (USD Million)
- TABLE 214 Colombia Telecommunication Relay Service (TRS) market, by End-use, 2023 - 2032 (USD Million)
- TABLE 215 Middle East Telecommunication Relay Service (TRS) market, 2018 - 2022 (USD Million)
- TABLE 216 Middle East Telecommunication Relay Service (TRS) market, 2023 - 2032 (USD Million)
- TABLE 217 Middle East Telecommunication Relay Service (TRS) market, by Service, 2018 - 2022 (USD Million)
- TABLE 218 Middle East Telecommunication Relay Service (TRS) market, by Service, 2023 - 2032 (USD Million)
- TABLE 219 Middle East Telecommunication Relay Service (TRS) market, by Technology, 2018 - 2022 (USD Million)
- TABLE 220 Middle East Telecommunication Relay Service (TRS) market, by Technology, 2023 - 2032 (USD Million)
- TABLE 221 Middle East Telecommunication Relay Service (TRS) market, by End-use, 2018 - 2022 (USD Million)
- TABLE 222 Middle East Telecommunication Relay Service (TRS) market, by End-use, 2023 - 2032 (USD Million)
- TABLE 223 South Africa Telecommunication Relay Service (TRS) market, 2018 - 2022 (USD Million)
- TABLE 224 South Africa Telecommunication Relay Service (TRS) market, 2023 - 2032 (USD Million)
- TABLE 225 South Africa Telecommunication Relay Service (TRS) market, by Service, 2018 - 2022 (USD Million)
- TABLE 226 South Africa Telecommunication Relay Service (TRS) market, by Service, 2023 - 2032 (USD Million)
- TABLE 227 South Africa Telecommunication Relay Service (TRS) market, by Technology, 2018 - 2022 (USD Million)
- TABLE 228 South Africa Telecommunication Relay Service (TRS) market, by Technology, 2023 - 2032 (USD Million)
- TABLE 229 South Africa Telecommunication Relay Service (TRS) market, by End-use, 2018 - 2022 (USD Million)
- TABLE 230 South Africa Telecommunication Relay Service (TRS) market, by End-use, 2023 - 2032 (USD Million)
- TABLE 231 Saudi Arabia Telecommunication Relay Service (TRS) market, 2018 - 2022 (USD Million)
- TABLE 232 Saudi Arabia Telecommunication Relay Service (TRS) market, 2023 - 2032 (USD Million)
- TABLE 233 Saudi Arabia Telecommunication Relay Service (TRS) market, by Service, 2018 - 2022 (USD Million)
- TABLE 234 Saudi Arabia Telecommunication Relay Service (TRS) market, by Service, 2023 - 2032 (USD Million)
- TABLE 235 Saudi Arabia Telecommunication Relay Service (TRS) market, by Technology, 2018 - 2022 (USD Million)
- TABLE 236 Saudi Arabia Telecommunication Relay Service (TRS) market, by Technology, 2023 - 2032 (USD Million)
- TABLE 237 Saudi Arabia Telecommunication Relay Service (TRS) market, by End-use, 2018 - 2022 (USD Million)
- TABLE 238 Saudi Arabia Telecommunication Relay Service (TRS) market, by End-use, 2023 - 2032 (USD Million)
- TABLE 239 UAE Telecommunication Relay Service (TRS) market, 2018 - 2022 (USD Million)
- TABLE 240 UAE Telecommunication Relay Service (TRS) market, 2023 - 2032 (USD Million)
- TABLE 241 UAE Telecommunication Relay Service (TRS) market, by Service, 2018 - 2022 (USD Million)
- TABLE 242 UAE Telecommunication Relay Service (TRS) market, by Service, 2023 - 2032 (USD Million)
- TABLE 243 UAE Telecommunication Relay Service (TRS) market, by Technology, 2018 - 2022 (USD Million)
- TABLE 244 UAE Telecommunication Relay Service (TRS) market, by Technology, 2023 - 2032 (USD Million)
- TABLE 245 UAE Telecommunication Relay Service (TRS) market, by End-use, 2018 - 2022 (USD Million)
- TABLE 246 UAE Telecommunication Relay Service (TRS) market, by End-use, 2023 - 2032 (USD Million)
Charts & Figures
- FIG 1 GMI's report coverage in the global Telecommunication Relay Service (TRS) market
- FIG 2 Industry segmentation
- FIG 3 Profile break-up of primary respondents
- FIG 4 Forecast calculation
- FIG 5 Telecommunication Relay Service (TRS) industry 36 degree synopsis, 2018 - 2032
- FIG 6 Telecommunication Relay Service (TRS) ecosystem analysis
- FIG 7 Growth potential analysis
- FIG 8 Porter's analysis
- FIG 9 PESTEL analysis
- FIG 10 Company market share, 2022
- FIG 11 Competitive analysis of major market players, 2022
- FIG 12 Competitive analysis of innovative market players, 2022
- FIG 13 Competitive positioning matrix
- FIG 14 Strategic outlook matrix
- FIG 15 Key trends, by service
- FIG 16 Key trends, by technology
- FIG 17 Key trends, by end-use
- FIG 18 Key trends, by region
- FIG 19 SWOT Analysis, Avaya Inc.
- FIG 20 SWOT Analysis, Bell Canada
- FIG 21 SWOT Analysis. Captel Inc.
- FIG 22 SWOT Analysis, Cisco Systems Inc.
- FIG 23 SWOT Analysis, Convo Communications LLC
- FIG 24 SWOT Analysis, Cox Communications, Inc
- FIG 25 SWOT Analysis, DeafTawk
- FIG 26 SWOT Analysis, KCOM Group Limited
- FIG 27 SWOT Analysis, nWise AB
- FIG 28 SWOT Analysis, Relay UK BT (BT Group PLC)
- FIG 29 SWOT Analysis, Skype Technologies S.A.R.L (Microsoft Corporation)
- FIG 30 SWOT Analysis, Sorenson Communications LLC
- FIG 31 SWOT Analysis, Spectrum
- FIG 32 SWOT Analysis, Sprint Relay (T-Mobile USA Inc.)
- FIG 33 SWOT Analysis T-Meeting
- FIG 34 SWOT Analysis, ZVRS (ZP Better Together LLC)
Telecommunication relay service market (TRS) is expected to grow at a robust rate through 2032 owing to the increasing demand for Internet Protocol (IP) relays. In 2022, telecommunication relay services were valued at more than USD 5 billion.
IP relay has certain advantages such as Voice Carry-Over (VCO) and Hearing Carry-Over (HCO) options, which are extremely useful for people with disabilities and for those who are hard of hearing. It allows disabled people to communicate with those who use any standard telephone via CA (Communications Assistant).
Overall, the telecommunication relay service market (TRS) is segmented based on service, technology, end-use, and region.
Based on service, the market is divided into Voice carry over, IP captioned telephone service, video relay service (VRS), Internet Protocol relay service, Captioned telephone service, Text-to-voice, and others. Among these, the video relay service segment is becoming increasingly popular among users since it allows free-flow and natural communication. Besides, there is an absence of text input that ensures that users can flawlessly convey messages to the CA using sign language, which is more natural and faster than typing.
In terms of technology, the telecommunication relay service market (TRS) is divided into IP relay and Traditional relay. The traditional relay technology segment in the telecommunication relay service market is expected to witness steady growth between 2023 and 2032. This can be attributed to the increasing demand for communication services from those individuals who use TTYs.
On the basis of end-use, the market has been fragmented into enterprise, personal, and government. Among these, the enterprise segment held over 10% market share in 2022 and is anticipated to grow during the analysis timeframe due to increasing demand for unified communication across the enterprises. Besides, there is an escalating tendency of remote working and the expansion of business on a global level will also fuel the market growth through 2032.
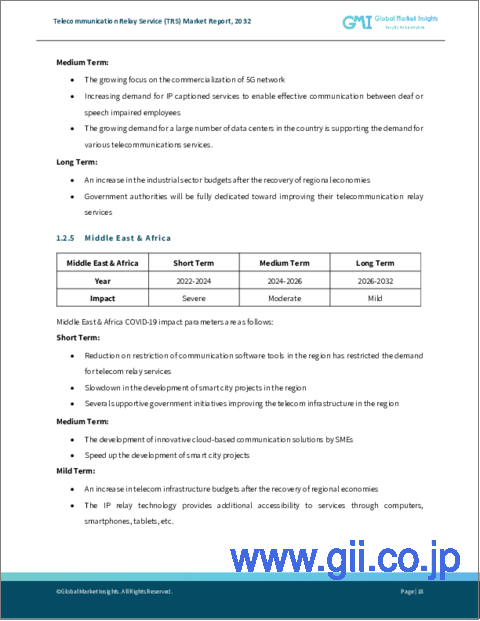
Considering the regional landscape, the Telecommunication Relay Service Market (TRS) is divided into North America, Asia Pacific, MEA, Latin America, and Europe. Among them, the TRS market in the Asia Pacific region is expected to grow at 10% CAGR during the forecast period. Presence of range of government initiatives focused on improving the accessibility of telecommunication services will further drive market growth.
Some of the well-established enterprises that operate in the Telecommunication Relay Service Market (TRS) are Cisco Systems Inc., Bell Canada, and Sprint Relay (T-Mobile USA Inc.). These companies are focusing on strengthening their market position through collaboration with regulatory bodies.
Table of Contents
Chapter 1 Methodology & Scope
- 1.1 Market definitions
- 1.2 Base estmates & calculations
- 1.3 Forecast calculation
- 1.4 Data Sources
- 1.4.1 Primary
- 1.4.2 Secondary
- 1.4.2.1 Paid sources
- 1.4.2.2 Public sources
Chapter 2 Executive Summary
- 2.1 Telecommunication Relay Service (TRS) industry 360 degree synopsis, 2018 - 2032
- 2.2 Business trends
- 2.2.1 Total Addressable Market (TAM)
- 2.3 Regional trends
- 2.4 Service trends
- 2.5 Technology trends
- 2.6 End-use trends
Chapter 3 Telecommunication Relay Service (TRS) Industry Insights
- 3.1 Introduction
- 3.2 Impact of COVID-19 outbreak
- 3.2.1 North America
- 3.2.2 Europe
- 3.2.3 Asia Pacific
- 3.2.4 Latin America
- 3.2.5 MEA
- 3.3 Russia- Ukraine war impact on Telecommunication Relay Service (TRS) industry
- 3.4 Industry ecosystem analysis
- 3.4.1 Telephone equipement providers
- 3.4.2 Telecom servcie providers
- 3.4.3 Government authorities
- 3.4.4 Third party service providers
- 3.4.5 End-users
- 3.4.6 Profit margin analysis
- 3.4.7 Vendor matrix
- 3.5 Technology landscape
- 3.5.1 VoIP
- 3.5.2 Unified communication and collaboration
- 3.5.3 Automatics Speech Recognition (ASR)
- 3.6 Future potential of underlying technology providers
- 3.6.1 Apple Inc.
- 3.6.2 Google LLC
- 3.6.3 Microsoft Corporation
- 3.7 Patent analysis
- 3.8 Investment portfolio
- 3.9 News
- 3.9.1 North America
- 3.9.2 Europe
- 3.9.3 Asia Pacific
- 3.9.4 Latin America
- 3.9.5 MEA
- 3.10 Regulatory landscape
- 3.11 Industry impact forces
- 3.11.1 Growth drivers
- 3.11.1.1 A rapid adoption of mobile devices
- 3.11.1.2 Rising demand for unified communications
- 3.11.1.3 Growing penetration of VoIP devices
- 3.11.1.4 Favorable government initiatives to facilitate telecommunication relay services
- 3.11.2 Industry pitfalls & challenges
- 3.11.2.1 Limited in-house capabilities
- 3.11.2.2 Concerns regarding frauds and cybersecurity
- 3.11.1 Growth drivers
- 3.12 Growth potential analysis
- 3.13 Porter's analysis
- 3.14 PESTEL analysis
Chapter 4 Competitive Landscape, 2022
- 4.1 Introduction
- 4.2 Company market share, 2022
- 4.3 Competive analysis of major market players, 2022
- 4.3.1 Bell Canada
- 4.3.2 Cisco Systems Inc.
- 4.3.3 Relay UK BT
- 4.3.4 Skype Technologies S.A.R.L
- 4.3.5 Sprint Relay (T-Mobile)
- 4.4 Competive analysis of innovative market playes, 2022
- 4.4.1 Avaya Inc.
- 4.4.2 Captel Inc.
- 4.4.3 KCOM Group Limited
- 4.4.4 Sorenson Communciations LLC
- 4.5 Compeyitive positiong matrix, 2022
- 4.6 Strategic outlook matrix, 2022
Chapter 5 Telecommunication Relay Service (TRS) Market, By Service
- 5.1 Key trends, by Service
- 5.2 Text-to-voice
- 5.2.1 Market estimates and forecast, 2018 - 2032
- 5.3 Voice carry over
- 5.3.1 Market estimates and forecast, 2018 - 2032
- 5.4 Captioned telephone service
- 5.4.1 Market estimates and forecast, 2018 - 2032
- 5.5 IP captioned telephone service
- 5.5.1 Market estimates and forecast, 2018 - 2032
- 5.6 Internet protocol relay service
- 5.6.1 Market estimates and forecast, 2018 - 2032
- 5.7 Video Realy Service (VRS)
- 5.7.1 Market estimates and forecast, 2018 - 2032
- 5.8 Others
- 5.8.1 Market estimates and forecast, 2018 - 2032
Chapter 6 Telecommunication Relay Service (TRS) Market, By Technology
- 6.1 Key trends, by Technology
- 6.2 IP relay
- 6.2.1 Market estimates and forecast, 2018 - 2032
- 6.3 Traditional relay
- 6.3.1 Market estimates and forecast, 2018 - 2032
Chapter 7 Telecommunication Relay Service (TRS) Market, By End-use
- 7.1 Key trends, by End-use
- 7.2 Personal
- 7.2.1 Market estimates and forecast, 2018 - 2032
- 7.3 Governmet
- 7.3.1 Market estimates and forecast, 2018 - 2032
- 7.4 Enterprise
- 7.4.1 Market estimates and forecast, 2018 - 2032
Chapter 8 Telecommunication Relay Service (TRS) Market, By Region
- 8.1 Key trends, by region
- 8.2 North America
- 8.2.1 Market estimates and forecast, 2018 - 2032
- 8.2.2 Market estimates and forecast, by Service, 2018 - 2032
- 8.2.3 Market estimates and forecast, by Technology, 2018 - 2032
- 8.2.4 Market estimates and forecast, by End-use, 2018 - 2032
- 8.2.5 U.S.
- 8.2.5.1 Market estimates and forecast, 2018 - 2032
- 8.2.5.2 Market estimates and forecast, by service, 2018 - 2032
- 8.2.5.3 Market estimates and forecast, by technology, 2018 - 2032
- 8.2.5.4 Market estimates and forecast, by end-use, 2018 - 2032
- 8.2.6 Canada
- 8.2.6.1 Market estimates and forecast, 2018 - 2032
- 8.2.6.2 Market estimates and forecast, by service, 2018 - 2032
- 8.2.6.3 Market estimates and forecast, by technology, 2018 - 2032
- 8.2.6.4 Market estimates and forecast, by end-use, 2018 - 2032
- 8.3 Europe
- 8.3.1 Market estimates and forecast, 2018 - 2032
- 8.3.2 Market estimates and forecast, by service, 2018 - 2032
- 8.3.3 Market estimates and forecast, by technology, 2018 - 2032
- 8.3.4 Market estimates and forecast, by end-use, 2018 - 2032
- 8.3.5 UK
- 8.3.5.1 Market estimates and forecast, 2018 - 2032
- 8.3.5.2 Market estimates and forecast, by service, 2018 - 2032
- 8.3.5.3 Market estimates and forecast, by technology, 2018 - 2032
- 8.3.5.4 Market estimates and forecast, by end-use, 2018 - 2032
- 8.3.6 Germany
- 8.3.6.1 Market estimates and forecast, 2018 - 2032
- 8.3.6.2 Market estimates and forecast, by service, 2018 - 2032
- 8.3.6.3 Market estimates and forecast, by technology, 2018 - 2032
- 8.3.6.4 Market estimates and forecast, by end-use, 2018 - 2032
- 8.3.7 France
- 8.3.7.1 Market estimates and forecast, 2018 - 2032
- 8.3.7.2 Market estimates and forecast, by Service, 2018 - 2032
- 8.3.7.3 Market estimates and forecast, by Technology, 2018 - 2032
- 8.3.7.4 Market estimates and forecast, by End-use, 2018 - 2032
- 8.3.8 Italy
- 8.3.8.1 Market estimates and forecast, 2018 - 2032
- 8.3.8.2 Market estimates and forecast, by service, 2018 - 2032
- 8.3.8.3 Market estimates and forecast, by technology, 2018 - 2032
- 8.3.8.4 Market estimates and forecast, by end-use, 2018 - 2032
- 8.3.9 Spain
- 8.3.9.1 Market estimates and forecast, 2018 - 2032
- 8.3.9.2 Market estimates and forecast, by service, 2018 - 2032
- 8.3.9.3 Market estimates and forecast, by technology, 2018 - 2032
- 8.3.9.4 Market estimates and forecast, by end-use, 2018 - 2032
- 8.3.10 Netherland
- 8.3.10.1 Market estimates and forecast, 2018 - 2032
- 8.3.10.2 Market estimates and forecast, by service, 2018 - 2032
- 8.3.10.3 Market estimates and forecast, by technology, 2018 - 2032
- 8.3.10.4 Market estimates and forecast, by end-use, 2018 - 2032
- 8.4 Asia Pacific
- 8.4.1 Market estimates and forecast, 2018 - 2032
- 8.4.2 Market estimates and forecast, by service, 2018 - 2032
- 8.4.3 Market estimates and forecast, by technology, 2018 - 2032
- 8.4.4 Market estimates and forecast, by end-use, 2018 - 2032
- 8.4.5 China
- 8.4.5.1 Market estimates and forecast, 2018 - 2032
- 8.4.5.2 Market estimates and forecast, by service, 2018 - 2032
- 8.4.5.3 Market estimates and forecast, by technology, 2018 - 2032
- 8.4.5.4 Market estimates and forecast, by end-use, 2018 - 2032
- 8.4.6 India
- 8.4.6.1 Market estimates and forecast, 2018 - 2032
- 8.4.6.2 Market estimates and forecast, by service, 2018 - 2032
- 8.4.6.3 Market estimates and forecast, by technology, 2018 - 2032
- 8.4.6.4 Market estimates and forecast, by end-use, 2018 - 2032
- 8.4.7 Japn
- 8.4.7.1 Market estimates and forecast, 2018 - 2032
- 8.4.7.2 Market estimates and forecast, by service, 2018 - 2032
- 8.4.7.3 Market estimates and forecast, by technology, 2018 - 2032
- 8.4.7.4 Market estimates and forecast, by end-use, 2018 - 2032
- 8.4.8 South Korea
- 8.4.8.1 Market estimates and forecast, 2018 - 2032
- 8.4.8.2 Market estimates and forecast, by service, 2018 - 2032
- 8.4.8.3 Market estimates and forecast, by technology, 2018 - 2032
- 8.4.8.4 Market estimates and forecast, by end-use, 2018 - 2032
- 8.4.9 Australia and New Zealand
- 8.4.9.1 Market estimates and forecast, 2018 - 2032
- 8.4.9.2 Market estimates and forecast, by service, 2018 - 2032
- 8.4.9.3 Market estimates and forecast, by technology, 2018 - 2032
- 8.4.9.4 Market estimates and forecast, by end-use, 2018 - 2032
- 8.4.10 Southeast Asia
- 8.4.10.1 Market estimates and forecast, 2018 - 2032
- 8.4.10.2 Market estimates and forecast, by service, 2018 - 2032
- 8.4.10.3 Market estimates and forecast, by technology, 2018 - 2032
- 8.4.10.4 Market estimates and forecast, by end-use, 2018 - 2032
- 8.5 Latin America
- 8.5.1 Market estimates and forecast, 2018 - 2032
- 8.5.2 Market estimates and forecast, by service, 2018 - 2032
- 8.5.3 Market estimates and forecast, by technology, 2018 - 2032
- 8.5.4 Market estimates and forecast, by end-use, 2018 - 2032
- 8.5.5 Brazil
- 8.5.5.1 Market estimates and forecast, 2018 - 2032
- 8.5.5.2 Market estimates and forecast, by service, 2018 - 2032
- 8.5.5.3 Market estimates and forecast, by technology, 2018 - 2032
- 8.5.5.4 Market estimates and forecast, by end-use, 2018 - 2032
- 8.5.6 Mexico
- 8.5.6.1 Market estimates and forecast, 2018 - 2032
- 8.5.6.2 Market estimates and forecast, by service, 2018 - 2032
- 8.5.6.3 Market estimates and forecast, by technology, 2018 - 2032
- 8.5.6.4 Market estimates and forecast, by end-use, 2018 - 2032
- 8.5.7 Colombia
- 8.5.7.1 Market estimates and forecast, 2018 - 2032
- 8.5.7.2 Market estimates and forecast, by service, 2018 - 2032
- 8.5.7.3 Market estimates and forecast, by technology, 2018 - 2032
- 8.5.7.4 Market estimates and forecast, by end-use, 2018 - 2032
- 8.6 MEA
- 8.6.1 Market estimates and forecast, 2018 - 2032
- 8.6.2 Market estimates and forecast, by service, 2018 - 2032
- 8.6.3 Market estimates and forecast, by technology, 2018 - 2032
- 8.6.4 Market estimates and forecast, by end-use, 2018 - 2032
- 8.6.5 South Africa
- 8.6.5.1 Market estimates and forecast, 2018 - 2032
- 8.6.5.2 Market estimates and forecast, by service, 2018 - 2032
- 8.6.5.3 Market estimates and forecast, by technology, 2018 - 2032
- 8.6.5.4 Market estimates and forecast, by end-use, 2018 - 2032
- 8.6.6 Saudi Arabia
- 8.6.6.1 Market estimates and forecast, 2018 - 2032
- 8.6.6.2 Market estimates and forecast, by service, 2018 - 2032
- 8.6.6.3 Market estimates and forecast, by technology, 2018 - 2032
- 8.6.6.4 Market estimates and forecast, by end-use, 2018 - 2032
- 8.6.7 UAE
- 8.6.7.1 Market estimates and forecast, 2018 - 2032
- 8.6.7.2 Market estimates and forecast, by service, 2018 - 2032
- 8.6.7.3 Market estimates and forecast, by technology, 2018 - 2032
- 8.6.7.4 Market estimates and forecast, by end-use, 2018 - 2032
Chapter 9 Company Profiles
- 9.1 Avaya Inc.
- 9.1.1 Business Overview
- 9.1.2 Financial Data
- 9.1.3 Product Landscape
- 9.1.4 Go-to-Market Strategy
- 9.1.5 SWOT Analysis
- 9.2 Bell Canada
- 9.2.1 Business Overview
- 9.2.2 Financial Data
- 9.2.3 Product Landscape
- 9.2.4 Go-to-Market Strategy
- 9.2.5 SWOT Analysis
- 9.3 Captel Inc.
- 9.3.1 Business Overview
- 9.3.2 Financial Data
- 9.3.3 Product Landscape
- 9.3.4 Go-to-Market Strategy
- 9.3.5 SWOT Analysis
- 9.4 Cisco Systems Inc.
- 9.4.1 Business Overview
- 9.4.2 Financial Data
- 9.4.3 Product Landscape
- 9.4.4 Go-to-Market Strategy
- 9.4.5 SWOT Analysis
- 9.5 Convo Communications LLC
- 9.5.1 Business Overview
- 9.5.2 Financial Data
- 9.5.3 Product Landscape
- 9.5.4 Go-to-Market Strategy
- 9.5.5 SWOT Analysis
- 9.6 Cox Communications, Inc.
- 9.6.1 Business Overview
- 9.6.2 Financial Data
- 9.6.3 Product Landscape
- 9.6.4 Go-to-Market Strategy
- 9.6.5 SWOT Analysis
- 9.7 DeafTawk
- 9.7.1 Business Overview
- 9.7.2 Financial Data
- 9.7.3 Product Landscape
- 9.7.4 Go-to-Market Strategy
- 9.7.5 SWOT Analysis
- 9.8 KCOM Group Limited
- 9.8.1 Business Overview
- 9.8.2 Financial Data
- 9.8.3 Product Landscape
- 9.8.4 Go-to-Market Strategy
- 9.8.5 SWOT Analysis
- 9.9 nWise AB
- 9.9.1 Business Overview
- 9.9.2 Financial Data
- 9.9.3 Product Landscape
- 9.9.4 Go-to-Market Strategy
- 9.9.5 SWOT Analysis
- 9.10 Relay UK BT (BT Group PLC)
- 9.10.1 Business Overview
- 9.10.2 Financial Data
- 9.10.3 Product Landscape
- 9.10.4 Go-to-Market Strategy
- 9.10.5 SWOT Analysis
- 9.11 Skype Technologies S.A.R.L (Microsoft Corporation)
- 9.11.1 Business Overview
- 9.11.2 Financial Data
- 9.11.3 Product Landscape
- 9.11.4 Go-to-Market Strategy
- 9.11.5 SWOT Analysis
- 9.12 Sorenson Communications LLC
- 9.12.1 Business Overview
- 9.12.2 Financial Data
- 9.12.3 Product Landscape
- 9.12.4 Go-to-Market Strategy
- 9.12.5 SWOT Analysis
- 9.13 Spectrum
- 9.13.1 Business Overview
- 9.13.2 Financial Data
- 9.13.3 Product Landscape
- 9.13.4 Go-to-Market Strategy
- 9.13.5 SWOT Analysis
- 9.14 Sprint Relay (T-Mobile USA Inc.)
- 9.14.1 Business Overview
- 9.14.2 Financial Data
- 9.14.3 Product Landscape
- 9.14.4 Go-to-Market Strategy
- 9.14.5 SWOT Analysis
- 9.15 T-Meeting
- 9.15.1 Business Overview
- 9.15.2 Financial Data
- 9.15.3 Product Landscape
- 9.15.4 Go-to-Market Strategy
- 9.15.5 SWOT Analysis
- 9.16 ZVRS (ZP Better Together LLC)
- 9.16.1 Business Overview
- 9.16.2 Financial Data
- 9.16.3 Product Landscape
- 9.16.4 Go-to-Market Strategy
- 9.16.5 SWOT Analysis