|
|
市場調査レポート
商品コード
1134410
IaC (Infrastructure as Code) の世界市場 (2022年~2030年):市場規模 (アプローチ・組織規模・展開・エンドユーザー・インフラ別)・地域的展望・成長の潜在性・競合市場シェア・予測Infrastructure as Code Market Size By Approach, By Organization Size, By Deployment, By End-Use, By Infrastructure, Regional Outlook, Growth Potential, Competitive Market Share & Forecast, 2022 - 2030 |
||||||
|
|
|||||||
|
● お客様のご希望に応じて、既存データの加工や未掲載情報(例:国別セグメント)の追加などの対応が可能です。 詳細はお問い合わせください。 |
|||||||


| IaC (Infrastructure as Code) の世界市場 (2022年~2030年):市場規模 (アプローチ・組織規模・展開・エンドユーザー・インフラ別)・地域的展望・成長の潜在性・競合市場シェア・予測 |
|
出版日: 2022年10月11日
発行: Global Market Insights Inc.
ページ情報: 英文 350 Pages
納期: 2~3営業日
|
- 全表示
- 概要
- 図表
- 目次
世界のIaC (Infrastructure as Code) の市場は、2022年から2030年にかけて大きく成長すると予測されています。
これは、手動による設定作業を最小限に抑えることにより、信頼性と生産性を向上させるIaCツールへの需要が高まっているためです。
アプローチ別で見ると、2030年までに宣言型の部門が大きなシェアを占めると予測されています。宣言型は、命令型よりも俊敏性、拡張性、生産性に優れており、世界中でその採用が進んでいます。このアプローチにより、開発者は複雑なプログラムを圧縮した形で表現し、高い抽出能力によってソリューションモデルの概要をより迅速に示すことができるため、2022年から2030年にかけて同部門のシェアが拡大すると予想されています。
当レポートでは、世界のIaC (Infrastructure as Code) の市場を調査し、市場概要、市場成長への各種影響因子の分析、法規制環境、技術・イノベーションの情勢、特許動向、市場規模の推移・予測、各種区分・地域/主要国別の内訳、競合環境、主要企業のプロファイルなどをまとめています。
目次
第1章 調査手法・調査範囲
第2章 エグゼクティブサマリー
第3章 IaC (Infrastructure as Code) 産業の考察
- COVID-19の影響
- ロシア・ウクライナ紛争の影響
- IaC産業のエコシステム分析
- 技術・イノベーションの情勢
- 特許分析
- 投資ポートフォリオ
- 主なイニシアチブとニュース
- 規制状況
- 産業への影響要因
- 促進要因
- 潜在的リスク&課題
- 成長性分析
- ポーターの分析
- PESTEL分析
第4章 競合情勢
- 企業の市場シェア
- 主要企業の競合分析
- 著名企業の競合分析
- ベンダー採用マトリックス
- 戦略的展望マトリックス
第5章 IaC (Infrastructure as Code) 市場:アプローチ別
- 宣言型
- 命令型
第6章 IaC (Infrastructure as Code) 市場:組織規模別
- 中小企業
- 大企業
第7章 IaC (Infrastructure as Code) 市場:展開別
- オンプレミス
- クラウド
第8章 IaC (Infrastructure as Code) 市場:エンドユーザー別
- 政府
- IT・通信
- ヘルスケア
- BFSI
- 製造
- 小売
- その他
第9章 IaC (Infrastructure as Code) 市場:インフラ別
- ミュータブルIaC
- イミュータブルIaC
第10章 IaC (Infrastructure as Code) 市場:地域別
- 北米
- 欧州
- アジア太平洋
- ラテンアメリカ・中東・アフリカ
第11章 企業プロファイル
- Alpacked LLC
- Amazon.com, Inc.
- Dell Inc.
- Google LLC
- HashiCorp, Inc.
- Hewlett Packard Enterprise Development LP
- IBM Corporation
- Microsoft Corporation
- Oracle Corporation
- Progress Software Corporation
- Pulumi
- Puppet
Data Tables
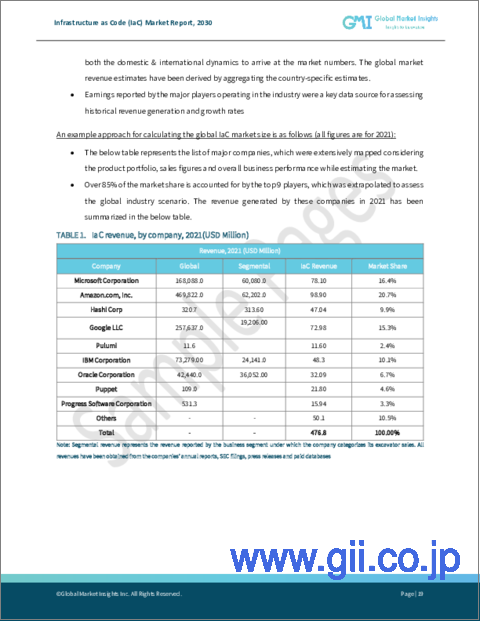
- TABLE 1 Infrastructure as Code (IaC) industry 360 degree synopsis, 2018 - 2030
- TABLE 2 Data sources
- TABLE 3 Glossary
- TABLE 4 Infrastructure as Code (IaC) market, 2018- 2021, (USD Million)
- TABLE 5 Infrastructure as Code (IaC) market, 2022 - 2030, (USD Million)
- TABLE 6 Infrastructure as Code (IaC) market, by region, 2018- 2021 (USD Million)
- TABLE 7 Infrastructure as Code (IaC) market, by region, 2022 - 2030 (USD Million)
- TABLE 8 Infrastructure as Code (IaC) market, by approach, 2018- 2021 (USD Million)
- TABLE 9 Infrastructure as Code (IaC) market, by approach, 2022 - 2030 (USD Million)
- TABLE 10 Infrastructure as Code (IaC) market, by organization size, 2018- 2021 (USD Million)
- TABLE 11 Infrastructure as Code (IaC) market, by organization size, 2022 - 2030 (USD Million)
- TABLE 12 Infrastructure as Code (IaC) market, by deployment, 2018- 2021 (USD Million)
- TABLE 13 Infrastructure as Code (IaC) market, by deployment, 2022 - 2030 (USD Million)
- TABLE 14 Infrastructure as Code (IaC) market, by end-use, 2018- 2021 (USD Million)
- TABLE 15 Infrastructure as Code (IaC) market, by end-use, 2022 - 2030 (USD Million)
- TABLE 16 Infrastructure as Code (IaC) market, by infrastructure, 2018- 2021 (USD Million)
- TABLE 17 Infrastructure as Code (IaC) market, by infrastructure, 2022 - 2030 (USD Million)
- TABLE 18 Vendor matrix
- TABLE 19 Industry impact forces
- TABLE 20 Declarative approach market, 2018- 2021 (USD Million)
- TABLE 21 Declarative approach market, 2022 - 2030 (USD Million)
- TABLE 22 Imperative approach market, 2018- 2021 (USD Million)
- TABLE 23 Imperative approach market, 2022 - 2030 (USD Million)
- TABLE 24 SMEs market, 2018- 2021 (USD Million)
- TABLE 25 SMEs market, 2022 - 2030 (USD Million)
- TABLE 26 Large enterprises market, 2018- 2021 (USD Million)
- TABLE 27 Large enterprises market, 2022 - 2030 (USD Million)
- TABLE 28 On-premise market, 2018- 2021 (USD Million)
- TABLE 29 On-premise market, 2022 - 2030 (USD Million)
- TABLE 30 Cloud market, 2018- 2021 (USD Million)
- TABLE 31 Cloud market, 2022 - 2030 (USD Million)
- TABLE 32 Government application market, 2018- 2021 (USD Million)
- TABLE 33 Government application market, 2022 - 2030 (USD Million)
- TABLE 34 IT & telecom application market, 2018- 2021 (USD Million)
- TABLE 35 IT & telecom application market, 2022 - 2030 (USD Million)
- TABLE 36 Healthcare application market, 2018- 2021 (USD Million)
- TABLE 37 Healthcare application market, 2022 - 2030 (USD Million)
- TABLE 38 BFSI application market, 2018- 2021 (USD Million)
- TABLE 39 BFSI application market, 2022 - 2030 (USD Million)
- TABLE 40 Manufacturing application market, 2018- 2021 (USD Million)
- TABLE 41 Manufacturing application market, 2022 - 2030 (USD Million)
- TABLE 42 Retail application market, 2018- 2021 (USD Million)
- TABLE 43 Retail application market, 2022 - 2030 (USD Million)
- TABLE 44 Others market, 2018- 2021 (USD Million)
- TABLE 45 Others market, 2022 - 2030 (USD Million)
- TABLE 46 Mutable IaC market, 2018- 2021 (USD Million)
- TABLE 47 Mutable IaC market, 2022 - 2030 (USD Million)
- TABLE 48 Immutable IaC market, 2018- 2021 (USD Million)
- TABLE 49 Immutable IaC market, 2022 - 2030 (USD Million)
- TABLE 50 North America IaC market, 2018- 2021 (USD Million)
- TABLE 51 North America IaC market, 2022 - 2030 (USD Million)
- TABLE 52 North America IaC market, by approach, 2018- 2021 (USD Million)
- TABLE 53 North America IaC market, by approach, 2022 - 2030 (USD Million)
- TABLE 54 North America IaC market, by organization size, 2018- 2021 (USD Million)
- TABLE 55 North America IaC market, by organization size, 2022 - 2030 (USD Million)
- TABLE 56 North America IaC market, by deployment, 2018- 2021 (USD Million)
- TABLE 57 North America IaC market, by deployment, 2022 - 2030 (USD Million)
- TABLE 58 North America IaC market, by end-use, 2018- 2021 (USD Million)
- TABLE 59 North America IaC market, by end-use, 2022 - 2030 (USD Million)
- TABLE 60 North America IaC market, by infrastructure, 2018- 2021 (USD Million)
- TABLE 61 North America IaC market, by infrastructure, 2022 - 2030 (USD Million)
- TABLE 62 U.S. IaC market, 2018- 2021 (USD Million)
- TABLE 63 U.S. IaC market, 2022 - 2030 (USD Million)
- TABLE 64 U.S. IaC market, by approach, 2018- 2021 (USD Million)
- TABLE 65 U.S. IaC market, by approach, 2022 - 2030 (USD Million)
- TABLE 66 U.S. IaC market, by organization size, 2018- 2021 (USD Million)
- TABLE 67 U.S. IaC market, by organization size, 2022 - 2030 (USD Million)
- TABLE 68 U.S. IaC market, by deployment, 2018- 2021 (USD Million)
- TABLE 69 U.S. IaC market, by deployment, 2022 - 2030 (USD Million)
- TABLE 70 U.S. IaC market, by end-use, 2018- 2021 (USD Million)
- TABLE 71 U.S. IaC market, by end-use, 2022 - 2030 (USD Million)
- TABLE 72 U.S. IaC market, by infrastructure, 2018- 2021 (USD Million)
- TABLE 73 U.S. IaC market, by infrastructure, 2022 - 2030 (USD Million)
- TABLE 74 Canada IaC market, 2018- 2021 (USD Million)
- TABLE 75 Canada IaC market, 2022 - 2030 (USD Million)
- TABLE 76 Canada IaC market, by approach, 2018- 2021 (USD Million)
- TABLE 77 Canada IaC market, by approach, 2022 - 2030 (USD Million)
- TABLE 78 Canada IaC market, by organization size, 2018- 2021 (USD Million)
- TABLE 79 Canada IaC market, by organization size, 2022 - 2030 (USD Million)
- TABLE 80 Canada IaC market, by deployment, 2018- 2021 (USD Million)
- TABLE 81 Canada IaC market, by deployment, 2022 - 2030 (USD Million)
- TABLE 82 Canada IaC market, by end-use, 2018- 2021 (USD Million)
- TABLE 83 Canada IaC market, by end-use, 2022 - 2030 (USD Million)
- TABLE 84 Canada IaC market, by infrastructure, 2018- 2021 (USD Million)
- TABLE 85 Canada IaC market, by infrastructure, 2022 - 2030 (USD Million)
- TABLE 86 Europe IaC market, 2018- 2021 (USD Million)
- TABLE 87 Europe IaC market, 2022 - 2030 (USD Million)
- TABLE 88 Europe IaC market, by approach, 2018- 2021 (USD Million)
- TABLE 89 Europe IaC market, by approach, 2022 - 2030 (USD Million)
- TABLE 90 Europe IaC market, by organization size, 2018- 2021 (USD Million)
- TABLE 91 Europe IaC market, by organization size, 2022 - 2030 (USD Million)
- TABLE 92 Europe IaC market, by deployment, 2018- 2021 (USD Million)
- TABLE 93 Europe IaC market, by deployment, 2022 - 2030 (USD Million)
- TABLE 94 Europe IaC market, by end-use, 2018- 2021 (USD Million)
- TABLE 95 Europe IaC market, by end-use, 2022 - 2030 (USD Million)
- TABLE 96 Europe IaC market, by infrastructure, 2018- 2021 (USD Million)
- TABLE 97 Europe IaC market, by infrastructure, 2022 - 2030 (USD Million)
- TABLE 98 UK IaC market, 2018- 2021 (USD Million)
- TABLE 99 UK IaC market, 2022 - 2030 (USD Million)
- TABLE 100 UK IaC market, by approach, 2018- 2021 (USD Million)
- TABLE 101 UK IaC market, by approach, 2022 - 2030 (USD Million)
- TABLE 102 UK IaC market, by organization size, 2018- 2021 (USD Million)
- TABLE 103 UK IaC market, by organization size, 2022 - 2030 (USD Million)
- TABLE 104 UK IaC market, by deployment, 2018- 2021 (USD Million)
- TABLE 105 UK IaC market, by deployment, 2022 - 2030 (USD Million)
- TABLE 106 UK IaC market, by end-use, 2018- 2021 (USD Million)
- TABLE 107 UK IaC market, by end-use, 2022 - 2030 (USD Million)
- TABLE 108 UK IaC market, by infrastructure, 2018- 2021 (USD Million)
- TABLE 109 UK IaC market, by infrastructure, 2022 - 2030 (USD Million)
- TABLE 110 Germany IaC market, 2018- 2021 (USD Million)
- TABLE 111 Germany IaC market, 2022 - 2030 (USD Million)
- TABLE 112 Germany IaC market, by approach, 2018- 2021 (USD Million)
- TABLE 113 Germany IaC market, by approach, 2022 - 2030 (USD Million)
- TABLE 114 Germany IaC market, by organization size, 2018- 2021 (USD Million)
- TABLE 115 Germany IaC market, by organization size, 2022 - 2030 (USD Million)
- TABLE 116 Germany IaC market, by deployment, 2018- 2021 (USD Million)
- TABLE 117 Germany IaC market, by deployment, 2022 - 2030 (USD Million)
- TABLE 118 Germany IaC market, by end-use, 2018- 2021 (USD Million)
- TABLE 119 Germany IaC market, by end-use, 2022 - 2030 (USD Million)
- TABLE 120 Germany IaC market, by infrastructure, 2018- 2021 (USD Million)
- TABLE 121 Germany IaC market, by infrastructure, 2022 - 2030 (USD Million)
- TABLE 122 France IaC market, 2018- 2021 (USD Million)
- TABLE 123 France IaC market, 2022 - 2030 (USD Million)
- TABLE 124 France IaC market, by approach, 2018- 2021 (USD Million)
- TABLE 125 France IaC market, by approach, 2022 - 2030 (USD Million)
- TABLE 126 France IaC market, by organization size, 2018- 2021 (USD Million)
- TABLE 127 France IaC market, by organization size, 2022 - 2030 (USD Million)
- TABLE 128 France IaC market, by deployment, 2018- 2021 (USD Million)
- TABLE 129 France IaC market, by deployment, 2022 - 2030 (USD Million)
- TABLE 130 France IaC market, by end-use, 2018- 2021 (USD Million)
- TABLE 131 France IaC market, by end-use, 2022 - 2030 (USD Million)
- TABLE 132 France IaC market, by infrastructure, 2018- 2021 (USD Million)
- TABLE 133 France IaC market, by infrastructure, 2022 - 2030 (USD Million)
- TABLE 134 Italy IaC market, 2018- 2021 (USD Million)
- TABLE 135 Italy IaC market, 2022 - 2030 (USD Million)
- TABLE 136 Italy IaC market, by approach, 2018- 2021 (USD Million)
- TABLE 137 Italy IaC market, by approach, 2022 - 2030 (USD Million)
- TABLE 138 Italy IaC market, by organization size, 2018- 2021 (USD Million)
- TABLE 139 Italy IaC market, by organization size, 2022 - 2030 (USD Million)
- TABLE 140 Italy IaC market, by deployment, 2018- 2021 (USD Million)
- TABLE 141 Italy IaC market, by deployment, 2022 - 2030 (USD Million)
- TABLE 142 Italy IaC market, by end-use, 2018- 2021 (USD Million)
- TABLE 143 Italy IaC market, by end-use, 2022 - 2030 (USD Million)
- TABLE 144 Italy IaC market, by infrastructure, 2018- 2021 (USD Million)
- TABLE 145 Italy IaC market, by infrastructure, 2022 - 2030 (USD Million)
- TABLE 146 Spain IaC market, 2018- 2021 (USD Million)
- TABLE 147 Spain IaC market, 2022 - 2030 (USD Million)
- TABLE 148 Spain IaC market, by approach, 2018- 2021 (USD Million)
- TABLE 149 Spain IaC market, by approach, 2022 - 2030 (USD Million)
- TABLE 150 Spain IaC market, by organization size, 2018- 2021 (USD Million)
- TABLE 151 Spain IaC market, by organization size, 2022 - 2030 (USD Million)
- TABLE 152 Spain IaC market, by deployment, 2018- 2021 (USD Million)
- TABLE 153 Spain IaC market, by deployment, 2022 - 2030 (USD Million)
- TABLE 154 Spain IaC market, by end-use, 2018- 2021 (USD Million)
- TABLE 155 Spain IaC market, by end-use, 2022 - 2030 (USD Million)
- TABLE 156 Spain IaC market, by infrastructure, 2018- 2021 (USD Million)
- TABLE 157 Spain IaC market, by infrastructure, 2022 - 2030 (USD Million)
- TABLE 158 Benelux IaC market, 2018- 2021 (USD Million)
- TABLE 159 Benelux IaC market, 2022 - 2030 (USD Million)
- TABLE 160 Benelux IaC market, by approach, 2018- 2021 (USD Million)
- TABLE 161 Benelux IaC market, by approach, 2022 - 2030 (USD Million)
- TABLE 162 Benelux IaC market, by organization size, 2018- 2021 (USD Million)
- TABLE 163 Benelux IaC market, by organization size, 2022 - 2030 (USD Million)
- TABLE 164 Benelux IaC market, by deployment, 2018- 2021 (USD Million)
- TABLE 165 Benelux IaC market, by deployment, 2022 - 2030 (USD Million)
- TABLE 166 Benelux IaC market, by end-use, 2018- 2021 (USD Million)
- TABLE 167 Benelux IaC market, by end-use, 2022 - 2030 (USD Million)
- TABLE 168 Benelux IaC market, by infrastructure, 2018- 2021 (USD Million)
- TABLE 169 Benelux IaC market, by infrastructure, 2022 - 2030 (USD Million)
- TABLE 170 Asia Pacific IaC market, 2018- 2021 (USD Million)
- TABLE 171 Asia Pacific IaC market, 2022 - 2030 (USD Million)
- TABLE 172 Asia Pacific IaC market, by approach, 2018- 2021 (USD Million)
- TABLE 173 Asia Pacific IaC market, by approach, 2022 - 2030 (USD Million)
- TABLE 174 Asia Pacific IaC market, by organization size, 2018- 2021 (USD Million)
- TABLE 175 Asia Pacific IaC market, by organization size, 2022 - 2030 (USD Million)
- TABLE 176 Asia Pacific IaC market, by deployment, 2018- 2021 (USD Million)
- TABLE 177 Asia Pacific IaC market, by deployment, 2022 - 2030 (USD Million)
- TABLE 178 Asia Pacific IaC market, by end-use, 2018- 2021 (USD Million)
- TABLE 179 Asia Pacific IaC market, by end-use, 2022 - 2030 (USD Million)
- TABLE 180 Asia Pacific IaC market, by infrastructure, 2018- 2021 (USD Million)
- TABLE 181 Asia Pacific IaC market, by infrastructure, 2022 - 2030 (USD Million)
- TABLE 182 China IaC market, 2018- 2021 (USD Million)
- TABLE 183 China IaC market, 2022 - 2030 (USD Million)
- TABLE 184 China IaC market, by approach, 2018- 2021 (USD Million)
- TABLE 185 China IaC market, by approach, 2022 - 2030 (USD Million)
- TABLE 186 China IaC market, by organization size, 2018- 2021 (USD Million)
- TABLE 187 China IaC market, by organization size, 2022 - 2030 (USD Million)
- TABLE 188 China IaC market, by deployment, 2018- 2021 (USD Million)
- TABLE 189 China IaC market, by deployment, 2022 - 2030 (USD Million)
- TABLE 190 China IaC market, by end-use, 2018- 2021 (USD Million)
- TABLE 191 China IaC market, by end-use, 2022 - 2030 (USD Million)
- TABLE 192 China IaC market, by infrastructure, 2018- 2021 (USD Million)
- TABLE 193 China IaC market, by infrastructure, 2022 - 2030 (USD Million)
- TABLE 194 India IaC market, 2018- 2021 (USD Million)
- TABLE 195 India IaC market, 2022 - 2030 (USD Million)
- TABLE 196 India IaC market, by approach, 2018- 2021 (USD Million)
- TABLE 197 India IaC market, by approach, 2022 - 2030 (USD Million)
- TABLE 198 India IaC market, by organization size, 2018- 2021 (USD Million)
- TABLE 199 India IaC market, by organization size, 2022 - 2030 (USD Million)
- TABLE 200 India IaC market, by deployment, 2018- 2021 (USD Million)
- TABLE 201 India IaC market, by deployment, 2022 - 2030 (USD Million)
- TABLE 202 India IaC market, by end-use, 2018- 2021 (USD Million)
- TABLE 203 India IaC market, by end-use, 2022 - 2030 (USD Million)
- TABLE 204 India IaC market, by infrastructure, 2018- 2021 (USD Million)
- TABLE 205 India IaC market, by infrastructure, 2022 - 2030 (USD Million)
- TABLE 206 Japan IaC market, 2018- 2021 (USD Million)
- TABLE 207 Japan IaC market, 2022 - 2030 (USD Million)
- TABLE 208 Japan IaC market, by approach, 2018- 2021 (USD Million)
- TABLE 209 Japan IaC market, by approach, 2022 - 2030 (USD Million)
- TABLE 210 Japan IaC market, by organization size, 2018- 2021 (USD Million)
- TABLE 211 Japan IaC market, by organization size, 2022 - 2030 (USD Million)
- TABLE 212 Japan IaC market, by deployment, 2018- 2021 (USD Million)
- TABLE 213 Japan IaC market, by deployment, 2022 - 2030 (USD Million)
- TABLE 214 Japan IaC market, by end-use, 2018- 2021 (USD Million)
- TABLE 215 Japan IaC market, by end-use, 2022 - 2030 (USD Million)
- TABLE 216 Japan IaC market, by infrastructure, 2018- 2021 (USD Million)
- TABLE 217 Japan IaC market, by infrastructure, 2022 - 2030 (USD Million)
- TABLE 218 South Korea IaC market, 2018- 2021 (USD Million)
- TABLE 219 South Korea IaC market, 2022 - 2030 (USD Million)
- TABLE 220 South Korea IaC market, by approach, 2018- 2021 (USD Million)
- TABLE 221 South Korea IaC market, by approach, 2022 - 2030 (USD Million)
- TABLE 222 South Korea IaC market, by organization size, 2018- 2021 (USD Million)
- TABLE 223 South Korea IaC market, by organization size, 2022 - 2030 (USD Million)
- TABLE 224 South Korea IaC market, by deployment, 2018- 2021 (USD Million)
- TABLE 225 South Korea IaC market, by deployment, 2022 - 2030 (USD Million)
- TABLE 226 South Korea IaC market, by end-use, 2018- 2021 (USD Million)
- TABLE 227 South Korea IaC market, by end-use, 2022 - 2030 (USD Million)
- TABLE 228 South Korea IaC market, by infrastructure, 2018- 2021 (USD Million)
- TABLE 229 South Korea IaC market, by infrastructure, 2022 - 2030 (USD Million)
- TABLE 230 ANZ IaC market, 2018- 2021 (USD Million)
- TABLE 231 ANZ IaC market, 2022 - 2030 (USD Million)
- TABLE 232 ANZ IaC market, by approach, 2018- 2021 (USD Million)
- TABLE 233 ANZ IaC market, by approach, 2022 - 2030 (USD Million)
- TABLE 234 ANZ IaC market, by organization size, 2018- 2021 (USD Million)
- TABLE 235 ANZ IaC market, by organization size, 2022 - 2030 (USD Million)
- TABLE 236 ANZ IaC market, by deployment, 2018- 2021 (USD Million)
- TABLE 237 ANZ IaC market, by deployment, 2022 - 2030 (USD Million)
- TABLE 238 ANZ IaC market, by end-use, 2018- 2021 (USD Million)
- TABLE 239 ANZ IaC market, by end-use, 2022 - 2030 (USD Million)
- TABLE 240 ANZ IaC market, by infrastructure, 2018- 2021 (USD Million)
- TABLE 241 ANZ IaC market, by infrastructure, 2022 - 2030 (USD Million)
- TABLE 242 LAMEA IaC market, 2018- 2021 (USD Million)
- TABLE 243 LAMEA IaC market, 2022 - 2030 (USD Million)
- TABLE 244 LAMEA IaC market, by approach, 2018- 2021 (USD Million)
- TABLE 245 LAMEA IaC market, by approach, 2022 - 2030 (USD Million)
- TABLE 246 LAMEA IaC market, by organization size, 2018- 2021 (USD Million)
- TABLE 247 LAMEA IaC market, by organization size, 2022 - 2030 (USD Million)
- TABLE 248 LAMEA IaC market, by deployment, 2018- 2021 (USD Million)
- TABLE 249 LAMEA IaC market, by deployment, 2022 - 2030 (USD Million)
- TABLE 250 LAMEA IaC market, by end-use, 2018- 2021 (USD Million)
- TABLE 251 LAMEA IaC market, by end-use, 2022 - 2030 (USD Million)
- TABLE 252 LAMEA IaC market, by infrastructure, 2018- 2021 (USD Million)
- TABLE 253 LAMEA IaC market, by infrastructure, 2022 - 2030 (USD Million)
- TABLE 254 Brazil IaC market, 2018- 2021 (USD Million)
- TABLE 255 Brazil IaC market, 2022 - 2030 (USD Million)
- TABLE 256 Brazil IaC market, by approach, 2018- 2021 (USD Million)
- TABLE 257 Brazil IaC market, by approach, 2022 - 2030 (USD Million)
- TABLE 258 Brazil IaC market, by organization size, 2018- 2021 (USD Million)
- TABLE 259 Brazil IaC market, by organization size, 2022 - 2030 (USD Million)
- TABLE 260 Brazil IaC market, by deployment, 2018- 2021 (USD Million)
- TABLE 261 Brazil IaC market, by deployment, 2022 - 2030 (USD Million)
- TABLE 262 Brazil IaC market, by end-use, 2018- 2021 (USD Million)
- TABLE 263 Brazil IaC market, by end-use, 2022 - 2030 (USD Million)
- TABLE 264 Brazil IaC market, by infrastructure, 2018- 2021 (USD Million)
- TABLE 265 Brazil IaC market, by infrastructure, 2022 - 2030 (USD Million)
- TABLE 266 Mexico IaC market, 2018- 2021 (USD Million)
- TABLE 267 Mexico IaC market, 2022 - 2030 (USD Million)
- TABLE 268 Mexico IaC market, by approach, 2018- 2021 (USD Million)
- TABLE 269 Mexico IaC market, by approach, 2022 - 2030 (USD Million)
- TABLE 270 Mexico IaC market, by organization size, 2018- 2021 (USD Million)
- TABLE 271 Mexico IaC market, by organization size, 2022 - 2030 (USD Million)
- TABLE 272 Mexico IaC market, by deployment, 2018- 2021 (USD Million)
- TABLE 273 Mexico IaC market, by deployment, 2022 - 2030 (USD Million)
- TABLE 274 Mexico IaC market, by end-use, 2018- 2021 (USD Million)
- TABLE 275 Mexico IaC market, by end-use, 2022 - 2030 (USD Million)
- TABLE 276 Mexico IaC market, by infrastructure, 2018- 2021 (USD Million)
- TABLE 277 Mexico IaC market, by infrastructure, 2022 - 2030 (USD Million)
- TABLE 278 UAE IaC market, 2018- 2021 (USD Million)
- TABLE 279 UAE IaC market, 2022 - 2030 (USD Million)
- TABLE 280 UAE IaC market, by approach, 2018- 2021 (USD Million)
- TABLE 281 UAE IaC market, by approach, 2022 - 2030 (USD Million)
- TABLE 282 UAE IaC market, by organization size, 2018- 2021 (USD Million)
- TABLE 283 UAE IaC market, by organization size, 2022 - 2030 (USD Million)
- TABLE 284 UAE IaC market, by deployment, 2018- 2021 (USD Million)
- TABLE 285 UAE IaC market, by deployment, 2022 - 2030 (USD Million)
- TABLE 286 UAE IaC market, by end-use, 2018- 2021 (USD Million)
- TABLE 287 UAE IaC market, by end-use, 2022 - 2030 (USD Million)
- TABLE 288 UAE IaC market, by infrastructure, 2018- 2021 (USD Million)
- TABLE 289 UAE IaC market, by infrastructure, 2022 - 2030 (USD Million)
- TABLE 290 Israel IaC market, 2018- 2021 (USD Million)
- TABLE 291 Israel IaC market, 2022 - 2030 (USD Million)
- TABLE 292 Israel IaC market, by approach, 2018- 2021 (USD Million)
- TABLE 293 Israel IaC market, by approach, 2022 - 2030 (USD Million)
- TABLE 294 Israel IaC market, by organization size, 2018- 2021 (USD Million)
- TABLE 295 Israel IaC market, by organization size, 2022 - 2030 (USD Million)
- TABLE 296 Israel IaC market, by deployment, 2018- 2021 (USD Million)
- TABLE 297 Israel IaC market, by deployment, 2022 - 2030 (USD Million)
- TABLE 298 Israel IaC market, by end-use, 2018- 2021 (USD Million)
- TABLE 299 Israel IaC market, by end-use, 2022 - 2030 (USD Million)
- TABLE 300 Israel IaC market, by infrastructure, 2018- 2021 (USD Million)
- TABLE 301 Israel IaC market, by infrastructure, 2022 - 2030 (USD Million)
- TABLE 302 South Africa IaC market, 2018- 2021 (USD Million)
- TABLE 303 South Africa IaC market, 2022 - 2030 (USD Million)
- TABLE 304 South Africa IaC market, by approach, 2018- 2021 (USD Million)
- TABLE 305 South Africa IaC market, by approach, 2022 - 2030 (USD Million)
- TABLE 306 South Africa IaC market, by organization size, 2018- 2021 (USD Million)
- TABLE 307 South Africa IaC market, by organization size, 2022 - 2030 (USD Million)
- TABLE 308 South Africa IaC market, by deployment, 2018- 2021 (USD Million)
- TABLE 309 South Africa IaC market, by deployment, 2022 - 2030 (USD Million)
- TABLE 310 South Africa IaC market, by end-use, 2018- 2021 (USD Million)
- TABLE 311 South Africa IaC market, by end-use, 2022 - 2030 (USD Million)
- TABLE 312 South Africa IaC market, by infrastructure, 2018- 2021 (USD Million)
- TABLE 313 South Africa IaC market, by infrastructure, 2022 - 2030 (USD Million)
Charts & Figures
- FIG 1 Infrastructure as Code (IaC) industry 36 degree synopsis, 2018- 2030
- FIG 2 Infrastructure as Code (IaC) industry ecosystem analysis
- FIG 3 Growth potential analysis
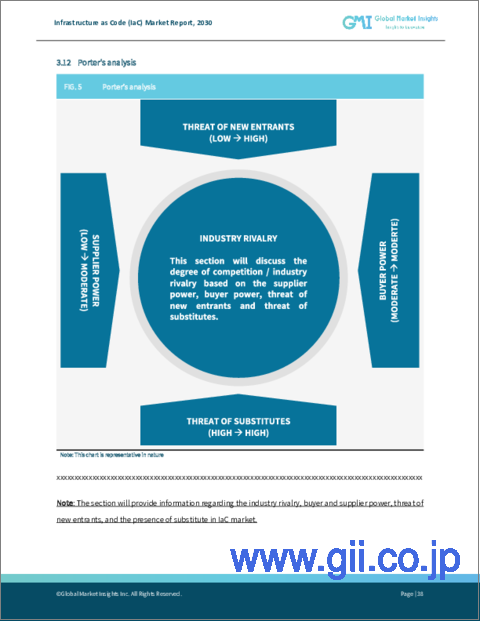
- FIG 4 Porter's analysis
- FIG 5 PESTEL analysis
- FIG 6 Company market share, 2021
- FIG 7 Vendor adoption matrix
- FIG 8 Strategic outlook matrix
- FIG 9 Competitive analysis of major market players, 2021
- FIG 10 Competitive analysis of prominent market players, 2021
- FIG 11 Infrastructure as Code (IaC) market, by approach, 2021 & 2030
- FIG 12 Infrastructure as Code (IaC) market, by organization size, 2021 & 2030
- FIG 13 Infrastructure as Code (IaC) market, by deployment, 2021 & 2030
- FIG 14 Infrastructure as Code (IaC) market, by end-use, 2021 & 2030
- FIG 15 Infrastructure as Code (IaC) market, by infrastructure, 2021 & 2030
- FIG 16 Infrastructure as Code (IaC) market, by region, 2021 & 2030
- FIG 17 SWOT Analysis, Alpacked LLC
- FIG 18 SWOT Analysis, Amazon.com, Inc.
- FIG 19 SWOT Analysis, Dell Inc.
- FIG 20 SWOT Analysis, Google LLC
- FIG 21 SWOT Analysis, HashiCorp, Inc.
- FIG 22 SWOT Analysis, Hewlett Packard Enterprise Development LP
- FIG 23 SWOT Analysis, IBM Corporation
- FIG 24 SWOT Analysis, Microsoft Corporation
- FIG 25 SWOT Analysis, Oracle Corporation
- FIG 26 SWOT Analysis, Progress Software Corporation
- FIG 27 SWOT Analysis, Pulumi
- FIG 28 SWOT Analysis, Puppet
Global Infrastructure as Code (IaC) Market is set to depict significant growth from 2022 to 2030, owing to the mounting demand for IaC tools due to their ability to improve reliability and productivity by minimizing manual configuration action.
The infrastructure configuration is stored in electronic files, and software is responsible for setting up infrastructure changes, reducing the possibility of human error. Tech players and software developers globally have been undertaking several R&D projects focused on developing composable infrastructure. The development of composable infrastructure aids in the streamlining of operations, scaling of resources, and increasing built-in data protection and recovery. The modular infrastructure provides a cloud-like experience for the provisioning of on-demand hardware and software resources.
The Infrastructure as Code (IaC) industry is classified based on approach, organization size, deployment model, infrastructure, end-use, and region.
Regarding the approach, the declarative segment is anticipated to account for a significant market share by 2030. Declarative languages offer greater agility, extensibility, and productivity than imperative languages, bolstering their adoption across the globe. This approach enables developers to illustrate convoluted programs in a compressed form and outline solution models more quickly due to its high level of extraction, increasing the segment share between 2022 and 2030.
The SMEs segment is expected to hold a significant revenue share by 2030. The massive growth in enterprise data led by the ongoing digital transformation and the increasing focus on improving the overall customer experience will back the segment growth over the forthcoming years. The escalating requirement across organizations to increase scalability, agility, and resilience to boost the existing technological landscape and enable businesses to operate more efficiently will drive the demand for IaC services across SMEs.
The cloud deployment model is anticipated to gain considerable popularity over the next 8 years. This can be attributed to the increasing number of enterprises transitioning toward digitizing their workloads and the rising investments in IT infrastructure. The expanding remote workforce and the accelerating demand to introduce more secure, reliable, and scalable software solutions will augment the demand for cloud-based IaC solutions in the forthcoming years.
The BFSI segment is set to amass substantial valuation by the end of 2030 depicting a considerable growth rate in the 8 years. The rapid surge in digital payments globally has escalated the requirement for a more robust and secured IT infrastructure and efficient fraud detection mechanism to help protect customer credentials. The integration of IaC software across banking and financial organizations enhances overall security while diminishing the prospects of potential cyberattacks, thereby increasing their adoption through 2030.
Regionally, the Europe Infrastructure as Code market held over 27% market share in 2021 and is likely to record a sizeable valuation by 2030. The regional growth is credited to the robust economic outlook and proliferation of advanced technologies pushing the need for a better technological landscape. The increasing penetration of internet services and the evolving workplace requirements will drive IaC industry trends across Europe.
Table of Contents
Chapter 1 Methodology & Scope
- 1.1 Scope & definitions
- 1.2 Methodology and forecast parameters
- 1.3 COVID-19 impact
- 1.3.1 North America
- 1.3.2 Europe
- 1.3.3 Asia Pacific
- 1.3.4 LAMEA
- 1.4 Data Sources
- 1.4.1 Secondary
- 1.4.2 Primary
- 1.5 Glossary
Chapter 2 Executive Summary
- 2.1 Infrastructure as Code (IaC) industry 360 degree synopsis, 2018- 2030
- 2.2 Business trends
- 2.2.1 Total Adressable Market (TAM)
- 2.3 Regional trends
- 2.4 Approach trends
- 2.5 Organization size trends
- 2.6 Deployment trends
- 2.7 End-use trends
- 2.8 Infrstucture trends
Chapter 3 Infrastructure as Code (IaC) Industry Insights
- 3.1 Introduction
- 3.2 Impact of COVID-19 outbreak
- 3.2.1 North America
- 3.2.2 Europe
- 3.2.3 Asia Pacific
- 3.2.4 LAMEA
- 3.3 Impact of Russia-Ukraine conflict
- 3.4 Infrastructure as Code (IaC) industry ecosystem analysis
- 3.4.1 IaC solution providers
- 3.4.2 Cloud service providers
- 3.4.3 Distribution channel
- 3.4.4 End users
- 3.4.5 Profit margin analysis
- 3.4.6 Vendor matrix
- 3.5 Technology & innovation landscape
- 3.5.1 DevOps tools
- 3.5.2 Cloud computing
- 3.6 Patent analysis
- 3.7 Investment portfolio
- 3.8 Key initiatives & news
- 3.9 Regulatory landscape
- 3.9.1 North America.
- 3.9.2 Europe
- 3.9.3 Asia Pacific
- 3.9.4 LAMEA
- 3.10 Industry impact forces
- 3.10.1 Growth drivers
- 3.10.1.1 Rising investments to digitalize IT infrastructure
- 3.10.1.2 Growing need for process automation framework to reduce costs and improve productivity
- 3.10.1.3 Increasing focus of enterprises on automated compliance and security monitoring solutions
- 3.10.1.4 High demand to recover from ransomware and other disasters using infrastructure as code
- 3.10.2 Industry pitfalls & challenges
- 3.10.2.1 Lack of standardized DevOps tools and solutions
- 3.10.2.2 Risk of security over cloud-based deployment
- 3.10.1 Growth drivers
- 3.11 Growth potential analysis
- 3.12 Porter's analysis
- 3.12.1 Supplier power
- 3.12.2 Buyer power
- 3.12.3 Threat of new entratnt
- 3.12.4 Threat of substitute
- 3.12.5 Internal rivalry
- 3.13 PESTEL analysis
- 3.13.1 Political
- 3.13.2 Economical
- 3.13.3 Social
- 3.13.4 Technological
- 3.13.5 Environmental
- 3.13.6 Legal
Chapter 4 Competitive Landscape, 2021
- 4.1 Introduction
- 4.2 Company market share
- 4.3 Competive analysis of major market players
- 4.3.1 Amazon.com, Inc.
- 4.3.2 Microsoft Corporation
- 4.3.3 Google LLC
- 4.3.4 IBM Corporation
- 4.3.5 HashiCorp, Inc.
- 4.4 Competive analysis of prominent market players
- 4.4.1 Oracle Corporation
- 4.4.2 Puppet
- 4.4.3 Progress Software Corporation
- 4.4.4 Pulumi
- 4.5 Vendor adoption matrix
- 4.6 Strategic outlook matrix
Chapter 5 Infrastructure as Code (IaC) Market, By Approach
- 5.1 Infrastructure as Code (IaC) market, by approach, 2021 & 2030
- 5.2 Declarative
- 5.2.1 Market estimates and forecast, 2018- 2030
- 5.3 Imperative
- 5.3.1 Market estimates and forecast, 2018- 2030
Chapter 6 Infrastructure as Code (IaC) Market, By Organization Size
- 6.1 Infrastructure as Code (IaC) market, by organization size, 2021 & 2030
- 6.2 SMEs
- 6.2.1 Market estimates and forecast, 2018- 2030
- 6.3 Large Enterprises
- 6.3.1 Market estimates and forecast, 2018- 2030
Chapter 7 Infrastructure as Code (IaC) Market, By Deployment
- 7.1 Infrastructure as Code (IaC) market, by deployment, 2021 & 2030
- 7.2 On-premise
- 7.2.1 Market estimates and forecast, 2018- 2030
- 7.3 Cloud
- 7.3.1 Market estimates and forecast, 2018- 2030
Chapter 8 Infrastructure as Code (IaC) Market, By End-Use
- 8.1 Infrastructure as Code (IaC) market, by end-use, 2021 & 2030
- 8.2 Government
- 8.2.1 Market estimates and forecast, 2018- 2030
- 8.3 IT & Telecom
- 8.3.1 Market estimates and forecast, 2018- 2030
- 8.4 Healthcare
- 8.4.1 Market estimates and forecast, 2018- 2030
- 8.5 BFSI
- 8.5.1 Market estimates and forecast, 2018- 2030
- 8.6 Manufacturing
- 8.6.1 Market estimates and forecast, 2018- 2030
- 8.7 Retail
- 8.7.1 Market estimates and forecast, 2018- 2030
- 8.8 Others
- 8.8.1 Market estimates and forecast, 2018- 2030
Chapter 9 Infrastructure as Code (IaC) Market, By Infrastructure
- 9.1 Infrastructure as Code (IaC) market, by infrastructure, 2021 & 2030
- 9.2 Mutable IaC
- 9.2.1 Market estimates and forecast, 2018- 2030
- 9.3 Immutable IaC
- 9.3.1 Market estimates and forecast, 2018- 2030
Chapter 10 Infrastructure as Code (IaC) Market, By Region
- 10.1 Infrastructure as Code (IaC) market, by region, 2021 & 2030
- 10.2 North America
- 10.2.1 Market estimates and forecast, 2018- 2030
- 10.2.2 Market estimates and forecast, by approach, 2018- 2030
- 10.2.3 Market estimates and forecast, by organization size, 2018- 2030
- 10.2.4 Market estimates and forecast, by deployment, 2018- 2030
- 10.2.5 Market estimates and forecast, by end-use, 2018- 2030
- 10.2.6 Market estimates and forecast, by infrastructure, 2018- 2030
- 10.2.7 U.S.
- 10.2.7.1 Market estimates and forecast, 2018 - 2030
- 10.2.7.2 Market estimates and forecast, by approach, 2018 - 2030
- 10.2.7.3 Market estimates and forecast, by organization size, 2018 - 2030
- 10.2.7.4 Market estimates and forecast, by deployment, 2018 - 2030
- 10.2.7.5 Market estimates and forecast, by end-use, 2018 - 2030
- 10.2.7.6 Market estimates and forecast, by infrastructure, 2018 - 2030
- 10.2.7.7 Market, by infrastructure, 2018 - 2030
- 10.2.8 Canada
- 10.2.8.1 Market estimates and forecast, 2018 - 2030
- 10.2.8.2 Market estimates and forecast, by approach, 2018 - 2030
- 10.2.8.3 Market estimates and forecast, by organization size, 2018 - 2030
- 10.2.8.4 Market estimates and forecast, by deployment, 2018 - 2030
- 10.2.8.5 Market estimates and forecast, by end-use, 2018 - 2030
- 10.2.8.6 Market estimates and forecast, by infrastructure, 2018 - 2030
- 10.3 Europe
- 10.3.1 Market estimates and forecast, 2018- 2030
- 10.3.2 Market estimates and forecast, by approach, 2018- 2030
- 10.3.3 Market estimates and forecast, by organization size, 2018- 2030
- 10.3.4 Market estimates and forecast, by deployment, 2018- 2030
- 10.3.5 Market estimates and forecast, by end-use, 2018- 2030
- 10.3.6 Market estimates and forecast, by infrastructure, 2018- 2030
- 10.3.7 UK
- 10.3.7.1 Market estimates and forecast, 2018 - 2030
- 10.3.7.2 Market estimates and forecast, by approach, 2018 - 2030
- 10.3.7.3 Market estimates and forecast, by organization size, 2018 - 2030
- 10.3.7.4 Market estimates and forecast, by deployment, 2018 - 2030
- 10.3.7.5 Market estimates and forecast, by end-use, 2018 - 2030
- 10.3.7.6 Market estimates and forecast, by infrastructure, 2018 - 2030
- 10.3.8 Germany
- 10.3.8.1 Market estimates and forecast, 2018 - 2030
- 10.3.8.2 Market estimates and forecast, by approach, 2018 - 2030
- 10.3.8.3 Market estimates and forecast, by organization size, 2018 - 2030
- 10.3.8.4 Market estimates and forecast, by deployment, 2018 - 2030
- 10.3.8.5 Market estimates and forecast, by end-use, 2018 - 2030
- 10.3.8.6 Market estimates and forecast, by infrastructure, 2018 - 2030
- 10.3.9 France
- 10.3.9.1 Market estimates and forecast, 2018 - 2030
- 10.3.9.2 Market estimates and forecast, by approach, 2018 - 2030
- 10.3.9.3 Market estimates and forecast, by organization size, 2018 - 2030
- 10.3.9.4 Market estimates and forecast, by deployment, 2018 - 2030
- 10.3.9.5 Market estimates and forecast, by end-use, 2018 - 2030
- 10.3.9.6 Market estimates and forecast, by infrastructure, 2018 - 2030
- 10.3.10 Italy
- 10.3.10.1 Market estimates and forecast, 2018 - 2030
- 10.3.10.2 Market estimates and forecast, by approach, 2018 - 2030
- 10.3.10.3 Market estimates and forecast, by organization size, 2018 - 2030
- 10.3.10.4 Market estimates and forecast, by deployment, 2018 - 2030
- 10.3.10.5 Market estimates and forecast, by end-use, 2018 - 2030
- 10.3.10.6 Market estimates and forecast, by infrastructure, 2018 - 2030
- 10.3.11 Spain
- 10.3.11.1 Market estimates and forecast, 2018 - 2030
- 10.3.11.2 Market estimates and forecast, by approach, 2018 - 2030
- 10.3.11.3 Market estimates and forecast, by organization size, 2018 - 2030
- 10.3.11.4 Market estimates and forecast, by deployment, 2018 - 2030
- 10.3.11.5 Market estimates and forecast, by end-use, 2018 - 2030
- 10.3.11.6 Market estimates and forecast, by infrastructure, 2018 - 2030
- 10.3.12 Benelux
- 10.3.12.1 Market estimates and forecast, 2018 - 2030
- 10.3.12.2 Market estimates and forecast, by approach, 2018 - 2030
- 10.3.12.3 Market estimates and forecast, by organization size, 2018 - 2030
- 10.3.12.4 Market estimates and forecast, by deployment, 2018 - 2030
- 10.3.12.5 Market estimates and forecast, by end-use, 2018 - 2030
- 10.3.12.6 Market estimates and forecast, by infrastructure, 2018 - 2030
- 10.4 Asia Pacific
- 10.4.1 Market estimates and forecast, 2018- 2030
- 10.4.2 Market estimates and forecast, by approach, 2018- 2030
- 10.4.3 Market estimates and forecast, by organization size, 2018- 2030
- 10.4.4 Market estimates and forecast, by deployment, 2018- 2030
- 10.4.5 Market estimates and forecast, by end-use, 2018- 2030
- 10.4.6 Market estimates and forecast, by infrastructure, 2018- 2030
- 10.4.7 China
- 10.4.7.1 Market estimates and forecast, 2018 - 2030
- 10.4.7.2 Market estimates and forecast, by approach, 2018 - 2030
- 10.4.7.3 Market estimates and forecast, by organization size, 2018 - 2030
- 10.4.7.4 Market estimates and forecast, by deployment, 2018 - 2030
- 10.4.7.5 Market estimates and forecast, by end-use, 2018 - 2030
- 10.4.7.6 Market estimates and forecast, by infrastructure, 2018 - 2030
- 10.4.8 India
- 10.4.8.1 Market estimates and forecast, 2018 - 2030
- 10.4.8.2 Market estimates and forecast, by approach, 2018 - 2030
- 10.4.8.3 Market estimates and forecast, by organization size, 2018 - 2030
- 10.4.8.4 Market estimates and forecast, by deployment, 2018 - 2030
- 10.4.8.5 Market estimates and forecast, by end-use, 2018 - 2030
- 10.4.8.6 Market estimates and forecast, by infrastructure, 2018 - 2030
- 10.4.9 Japan
- 10.4.9.1 Market estimates and forecast, 2018 - 2030
- 10.4.9.2 Market estimates and forecast, by approach, 2018 - 2030
- 10.4.9.3 Market estimates and forecast, by organization size, 2018 - 2030
- 10.4.9.4 Market estimates and forecast, by deployment, 2018 - 2030
- 10.4.9.5 Market estimates and forecast, by end-use, 2018 - 2030
- 10.4.9.6 Market estimates and forecast, by infrastructure, 2018 - 2030
- 10.4.10 South Korea
- 10.4.10.1 Market estimates and forecast, 2018 - 2030
- 10.4.10.2 Market estimates and forecast, by approach, 2018 - 2030
- 10.4.10.3 Market estimates and forecast, by organization size, 2018 - 2030
- 10.4.10.4 Market estimates and forecast, by deployment, 2018 - 2030
- 10.4.10.5 Market estimates and forecast, by end-use, 2018 - 2030
- 10.4.10.6 Market estimates and forecast, by infrastructure, 2018 - 2030
- 10.4.11 ANZ
- 10.4.11.1 Market estimates and forecast, 2018 - 2030
- 10.4.11.2 Market estimates and forecast, by approach, 2018 - 2030
- 10.4.11.3 Market estimates and forecast, by organization size, 2018 - 2030
- 10.4.11.4 Market estimates and forecast, by deployment, 2018 - 2030
- 10.4.11.5 Market estimates and forecast, by end-use, 2018 - 2030
- 10.4.11.6 Market estimates and forecast, by infrastructure, 2018 - 2030
- 10.5 LAMEA
- 10.5.1 Market estimates and forecast, 2018- 2030
- 10.5.2 Market estimates and forecast, by approach, 2018- 2030
- 10.5.3 Market estimates and forecast, by organization size, 2018- 2030
- 10.5.4 Market estimates and forecast, by deployment, 2018- 2030
- 10.5.5 Market estimates and forecast, by end-use, 2018- 2030
- 10.5.6 Market estimates and forecast, by infrastructure, 2018- 2030
- 10.5.7 Brazil
- 10.5.7.1 Market estimates and forecast, 2018 - 2030
- 10.5.7.2 Market estimates and forecast, by approach, 2018 - 2030
- 10.5.7.3 Market estimates and forecast, by organization size, 2018 - 2030
- 10.5.7.4 Market estimates and forecast, by deployment, 2018 - 2030
- 10.5.7.5 Market estimates and forecast, by end-use, 2018 - 2030
- 10.5.7.6 Market estimates and forecast, by infrastructure, 2018 - 2030
- 10.5.8 Mexico
- 10.5.8.1 Market estimates and forecast, 2018 - 2030
- 10.5.8.2 Market estimates and forecast, by approach, 2018 - 2030
- 10.5.8.3 Market estimates and forecast, by organization size, 2018 - 2030
- 10.5.8.4 Market estimates and forecast, by deployment, 2018 - 2030
- 10.5.8.5 Market estimates and forecast, by end-use, 2018 - 2030
- 10.5.8.6 Market estimates and forecast, by infrastructure, 2018 - 2030
- 10.5.9 UAE
- 10.5.9.1 Market estimates and forecast, 2018 - 2030
- 10.5.9.2 Market estimates and forecast, by approach, 2018 - 2030
- 10.5.9.3 Market estimates and forecast, by organization size, 2018 - 2030
- 10.5.9.4 Market estimates and forecast, by deployment, 2018 - 2030
- 10.5.9.5 Market estimates and forecast, by end-use, 2018 - 2030
- 10.5.9.6 Market estimates and forecast, by infrastructure, 2018 - 2030
- 10.5.10 Israel
- 10.5.10.1 Market estimates and forecast, 2018 - 2030
- 10.5.10.2 Market estimates and forecast, by approach, 2018 - 2030
- 10.5.10.3 Market estimates and forecast, by organization size, 2018 - 2030
- 10.5.10.4 Market estimates and forecast, by deployment, 2018 - 2030
- 10.5.10.5 Market estimates and forecast, by end-use, 2018 - 2030
- 10.5.10.6 Market estimates and forecast, by infrastructure, 2018 - 2030
- 10.5.11 South Africa
- 10.5.11.1 Market estimates and forecast, 2018 - 2030
- 10.5.11.2 Market estimates and forecast, by approach, 2018 - 2030
- 10.5.11.3 Market estimates and forecast, by organization size, 2018 - 2030
- 10.5.11.4 Market estimates and forecast, by deployment, 2018 - 2030
- 10.5.11.5 Market estimates and forecast, by end-use, 2018 - 2030
- 10.5.11.6 Market estimates and forecast, by infrastructure, 2018 - 2030
Chapter 11 Company Profiles
- 11.1 Alpacked LLC
- 11.1.1 Business Overview
- 11.1.2 Financial Data
- 11.1.3 Product Landscape
- 11.1.4 Strategic Outlook
- 11.1.5 SWOT Analysis
- 11.2 Amazon.com, Inc.
- 11.2.1 Business Overview
- 11.2.2 Financial Data
- 11.2.3 Product Landscape
- 11.2.4 Strategic Outlook
- 11.2.5 SWOT Analysis
- 11.3 Dell Inc.
- 11.3.1 Business Overview
- 11.3.2 Financial Data
- 11.3.3 Product Landscape
- 11.3.4 Strategic Outlook
- 11.3.5 SWOT Analysis
- 11.4 Google LLC
- 11.4.1 Business Overview
- 11.4.2 Financial Data
- 11.4.3 Product Landscape
- 11.4.4 Strategic Outlook
- 11.4.5 SWOT Analysis
- 11.5 HashiCorp, Inc.
- 11.5.1 Business Overview
- 11.5.2 Financial Data
- 11.5.3 Product Landscape
- 11.5.4 Strategic Outlook
- 11.5.5 SWOT Analysis
- 11.6 Hewlett Packard Enterprise Development LP
- 11.6.1 Business Overview
- 11.6.2 Financial Data
- 11.6.3 Product Landscape
- 11.6.4 Strategic Outlook
- 11.6.5 SWOT Analysis
- 11.7 IBM Corporation
- 11.7.1 Business Overview
- 11.7.2 Financial Data
- 11.7.3 Product Landscape
- 11.7.4 Strategic Outlook
- 11.7.5 SWOT Analysis
- 11.8 Microsoft Corporation
- 11.8.1 Business Overview
- 11.8.2 Financial Data
- 11.8.3 Product Landscape
- 11.8.4 Strategic Outlook
- 11.8.5 SWOT Analysis
- 11.9 Oracle Corporation
- 11.9.1 Business Overview
- 11.9.2 Financial Data
- 11.9.3 Product Landscape
- 11.9.4 Strategic Outlook
- 11.9.5 SWOT Analysis
- 11.10 Progress Software Corporation
- 11.10.1 Business Overview
- 11.10.2 Financial Data
- 11.10.3 Product Landscape
- 11.10.4 Strategic Outlook
- 11.10.5 SWOT Analysis
- 11.11 Pulumi
- 11.11.1 Business Overview
- 11.11.2 Financial Data
- 11.11.3 Product Landscape
- 11.11.4 Strategic Outlook
- 11.11.5 SWOT Analysis
- 11.12 Puppet
- 11.12.1 Business Overview
- 11.12.2 Financial Data
- 11.12.3 Product Landscape
- 11.12.4 Strategic Outlook
- 11.12.5 SWOT Analysis