
天然キレート剤市場のビジネスチャンス、成長要因、業界動向分析、および2026年~2035年の予測
Natural Chelating Agents Market Opportunity, Growth Drivers, Industry Trend Analysis, and Forecast 2026 - 2035- 発行日
- ページ情報
- 英文 190 Pages
- 納期
- 2~3営業日
- 商品コード
- 2038773
- カスタマイズ可能 お客様のご希望に応じて、既存データの加工や未掲載情報(例:国別セグメント)の追加などの対応が可能です。詳細はお問い合わせください。
- 翻訳ツール提供対象 PDF対応AI翻訳ツールの無料貸し出しサービスのご利用が可能です
世界の天然キレート剤市場は、2025年に31億米ドルと評価され、CAGR 5.9%で成長し、2035年までに55億米ドルに達すると予測されています。
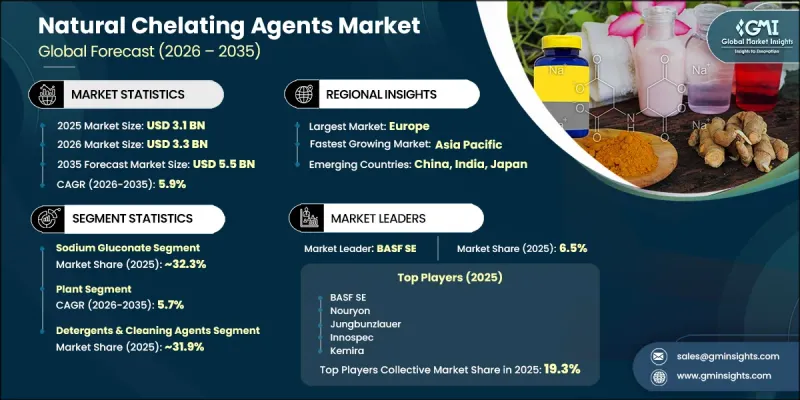
この市場は、多岐にわたる産業において、持続可能でバイオ由来、かつ環境に優しい化学ソリューションへの移行が進んでいることから、勢いを増しています。天然キレート剤は再生可能な資源に由来し、金属イオンと結合して、その安定化、除去、または中和を可能にするように設計されています。これらの化合物は、農業、水処理、パーソナルケア製品、および工業用洗浄用途で広く使用されています。その主な機能は、スケール、腐食、および毒性に関連する問題の原因となるカルシウム、マグネシウム、鉄、その他の重金属と結合することです。環境意識の高まりや、合成キレート剤に対する規制の強化により、天然由来の代替品の採用が加速しています。生分解性が高く、毒性が低いという特性から、従来の合成製品に比べて好まれる選択肢となっています。さらに、洗浄効率の向上、土壌の質の改善、効果的な水質浄化への寄与といった能力が、需要をさらに後押ししています。また、世界中の最終用途セクターにおいて、環境に優しい成分や持続可能な産業慣行に対する消費者の嗜好が高まっていることも、市場を後押ししています。
| 市場範囲 | |
|---|---|
| 開始年 | 2025年 |
| 予測期間 | 2026年~2035年 |
| 開始時の市場規模 | 31億米ドル |
| 予測額 | 55億米ドル |
| CAGR | 5.9% |
グルコン酸ナトリウムセグメントは2025年に32.3%のシェアを占め、2035年までCAGR5%で成長すると予想されています。このセグメントは、コスト効率の良さ、安定した性能、そして大規模な産業用途への適性により、広く採用され続けています。アルカリ性環境との高い相溶性と信頼性の高いキレート特性が、様々な最終用途産業における使用を支え続けています。
植物由来セグメントは2025年に43.1%のシェアを占め、2035年までCAGR5.7%で成長すると予測されています。このセグメントは、確立された農業調達システムと比較的低い生産コストという利点があり、広く利用されている生産ルートとなっています。しかし、原料の入手状況の変動や、他のバイオマス用途との競合の影響を受けます。それにもかかわらず、植物由来のソリューションは、その持続可能性という利点により、市場拡大の主要な要因であり続けています。
北米の天然キレート剤市場は、2025年に27%のシェアを占めました。同地域の成長は、環境に優しい洗浄剤やパーソナルケア製品への需要の高まりによって牽引されています。環境意識の高まりや合成化学物質の使用に関する規制の強化も、市場の普及をさらに後押ししています。食品加工や水処理産業における用途の拡大も、同地域における着実な成長に寄与しています。
よくあるご質問
目次
第1章 調査手法と範囲
第2章 エグゼクティブサマリー
第3章 業界考察
- エコシステム分析
- サプライヤーの情勢
- 利益率
- 各段階における付加価値
- バリューチェーンに影響を与える要因
- ディスラプション
- 業界への影響要因
- 促進要因
- 業界の潜在的リスク&課題
- 市場機会
- 成長可能性分析
- 規制情勢
- ポーター分析
- PESTEL分析
- 価格動向
- 地域別
- タイプ別
- 将来の市場動向
- 技術およびイノベーションの動向
- 現在の技術動向
- 新興技術
- 特許動向
- 貿易統計(HSコード)
- 主要輸入国
- 主要輸出国
- 持続可能性と環境面
- 持続可能な取り組み
- 廃棄物削減戦略
- 生産におけるエネルギー効率
- 環境に配慮した取り組み
- カーボンフットプリントへの配慮
第4章 競合情勢
- イントロダクション
- 企業の市場シェア分析
- 地域別
- 北米
- 欧州
- アジア太平洋地域
- ラテンアメリカ
- 中東・アフリカ(MEA)
- 地域別
- 企業マトリックス分析
- 主要市場企業の競合分析
- 競合ポジショニングマトリックス
- 主な発展
- 合併・買収
- 提携・協業
- 新製品の発売
- 事業拡大計画
第5章 市場推計・予測:製品別、2022-2035
- グルコン酸ナトリウム
- エチレンジアミンジサクシネート(EDDS)
- グルタミン酸ジアセテート(GLDA)
- イミノジコハク酸(IDSA)
- メチルグリシンジアセテート(MGDA)
- その他(N-ジアセテート四ナトリウム塩(ASDA)、グルコヘプトネート)
第6章 市場推計・予測:ソース別、2022-2035
- 植物
- 微生物発酵
- バイオ由来原料からの化学合成
第7章 市場推計・予測:用途別、2022-2035
- 洗剤・洗浄剤
- パーソナルケア・化粧品
- パルプ・紙
- 農業用化学品
- 食品・飲料
- 水処理
- その他(写真、医薬品、セメント、治療薬)
第8章 市場推計・予測:地域別、2022-2035
- 北米
- 米国
- カナダ
- 欧州
- ドイツ
- 英国
- フランス
- スペイン
- イタリア
- その他欧州地域
- アジア太平洋地域
- 中国
- インド
- 日本
- オーストラリア
- 韓国
- その他アジア太平洋地域
- ラテンアメリカ
- ブラジル
- メキシコ
- アルゼンチン
- その他ラテンアメリカ地域
- 中東・アフリカ
- サウジアラビア
- 南アフリカ
- アラブ首長国連邦
- その他中東・アフリカ地域
第9章 企業プロファイル
- BASF SE
- Corbion
- Innospec
- Itaconix Corporation
- Jungbunzlauer
- Kemira
- Lanxess
- Nippon Shokubai
- Nouryon
- PMP Fermentation Products
- Roquette Freres
- Shandong Fuyang Biotech
- Yuanlian Chemical
- 発行日
- 発行
- Global Market Insights Inc.
- ページ情報
- 英文 190 Pages
- 納期
- 2~3営業日