
電動車椅子の市場機会、成長促進要因、産業動向分析、2025~2034年予測
Powered Wheelchair Market Opportunity, Growth Drivers, Industry Trend Analysis, and Forecast 2025 - 2034- 発行日
- ページ情報
- 英文 165 Pages
- 納期
- 2~3営業日
- 商品コード
- 1844380
- カスタマイズ可能 お客様のご希望に応じて、既存データの加工や未掲載情報(例:国別セグメント)の追加などの対応が可能です。詳細はお問い合わせください。
- 翻訳ツール提供対象 PDF対応AI翻訳ツールの無料貸し出しサービスのご利用が可能です
電動車椅子の世界市場規模は、2024年に31億米ドルとなり、CAGR 5.3%で成長し、2034年には53億米ドルに達すると予測されています。
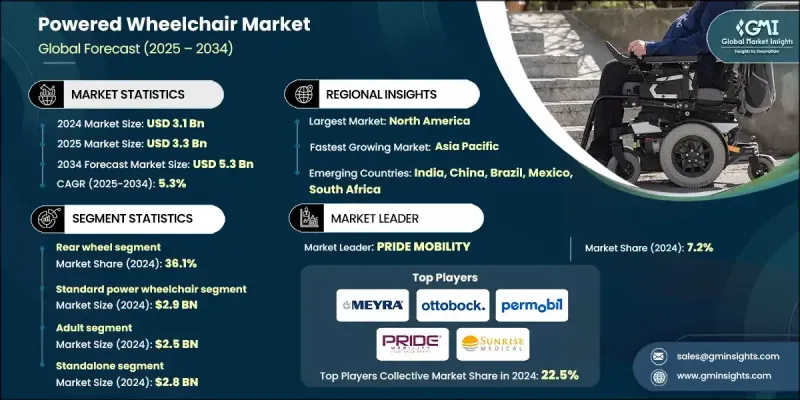
成長の背景には、移動制限の増加、高齢者人口の拡大、在宅ヘルスケアソリューションへの注目の高まりがあります。インテリジェント制御、環境に配慮した設計、軽量の携帯性など、移動器具の技術進歩も市場全体の拡大を支えています。電動モーターとバッテリーシステムで動作する電動車椅子は、使いやすさ、より大きな自律性、ユーザーの快適性と生活の質を向上させる能力により、採用が増加しています。センサー・ナビゲーションとIoT接続を備えたスマートなAI統合システムへのシフトが進み、特に安全で直感的な移動を求める患者にとって、車椅子の性能が再定義されつつあります。メーカー各社は、高齢のユーザーや、アクティブで移動が中心の日常生活を送る人々のライフスタイルに対応した、折りたたみ可能でコンパクトなモデルを開発するため、急速に技術革新を進めています。このような設計のアップグレードは、屋内外を問わず、個人に合わせた効率的な移動支援を求める人々の間で、より広範な採用を促しています。ヘルスケア・システムが世界的に患者中心のケアに移行するにつれて、電動車椅子はリハビリテーション、長期介護、外来患者向けの用途で不可欠なソリューションになりつつあります。
| 市場範囲 | |
|---|---|
| 開始年 | 2024 |
| 予測年 | 2025-2034 |
| 市場規模 | 31億米ドル |
| 予測金額 | 53億米ドル |
| CAGR | 5.3% |
中輪電動車椅子セグメントは、2024年に7億4,130万米ドルを生み出し、2034年までCAGR 5.7%で成長すると予測されます。このセグメントは、ユーザーがより優れたコントロール性、スムーズな操縦性、均等な重量配分を提供する機器を求めるにつれて勢いを増しています。6輪構造と重心バランスで知られる中輪モデルは、さまざまな路面での安全性と性能を高める。また、医療施設やリハビリテーション施設への導入が進んでいることも、移動能力の回復が必要な患者への適合性を高めています。全地形での使いやすさと屋内外での性能向上への関心の高まりは、複数のエンドユーザーグループでこのセグメントの採用を後押しし続けています。
標準的な電動車椅子分野は、2024年に29億米ドルを生み出し、2034年までCAGR 5.2%で成長すると予想されています。これらのモデルは、手頃な価格で信頼性が高く、広く入手可能であるため、患者やヘルスケアプロバイダーに好まれる選択肢であり続けています。中程度の可動性に問題がある人によく処方され、病院、治療センター、長期介護施設に頻繁に在庫されています。ほとんどの患者のニーズに適合し、安定した機能性と相まって、様々な介護環境において頼りになる選択肢となっています。
米国の電動車椅子市場は2024年に9億8,240万米ドルに達し、2025年から2034年にかけてCAGR 4.7%で成長すると予測されています。米国は、新たな車いす技術の早期導入、先進的な製品イノベーション、高齢化からくる需要の高まりにより、リーダーシップを維持しています。神経障害や筋骨格系障害の増加により、遠隔アクセスツール、ナビゲーションセンサー、リアルタイムモニタリング機能を備えたインテリジェントモビリティデバイスのニーズが高まっています。この旺盛な需要は、成熟したヘルスケア・インフラと同地域の有利な保険適用によって支えられています。
世界の電動車椅子市場に積極的に貢献している主な企業は、SHOPRIDER、MEYRA、Drive DeVilbiss Healthcare、GOLDEN、Frido、COMFYGO mobility、OSTRICH、Airwheel、Decon、INVACARE、KARMAN、Permobil、SUNRISE MEDICAL、Callidai、PRIDE MOBILITY、LEVO、Ottobock、Merits Health Products、Hoveround Mobility Solutions、Journey Health &Lifestyleなどです。電動車椅子市場の各社は、ユーザー中心の設計を強化し、AIベースのモビリティシステムなどの先進技術を統合し、多様なモビリティ要件に対応する製品ラインを拡大することに注力しています。メーカーはまた、増加するアクティブユーザーや旅行者層にアピールするため、軽量素材や折りたたみ可能なデザインに投資しています。市場へのリーチを強化するため、プレーヤーはリハビリセンター、病院、販売業者と戦略的提携を結んでいます。
目次
第1章 調査手法と範囲
第2章 エグゼクティブサマリー
第3章 業界考察
- エコシステム分析
- 業界への影響要因
- 促進要因
- 障害の有病率の増加
- 高齢者人口の割合の増加
- 神経疾患の有病率の増加
- 車椅子業界における技術の進歩
- 業界の潜在的リスク&課題
- スマート車椅子の高コスト
- スマート車椅子製品の数が少ない
- 市場機会
- スマートでコネクテッドな車椅子の普及が進む
- 小児およびカスタマイズされたモビリティソリューションの需要の増加
- 促進要因
- 成長可能性分析
- 規制情勢
- 北米
- 欧州
- アジア太平洋地域
- 技術的情勢
- 現在の技術
- 新興技術
- 将来の市場動向
- 払い戻しシナリオ
- ブランド分析
- 起動シナリオ
- パイプライン分析
- 投資情勢
- 価格分析、2024
- ポーターの分析
- PESTEL分析
- ギャップ分析
第4章 競合情勢
- イントロダクション
- 企業マトリックス分析
- 企業の市場シェア分析
- 北米
- 欧州
- アジア太平洋地域
- ラテンアメリカ・中東・アフリカ
- 主要市場企業の競合分析
- 競合ポジショニングマトリックス
- 主な発展
- 合併と買収
- パートナーシップとコラボレーション
- 新製品の発売
- 拡張計画
第5章 市場推計・予測:製品別、2021-2034
- 主要動向
- 前輪
- ミッドホイール
- 後輪
- その他の製品
第6章 市場推計・予測:技術別、2021-2034
- 主要動向
- 標準電動車椅子
- スマート車椅子
第7章 市場推計・予測:患者別、2021-2034
- 主要動向
- 成人用
- 小児
第8章 市場推計・予測:ポータビリティ別、2021-2034
- 主要動向
- スタンドアロン
- ポータブル
第9章 市場推計・予測:用途別、2021-2034
- 主要動向
- モビリティ
- 神経疾患
第10章 市場推計・予測:流通チャネル別、2021-2034
- 主要動向
- 店舗
- eコマース
第11章 市場推計・予測:最終用途別、2021-2034
- 主要動向
- 病院
- ホームケア
- 長期介護施設
- リハビリセンター
第12章 市場推計・予測:地域別、2021-2034
- 主要動向
- 北米
- 米国
- カナダ
- 欧州
- ドイツ
- 英国
- フランス
- スペイン
- イタリア
- オランダ
- アジア太平洋地域
- 中国
- 日本
- インド
- オーストラリア
- 韓国
- ラテンアメリカ
- ブラジル
- メキシコ
- アルゼンチン
- 中東・アフリカ
- 南アフリカ
- サウジアラビア
- アラブ首長国連邦
第13章 企業プロファイル
- Airwheel
- Callidai
- COMFYGO mobility
- Decon
- Drive DeVilbiss Healthcare
- Frido
- GOLDEN
- Hoveround Mobility Solutions
- INVACARE
- Journey Health &Lifestyle
- KARMAN
- LEVO
- Merits Health Products
- MEYRA
- OSTRICH
- Ottobock
- Permobil
- PRIDE MOBILITY
- SHOPRIDER
- SUNRISE MEDICAL
- 発行日
- 発行
- Global Market Insights Inc.
- ページ情報
- 英文 165 Pages
- 納期
- 2~3営業日


