|
|
市場調査レポート
商品コード
1801919
スイッチギヤ市場の機会、成長促進要因、産業動向分析、2025年~2034年の予測Switchgear Market Opportunity, Growth Drivers, Industry Trend Analysis, and Forecast 2025 - 2034 |
||||||

|
|||||||
カスタマイズ可能
|
|||||||

| スイッチギヤ市場の機会、成長促進要因、産業動向分析、2025年~2034年の予測 |
|
出版日: 2025年08月14日
発行: Global Market Insights Inc.
ページ情報: 英文 150 Pages
納期: 2~3営業日
|

全表示
- 概要
- 目次
スイッチギヤの世界市場規模は、2024年に1,563億米ドルとなり、CAGR 7.3%で成長し、2034年には3,175億米ドルに達すると予測されています。
この市場拡大は、新興経済諸国と成熟経済諸国の両方が多数の発電・配電イニシアチブを進めている、世界中のエネルギーインフラ全体の継続的な開発によって促進されています。電気機器の需要はほぼすべての産業分野で高まっており、スイッチギヤは現代のインフラに不可欠なコンポーネントとして位置づけられています。デジタル技術やオートメーションへの依存が高まるにつれ、信頼性が高く効率的なスイッチギヤへのニーズはますます高まっています。エネルギーの信頼性を向上させ、拡大するグリッドネットワークをサポートすることが重視されるようになり、先進的なスイッチギヤシステムの採用がさらに促進されると予想されます。
技術革新と研究開発が電力システムの未来を形作る中、スイッチギヤ技術は急速な変貌を遂げています。新しい送電線や送電網の近代化への投資により、リアルタイムのデータモニタリング、リモートアクセス、予知保全が可能なインテリジェントなスイッチギヤへの需要が高まっています。IoT機能と統合されたデジタルスイッチギヤの進化は業界に革命をもたらし、より優れたシステム制御を可能にし、運転休止時間を大幅に短縮します。この動向は、より高い効率性、安全性、合理的な運用を目指すエネルギー企業、商業施設、製造工場から注目を集めています。
| 市場範囲 | |
|---|---|
| 開始年 | 2024 |
| 予測年 | 2025-2034 |
| 開始金額 | 1,563億米ドル |
| 予測金額 | 3,175億米ドル |
| CAGR | 7.3% |
中電圧カテゴリーは2024年に33.8%のシェアを占め、様々なセクターでユーティリティ規模の開発が進むにつれて成長を続けています。開発中のエネルギーおよびインフラ・プロジェクトは数多く、スイッチギヤとそれを支える電気システムの両方に対する広範な需要を生み出します。中電圧スイッチギヤの用途が拡大しているのは、製造拠点や再生可能エネルギー設備で顕著です。
ガス絶縁スイッチギヤ分野は、2034年までCAGR 7%で成長すると予想されています。ガスベースの技術に対する技術革新と世界の需要の増加に後押しされ、ガス絶縁システムは、そのコンパクトな設計、耐久性、重要な用途における効率的な電力処理で支持を集めています。これらのシステムは、人口密集地や限られたスペースの環境でも信頼できる性能を発揮するため、産業用にも都市用にも理想的です。
米国のスイッチギヤ市場は、2034年までに310億米ドルに達すると予測されています。グリッドインフラのアップグレードや高度な配電機器の採用により、最先端のスイッチギヤソリューションへのニーズが高まっています。
主要なスイッチギヤメーカーは、エネルギー・プロバイダーやインフラ企業との的を絞ったM&Aや長期的な戦略的提携を通じて、世界・リーチを強化しています。このようなパートナーシップにより、大規模送電・配電プロジェクト向けのソリューションのカスタマイズが可能になります。IoT、リアルタイム診断、自動化を統合したスマートスイッチギヤの開発には、多額の研究開発投資が行われています。
目次
第1章 調査手法と範囲
第2章 エグゼクティブサマリー
第3章 業界考察
- エコシステム分析
- 規制情勢
- 輸出入貿易分析
- 地域別価格動向分析(米ドル/単位)
- 業界への影響要因
- 促進要因
- 業界の潜在的リスク&課題
- 成長可能性分析
- ポーターの分析
- 供給企業の交渉力
- 買い手の交渉力
- 新規参入業者の脅威
- 代替品の脅威
- PESTEL分析
- 新たな機会と動向
- デジタル化とIoTの統合
- 新興市場への浸透
- 投資分析と将来展望
第4章 競合情勢
- イントロダクション
- 企業の市場シェア分析:地域別
- 北米
- 欧州
- アジア太平洋地域
- 中東・アフリカ
- ラテンアメリカ
- 戦略的取り組み
- 競合ベンチマーキングの描写
- 戦略ダッシュボード
- イノベーションとテクノロジーの情勢
第5章 市場規模・予測:電圧別、2021年~2034年
- 主要動向
- 低
- 中
- 高
第6章 市場規模・予測:断熱材別、2021年~2034年
- 主要動向
- 空気
- ガス
- その他
第7章 市場規模・予測:電流別、2021年~2034年
- 主要動向
- AC
- DC
第8章 市場規模・予測:用途別、2021年~2034年
- 主要動向
- 住宅
- 商業および工業
- ユーティリティ
第9章 市場規模・予測:地域別、2021年~2034年
- 主要動向
- 北米
- 米国
- カナダ
- メキシコ
- 欧州
- 英国
- フランス
- ドイツ
- イタリア
- ロシア
- スペイン
- アジア太平洋地域
- 中国
- オーストラリア
- インド
- 日本
- 韓国
- 中東・アフリカ
- サウジアラビア
- アラブ首長国連邦
- トルコ
- 南アフリカ
- エジプト
- ラテンアメリカ
- ブラジル
- アルゼンチン
第10章 企業プロファイル
- ABB
- Bharat Heavy Electricals
- CG Power and Industrial Solutions
- Chint Group
- Eaton
- Fuji Electric
- General Electric
- HD Hyundai Electric
- Hitachi Energy
- Hyosung Heavy Industries
- Larsen &Toubro Limited
- Lucy Group
- Legrand
- Mitsubishi Electric
- Orecco Electric
- Ormazabal
- Panasonic
- Powell Industries
- Schneider Electric
- SGC
- Siemens
- Toshiba
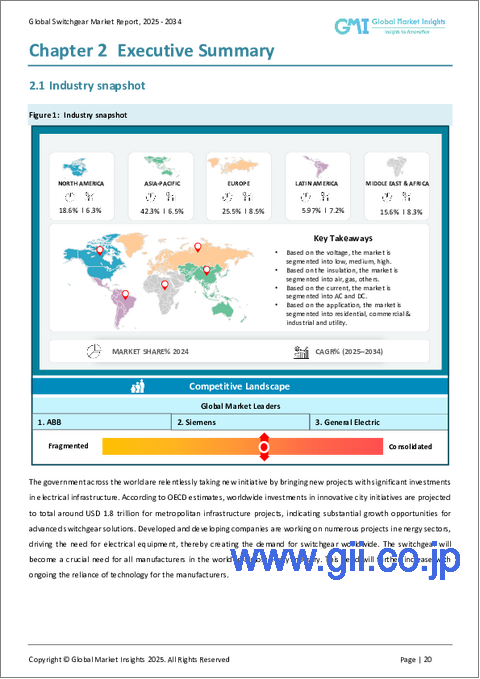
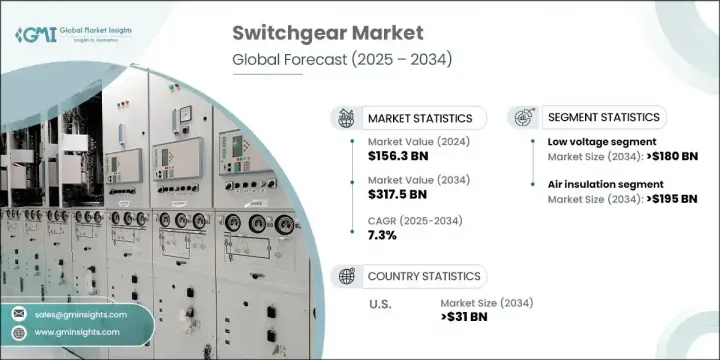
The Global Switchgear Market was valued at USD 156.3 billion in 2024 and is estimated to grow at a CAGR of 7.3% to reach USD 317.5 billion by 2034. This expansion is being fueled by continuous developments across energy infrastructure worldwide, where both emerging and mature economies are advancing numerous power generation and distribution initiatives. The demand for electrical equipment is rising in nearly every industrial vertical, positioning switchgear as an essential component in modern infrastructure. As industries become increasingly reliant on digital technologies and automation, the need for reliable and efficient switchgear continues to accelerate. The growing emphasis on improving energy reliability and supporting expanding grid networks is expected to further drive the adoption of advanced switchgear systems.
With innovation and R&D shaping the future of power systems, switchgear technologies are undergoing rapid transformation. Investment in new power transmission lines and grid modernization is intensifying the demand for intelligent switchgear capable of real-time data monitoring, remote access, and predictive maintenance. The evolution of digital switchgear integrated with IoT capabilities is revolutionizing the industry, enabling better system control and significantly minimizing operational downtimes. This trend is attracting attention from energy companies, commercial establishments, and manufacturing plants aiming for greater efficiency, safety, and streamlined operations.
| Market Scope | |
|---|---|
| Start Year | 2024 |
| Forecast Year | 2025-2034 |
| Start Value | $156.3 Billion |
| Forecast Value | $317.5 Billion |
| CAGR | 7.3% |
The medium voltage category accounted for a 33.8% share in 2024 and continues to grow as more utility-scale developments emerge across various sectors. Numerous energy and infrastructure projects in development will create widespread demand for both switchgear and supporting electrical systems. The increasing application of medium voltage switchgear is notably prominent in manufacturing hubs and renewable energy installations.
The gas-insulated switchgear segment is expected to grow at a CAGR of 7% through 2034. Driven by innovation and increased global demand for gas-based technologies, gas-insulated systems are gaining favor for their compact design, durability, and efficient power handling in critical applications. These systems offer dependable performance in densely populated or limited-space environments, making them ideal for both industrial and urban setups.
U.S. Switchgear Market is anticipated to reach USD 31 billion by 2034, propelled by the country's focus on modernizing electrical networks and enhancing operational energy management. Upgrades in grid infrastructure and adoption of advanced distribution equipment are reinforcing the need for cutting-edge switchgear solutions.
Key companies actively operating in the Global Switchgear Market include Hitachi Energy, Toshiba, Mitsubishi Electric, Fuji Electric, Schneider Electric, Eaton, Bharat Heavy Electricals, HD Hyundai Electric, ABB, General Electric, Siemens, Powell Industries, Legrand, Lucy Group, Ormazabal, Panasonic, Chint Group, Larsen & Toubro Limited, CG Power and Industrial Solutions, SGC, Hyosung Heavy Industries, and Orecco Electric. Leading switchgear manufacturers are enhancing their global reach through targeted mergers, acquisitions, and long-term strategic alliances with energy providers and infrastructure firms. These partnerships enable them to tailor solutions for large-scale transmission and distribution projects. Significant R&D investment is focused on developing smart switchgear integrated with IoT, real-time diagnostics, and automation.
Table of Contents
Chapter 1 Methodology & Scope
- 1.1 Research design
- 1.2 Market estimates & forecast parameters
- 1.3 Forecast calculation
- 1.4 Data sources
- 1.4.1 Primary
- 1.4.2 Secondary
- 1.4.2.1 Paid
- 1.4.2.2 Public
Chapter 2 Executive Summary
- 2.1 Industry synopsis, 2021 - 2034
Chapter 3 Industry Insights
- 3.1 Industry ecosystem analysis
- 3.2 Regulatory landscape
- 3.3 Import/Export trade analysis
- 3.4 Price trend analysis, by region (USD/Unit)
- 3.5 Industry impact forces
- 3.5.1 Growth drivers
- 3.5.2 Industry pitfalls & challenges
- 3.6 Growth potential analysis
- 3.7 Porter's analysis
- 3.7.1 Bargaining power of suppliers
- 3.7.2 Bargaining power of buyers
- 3.7.3 Threat of new entrants
- 3.7.4 Threat of substitutes
- 3.8 PESTEL analysis
- 3.8.1 Political factors
- 3.8.2 Economic factors
- 3.8.3 Social factors
- 3.8.4 Technological factors
- 3.8.5 Legal factors
- 3.8.6 Environmental factors
- 3.9 Emerging opportunities & trends
- 3.9.1 Digitalization & IoT integration
- 3.9.2 Emerging market penetration
- 3.10 Investment analysis & future outlook
Chapter 4 Competitive Landscape, 2025
- 4.1 Introduction
- 4.2 Company market share analysis, by region, 2024
- 4.2.1 North America
- 4.2.2 Europe
- 4.2.3 Asia Pacific
- 4.2.4 Middle East & Africa
- 4.2.5 Latin America
- 4.3 Strategic initiatives
- 4.4 Competitive benchmarking depictions
- 4.5 Strategy dashboard
- 4.6 Innovation & technology landscape
Chapter 5 Market Size and Forecast, By Voltage, 2021 - 2034 (USD Million & '000 Units)
- 5.1 Key trends
- 5.2 Low
- 5.3 Medium
- 5.4 High
Chapter 6 Market Size and Forecast, By Insulation, 2021 - 2034 (USD Million & '000 Units)
- 6.1 Key trends
- 6.2 Air
- 6.3 Gas
- 6.4 Others
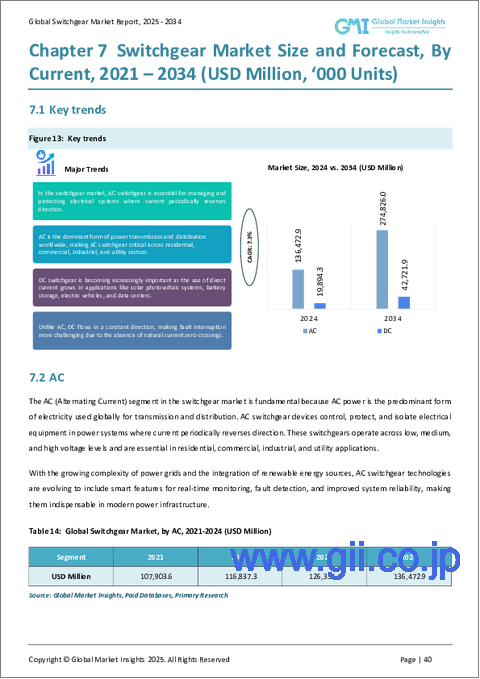
Chapter 7 Market Size and Forecast, By Current, 2021 - 2034 (USD Million & '000 Units)
- 7.1 Key trends
- 7.2 AC
- 7.3 DC
Chapter 8 Market Size and Forecast, By Application, 2021 - 2034 (USD Million & '000 Units)
- 8.1 Key trends
- 8.2 Residential
- 8.3 Commercial & Industrial
- 8.4 Utility
Chapter 9 Market Size and Forecast, By Region, 2021 - 2034 (USD Million & '000 Units)
- 9.1 Key trends
- 9.2 North America
- 9.2.1 U.S.
- 9.2.2 Canada
- 9.2.3 Mexico
- 9.3 Europe
- 9.3.1 UK
- 9.3.2 France
- 9.3.3 Germany
- 9.3.4 Italy
- 9.3.5 Russia
- 9.3.6 Spain
- 9.4 Asia Pacific
- 9.4.1 China
- 9.4.2 Australia
- 9.4.3 India
- 9.4.4 Japan
- 9.4.5 South Korea
- 9.5 Middle East & Africa
- 9.5.1 Saudi Arabia
- 9.5.2 UAE
- 9.5.3 Turkey
- 9.5.4 South Africa
- 9.5.5 Egypt
- 9.6 Latin America
- 9.6.1 Brazil
- 9.6.2 Argentina
Chapter 10 Company Profiles
- 10.1 ABB
- 10.2 Bharat Heavy Electricals
- 10.3 CG Power and Industrial Solutions
- 10.4 Chint Group
- 10.5 Eaton
- 10.6 Fuji Electric
- 10.7 General Electric
- 10.8 HD Hyundai Electric
- 10.9 Hitachi Energy
- 10.10 Hyosung Heavy Industries
- 10.11 Larsen & Toubro Limited
- 10.12 Lucy Group
- 10.13 Legrand
- 10.14 Mitsubishi Electric
- 10.15 Orecco Electric
- 10.16 Ormazabal
- 10.17 Panasonic
- 10.18 Powell Industries
- 10.19 Schneider Electric
- 10.20 SGC
- 10.21 Siemens
- 10.22 Toshiba

