
|
市場調査レポート
商品コード
1892836
ペット保険市場の機会、成長要因、業界動向分析、および2026年から2035年までの予測Pet Insurance Market Opportunity, Growth Drivers, Industry Trend Analysis, and Forecast 2026 - 2035 |
||||||
カスタマイズ可能
|
|||||||
| ペット保険市場の機会、成長要因、業界動向分析、および2026年から2035年までの予測 |
|
出版日: 2025年12月15日
発行: Global Market Insights Inc.
ページ情報: 英文 135 Pages
納期: 2~3営業日
|

概要
世界のペット保険市場は、2025年に142億米ドルと評価され、2035年までにCAGR12.8%で成長し、468億米ドルに達すると予測されています。
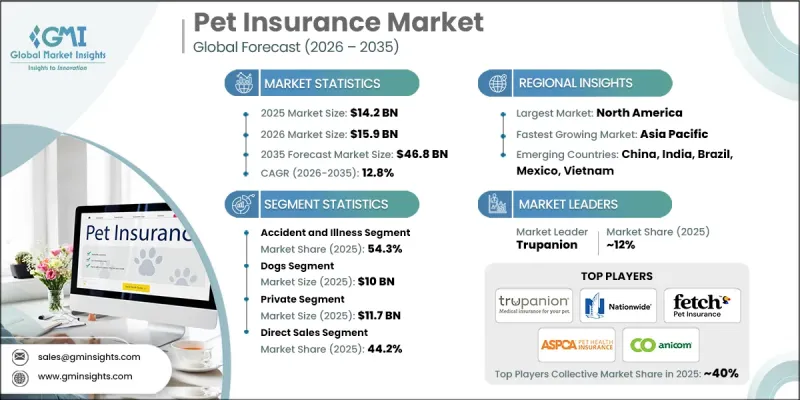
市場拡大の背景には、世界のペット飼育世帯数の増加、獣医療費高騰への意識向上、ペットの人間化動向の継続といった要因が挙げられます。これらの要因により、飼い主様は予期せぬ医療費に対する経済的保護を求めるようになり、ペット保険の導入が促進されています。ペット保険は、疾病・事故・手術・予防医療を含む獣医療費を補償し、飼い主様の費用負担軽減とペットのより良い医療環境の確保に貢献します。獣医療費の上昇が続く中、カスタマイズ可能なプランへの消費者需要が高まるにつれ、保険会社はウェルネス追加オプション、遠隔医療サービス、柔軟な償還オプションなど、提供内容の革新を進めています。Trupanion、Nationwide、Petplanなどの主要保険会社は、デジタルプラットフォームの拡大、流通ネットワークの強化、顧客エンゲージメントの向上において重要な役割を担い、この進化する市場における持続的な成長を支えています。
| 市場範囲 | |
|---|---|
| 開始年 | 2025年 |
| 予測年度 | 2026-2035 |
| 開始時価値 | 142億米ドル |
| 予測金額 | 468億米ドル |
| CAGR | 12.8% |
基本的なウェルネスケア分野は、2026年から2035年にかけてCAGR 13.1%で成長すると予測されています。この成長は、予防接種、定期健診、歯科治療などの予防サービスに対する需要の高まりに支えられており、ペットの健康管理を積極的に行う動向や費用対効果の高い定期的なケアの需要増加と一致しています。
犬セグメントは2025年に100億米ドルの市場規模を記録し、2026年から2035年にかけてCAGR 12.7%で成長すると予測されています。犬市場が優位にある背景には、世界的に犬の数が多いこと、そして犬の健康に対する文化的重視が挙げられます。犬は生活習慣病や関節・心臓・体重関連の問題など遺伝性疾患にかかりやすく、これが長期的なケア費用の増加につながり、保険加入を促進しています。
北米ペット保険市場は2025年に39.6%のシェアを占めました。同地域はペット飼育率の高さ、ペット医療への意識向上、包括的保険プランの普及が追い風となっています。米国やカナダなどの国々では、獣医療費の高騰とペットを家族の一員として扱う文化的傾向により、保険の浸透率が顕著です。同地域のデジタルファースト保険会社と確立された流通ネットワークが、さらなる市場成長を支えています。
よくあるご質問
目次
第1章 調査手法と範囲
第2章 エグゼクティブサマリー
第3章 業界考察
- エコシステム分析
- 業界への影響要因
- 促進要因
- 世界のペット飼育率の上昇
- 増加する獣医療費
- ペットの人間化が進む動向
- ペット保険に対する認知度の向上
- 業界の潜在的リスク&課題
- 高額な保険料と限定的な補償内容
- 保険金支払いのための標準化されたペット健康コードの不足
- 市場機会
- 遠隔医療とウェルネス付加サービスの統合
- 新興市場への進出
- 促進要因
- 成長可能性分析
- 技術動向
- 現在の技術動向
- 新興技術
- 規制情勢
- 北米
- 欧州
- アジア太平洋地域
- ペット飼育数統計
- 国別犬飼育数
- 国別猫の飼育頭数
- 上位10社の保険会社における価格分析(動物別)
- 猫
- 上位10社の保険会社における猫向け保険料分析
- 人気の猫種別費用
- 犬
- 主要10社の保険料分析(犬種別)人気犬種の保険料
- 人気犬種の費用
- 猫
- 一般的な症状・疾患
- 猫
- 犬
- 消費者層分析
- 性別
- 世帯収入
- 世帯のペット飼育状況
- 平均保険料, 2021-2025
- ペット保険の普及率2025
- 保険金請求の支払いプロセス
- ペット保険を提供する雇用主の動向と普及率
- 流通チャネル分析
- ポーター分析
- PESTEL分析
第4章 競合情勢
- イントロダクション
- 企業の市場シェア分析
- 企業マトリクス分析
- 主要市場企業の競合分析
- 競合ポジショニングマトリックス
- 主な発展
- 合併・買収
- 提携および協力関係
- 新製品の発売
- 拡大計画
第5章 市場推計・予測:保険契約内容別、2022-2035
- 主要動向
- 事故のみ
- 事故および疾病
- 基本健康管理
- その他の保険補償範囲
第6章 市場推計・予測:動物別、2022-2035
- 主要動向
- 猫
- 犬
- その他の動物
第7章 市場推計・予測:保険提供者別、2022-2035
- 主要動向
- 公共部門
- 民間
第8章 市場推計・予測:販売チャネル別、2022-2035
- 主要動向
- 直接販売
- 代理店販売
- ブローカー販売
- バンカシュアランス
- その他の販売チャネル
第9章 市場推計・予測:地域別、2022-2035
- 主要動向
- 北米
- 米国
- カナダ
- 欧州
- ドイツ
- 英国
- フランス
- スペイン
- イタリア
- アジア太平洋地域
- 中国
- インド
- 日本
- オーストラリア
- 韓国
- ラテンアメリカ
- ブラジル
- メキシコ
- アルゼンチン
- 中東・アフリカ
- 南アフリカ
- サウジアラビア
- アラブ首長国連邦
第10章 企業プロファイル
- Anicom
- ASPCA Pet Health Insurance
- Embrace Pet Insurance Agency
- Fetch by The Dodo
- Figo Pet Insurance
- Hartville Group
- Health for Pet
- Hollard
- Lemonade Insurance
- Nationwide
- Petfirst Healthcare
- Petplan
- ProtectaPet
- Royal &Sun Alliance
- Spot Pet Insurance
- The Oriental Insurance Company
- Trupanion
