
ヒートメーターの市場機会、成長促進要因、産業動向分析、2025~2034年予測
Heat Meters Market Opportunity, Growth Drivers, Industry Trend Analysis, and Forecast 2025 - 2034- 発行日
- ページ情報
- 英文 180 Pages
- 納期
- 2~3営業日
- 商品コード
- 1822643
- カスタマイズ可能 お客様のご希望に応じて、既存データの加工や未掲載情報(例:国別セグメント)の追加などの対応が可能です。詳細はお問い合わせください。
- 翻訳ツール提供対象 PDF対応AI翻訳ツールの無料貸し出しサービスのご利用が可能です
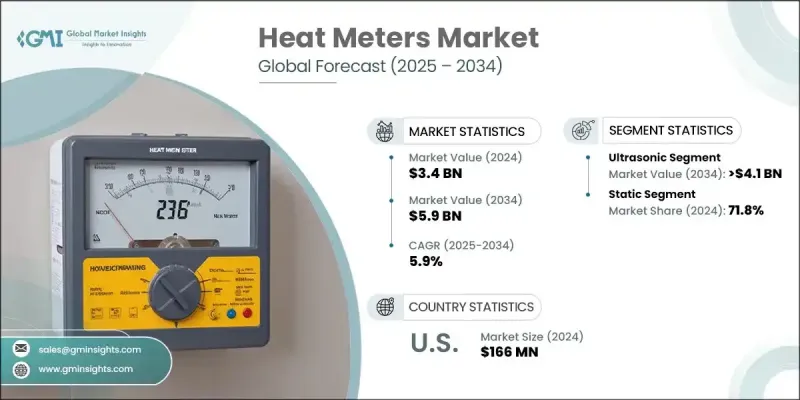
ヒートメーターの世界市場規模は34億米ドルで、エネルギーコストの上昇と環境規制の強化により、CAGR 5.9%で成長し、2034年には59億米ドルに達すると予測されています。
エネルギーコストの上昇と環境規制の強化に伴い、エネルギー消費量を削減し運転経費を削減するために暖房システムを最適化することが重視されるようになっています。リアルタイム監視を可能にし、熱使用量の正確な測定を提供するヒートメーターは、暖房システムの最適化において極めて重要な役割を果たします。例えば、フリアーシステムズは2024年2月、赤外線画像、太陽光発電DC機能、ビジュアルカメラを搭載し、電気検査と計測を強化した新しい業務用クランプメーターFLIR CM276を発売しました。また、地域暖房ネットワークの拡大や既存建物の改修の取り組みも、市場の成長を後押ししています。
都市や自治体は、複数の建物に効率的な集中暖房を提供する地域暖房システムへの投資を増やしています。これらのシステムは、ヒートメーターが提供する正確な計測と制御に依存しています。さらに、暖房システムのアップグレードとエネルギー効率の向上を目的とした、古い建物の改修プロジェクトが進行中であることも、製品需要をさらに押し上げています。業界全体は、製品、技術、用途、地域に区分されます。製品別では、2032年まで渦流セグメントのヒートメーター市場が勢いを増すと予測されています。渦流量計は、流量条件や温度が変化しても、正確で一貫した計測ができることで知られています。このような精度は、効率的な熱管理と、住宅および商業環境の両方における正確な請求に不可欠です。
| 市場範囲 | |
|---|---|
| 開始年 | 2024 |
| 予測年 | 2025-2034 |
| 市場規模 | 34億米ドル |
| 予測金額 | 59億米ドル |
| CAGR | 5.9% |
住宅用アプリケーション分野のヒートメーター市場は、家庭暖房におけるエネルギー効率とコスト削減への注目の高まりにより、2024~2032年に大幅なCAGRが見込まれます。エネルギー価格の上昇や環境問題への関心の高まりにより、住宅所有者はエネルギー消費を抑制し光熱費を削減するために暖房システムを最適化する傾向が強まっています。北米ヒートメーター産業は、厳しいエネルギー効率規制とスマートビルディング技術重視の高まりにより、2024年から2032年にかけて大きく成長します。米国とカナダでは、省エネルギーを強化し温室効果ガス排出を削減するために、建築基準法や規制が高度な計測システムの使用を徐々に義務付けています。
目次
第1章 調査手法と範囲
第2章 エグゼクティブサマリー
第3章 業界考察
- エコシステム分析
- 規制情勢
- 価格動向分析, 2021-2034
- 技術別
- 地域別
- 業界への影響要因
- 促進要因
- 業界の潜在的リスク&課題
- 成長可能性分析
- ポーター分析
- PESTEL分析
第4章 競合情勢
- イントロダクション
- 企業の市場シェア分析:地域別
- 北米
- 欧州
- アジア太平洋地域
世界のその他の地域
- 戦略的ダッシュボード
- 戦略的取り組み
- 企業ベンチマーク
- イノベーションとテクノロジーの情勢
第5章 市場規模・予測:製品別、2021-2034
- 主要動向
- 超音波
- 渦
- その他
第6章 市場規模・予測:技術別、2021-2034
- 主要動向
- 機械
- 静的
第7章 市場規模・予測:排出産業別、2021-2032
- 主要動向
- 住宅用
- 商業用
- 大学
- オフィスビル
- 政府庁舎
- その他
- その他
第8章 市場規模・予測:地域別、2021-2034
- 主要動向
- 北米
- 米国
- カナダ
- 欧州
- ドイツ
- ポーランド
- スウェーデン
- デンマーク
- フィンランド
- ロシア
- イタリア
- 英国
- ノルウェー
- チェコ共和国
- エストニア
- ラトビア
- リトアニア
- スイス
- オーストリア
- スペイン
- アジア太平洋地域
- 中国
- 日本
- 韓国
- 世界のその他の地域
第9章 企業プロファイル
- Apator
- Axioma Metering
- BMETERS
- Diehl Stiftung &Co. KG
- Danfoss
- Huizhong Instrumentation
- Honeywell International
- ista Energy Solutions
- Itron
- Kamstrup
- Landis+Gyr
- Micronics
- QUNDIS
- RB Flowmeter
- Schneider Electric
- Smartdhome
- Secure Meters
- Sontex
- Siemens
- WEIHAI PLOUMETER
- Xylem
- ZENNER International
- 発行日
- 発行
- Global Market Insights Inc.
- ページ情報
- 英文 180 Pages
- 納期
- 2~3営業日


