
クリアアライナー市場の機会、成長要因、業界動向分析、および2025年から2034年までの予測
Clear Aligners Market Opportunity, Growth Drivers, Industry Trend Analysis, and Forecast 2025 - 2034- 発行日
- ページ情報
- 英文 130 Pages
- 納期
- 2~3営業日
- 商品コード
- 1871271
- カスタマイズ可能 お客様のご希望に応じて、既存データの加工や未掲載情報(例:国別セグメント)の追加などの対応が可能です。詳細はお問い合わせください。
- 翻訳ツール提供対象 PDF対応AI翻訳ツールの無料貸し出しサービスのご利用が可能です
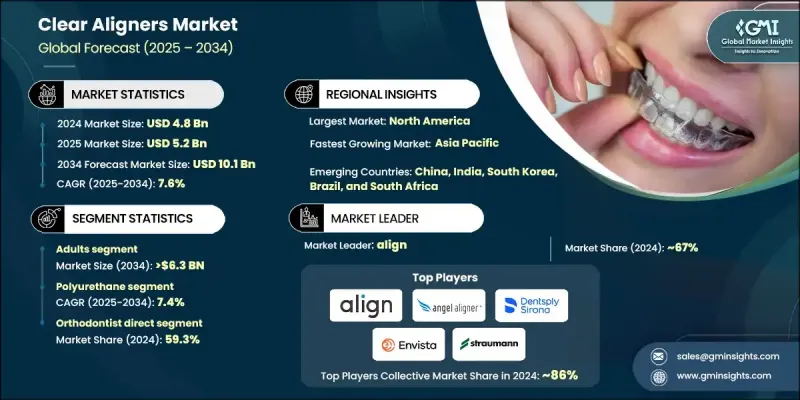
世界の透明矯正装置市場は、2024年に48億米ドルと評価され、2034年までにCAGR7.6%で成長し、101億米ドルに達すると予測されています。
歯列不正の症例増加と目立たない矯正治療への需要拡大により、市場は力強い成長を見せています。特に成人やティーンエイジャーの消費者は、ライフスタイルと審美的な期待の両方に合致する審美歯科治療の選択肢に対する意識を高めています。クリアアライナーは現代の矯正歯科において不可欠な存在となり、金属製ブラケットに代わる効果的で目立たない選択肢を提供しています。デジタルスキャン、AIベースの治療計画、3Dプリントによるカスタマイズといった先進的な機能により、患者様の治療成果と満足度の向上が図られています。デジタルプラットフォームを通じた認知度向上と、審美歯科の動向拡大が相まって、需要はさらに高まっています。特に都市部や専門職層において、利便性と目立たない治療法への志向が患者様の選択に大きく影響しています。高い可処分所得、矯正歯科インフラの拡充、技術統合型治療計画が、世界市場におけるクリアアライナーの普及をさらに促進しています。
| 市場範囲 | |
|---|---|
| 開始年 | 2024年 |
| 予測期間 | 2025-2034 |
| 開始時価値 | 48億米ドル |
| 予測金額 | 101億米ドル |
| CAGR | 7.6% |
2024年、成人セグメントは64.3%のシェアを占めました。これは、効果的で目立たない歯科矯正を求める専門職や高齢層の需要増加が背景にあります。ライフスタイルへの影響を最小限に抑えられる治療を消費者が優先する傾向から、このセグメントは成長を続けています。成人層は、より高い支出能力と口腔衛生の利点に関する知識の向上により、先進的な矯正歯科治療ソリューションをますます好むようになっています。透明アライナーシステムにおける治療期間の短縮や個別対応の向上といった最近の動向は、従来の矯正装置に伴う審美的・快適性の懸念から矯正治療を躊躇していた成人層の関心を集める一助となっております。
矯正歯科医直接チャネルセグメントは2024年に59.3%のシェアを占め、2034年までに58億米ドルに達すると予測されています。このセグメントは、特に詳細な診断と精密さを要する症例において、専門的に管理された治療計画に対する消費者の信頼から恩恵を受けています。対面矯正サービスは、効果的な治療成果を確保する上で依然として重要な、より高度な管理、カスタマイズ、継続的なサポートを提供します。その結果、成功と長期的な結果のために専門家の指導が不可欠な、より複雑な歯科矯正において、患者様はこうしたアプローチを好む傾向にあります。
米国のクリアアライナー市場は2024年に21億米ドルに達しました。堅調な歯科医療システム、強力な償還枠組み、そして高い消費支出能力を背景に、米国は世界市場において引き続き主導的な存在です。従来のブラケットに代わるアライナーの採用増加は、目立たず取り外し可能な矯正装置の魅力によって推進されています。同国に確立された臨床ネットワークと主要ブランドの存在が、持続的な需要に寄与しています。
グローバル・クリアアライナー市場で事業を展開する主要企業には、3M、アライン、メイクオー、ASOインターナショナル、バイオセフィン、デントケア、ノボアライン、クリステル・クリアアライナー、デンマット、エンビスタ、Kライン、ストローマン、ジェニオVA、アングルアライナー、デンツプライ・シローナなどが挙げられます。グローバルクリアアライナー市場における各社は、競争優位性を強化するため、AIを活用した治療計画プラットフォームへの投資、カスタマイズソリューションによる製品ポートフォリオの拡充、精度向上のための3Dプリント技術強化に取り組んでおります。歯科専門家やクリニックとの戦略的提携は、治療のアクセシビリティ向上と消費者信頼の獲得に寄与しております。多くの企業は、特に矯正歯科治療の需要が高まっている新興市場において、地理的範囲の拡大にも注力しています。消費者向けダイレクトマーケティング、デジタルエンゲージメント、啓発キャンペーンを活用し、認知度向上を図っています。
よくあるご質問
目次
第1章 調査手法と範囲
第2章 エグゼクティブサマリー
第3章 業界考察
- エコシステム分析
- 業界への影響要因
- 促進要因
- 不正咬合および歯科疾患の有病率の増加
- 審美的で目立たない矯正ソリューションへの需要の高まり
- 技術の進歩
- 成人およびティーンエイジャーにおける認知度と受容性の拡大
- 業界の潜在的リスク&課題
- 価格に敏感な市場において、高額な治療費が手頃な価格での利用を制限しております
- 市場機会
- 電子商取引および消費者向け矯正歯科モデルの急増
- 新興市場への進出
- 促進要因
- 成長可能性分析
- 償還シナリオ
- 規制情勢
- 技術的情勢
- 現行技術
- 新興技術
- 将来の市場動向
- バリューチェーン分析
- 消費者行動分析
- ブランド分析
- スタートアップシナリオ
- 投資情勢
- 価格設定分析、2024
- ポーター分析
- PESTEL分析
- ギャップ分析
第4章 競合情勢
- イントロダクション
- 企業マトリックス分析
- 企業の市場シェア分析
- 北米
- 欧州
- アジア太平洋地域
- LAMEA
- 主要市場企業の競合分析
- 競合ポジショニングマトリックス
- 主な発展
- 合併・買収
- 提携・協業
- 新製品の発売
- 拡大計画
第5章 市場推計・予測:年齢層別、2021-2034
- 主要動向
- 成人
- 十代
第6章 市場推計・予測:素材別、2021-2034
- 主要動向
- ポリウレタン
- プラスチックポリエチレンテレフタレートグリコール(PETG)
- その他の素材
第7章 市場推計・予測:流通チャネル別、2021-2034
- 主要動向
- 矯正歯科医直接
- 一般歯科医
- 消費者向け直接販売
第8章 市場推計・予測:地域別、2021-2034
- 主要動向
- 北米
- 米国
- カナダ
- 欧州
- ドイツ
- 英国
- フランス
- スペイン
- イタリア
- オランダ
- アジア太平洋地域
- 中国
- 日本
- インド
- オーストラリア
- 韓国
- ラテンアメリカ
- ブラジル
- メキシコ
- アルゼンチン
- 中東・アフリカ
- 南アフリカ
- サウジアラビア
- アラブ首長国連邦
第9章 企業プロファイル
- 3M
- align
- angle aligner
- ASO International, Inc.
- BIOSAFIN
- DenMat
- DentCare
- Dentsply Sirona
- Envista
- GENIOVA
- K LINE
- KRISTELLE Klear Aligners
- makeO
- novoalign
- straumann
- 発行日
- 発行
- Global Market Insights Inc.
- ページ情報
- 英文 130 Pages
- 納期
- 2~3営業日


