
|
市場調査レポート
商品コード
1667183
腫瘍学市場の機会、成長促進要因、産業動向分析、2025~2034年の予測Oncology Market Opportunity, Growth Drivers, Industry Trend Analysis, and Forecast 2025 - 2034 |
||||||
カスタマイズ可能
|
|||||||
| 腫瘍学市場の機会、成長促進要因、産業動向分析、2025~2034年の予測 |
|
出版日: 2024年12月11日
発行: Global Market Insights Inc.
ページ情報: 英文 135 Pages
納期: 2~3営業日
|

全表示
- 概要
- 目次
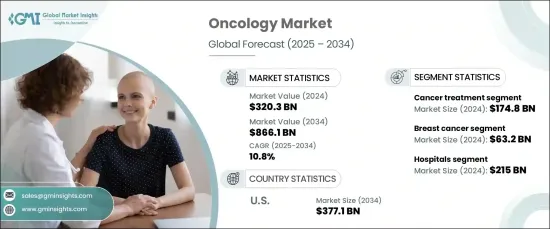
世界の腫瘍学市場は2024年に3,203億米ドルに達し、2025年から2034年にかけてCAGR 10.8%で成長すると予測されています。
腫瘍学は医学の専門分野として、外科手術、化学療法、放射線療法、標的療法、免疫療法などの幅広い戦略を通じて、がんの予防、診断、治療に焦点を当てています。腫瘍学研究の進歩は、がんの根本的な原因や進行の解明、革新的な治療法の開発、患者の転帰の改善を目指しています。
市場はがん診断とがん治療に分けられます。がん診断には、画像診断、生検、腫瘍バイオマーカー検査、リキッドバイオプシー、免疫組織化学、in situハイブリダイゼーションなどが含まれます。一方、がん治療分野には、化学療法、標的療法、免疫療法、ホルモン療法、その他の介入が含まれます。2024年には、がん治療分野が54.6%と最大の市場シェアを占め、世界のがん負担の増加に支えられています。この増加は、人口の高齢化、ライフスタイルの変化、環境要因に起因しています。喫煙、食生活の乱れ、運動不足、汚染物質への曝露は、世界のがん罹患率増加の主な要因です。
| 市場範囲 | |
|---|---|
| 開始年 | 2024 |
| 予測年 | 2025-2034 |
| 開始金額 | 3,203億米ドル |
| 予測金額 | 8,661億米ドル |
| CAGR | 10.8% |
市場はさらに、乳がん、肺がん、前立腺がん、大腸がん、胃がん、肝臓がん、食道がん、その他のがんなど、がんの種類別に分類されます。なかでも乳がんは、有病率の上昇と早期発見・治療の進歩への注目の高まりに後押しされ、依然として収益面で主要セグメントとなっています。その要因としては、遺伝的素因、高齢化、ライフスタイルの変化などが挙げられます。特に新興市場では、がん研究やヘルスケア・インフラへの大規模な投資により、先進的な診断法や治療法へのアクセスがさらに向上しています。こうした取り組みが市場の成長を加速させ、世界的に患者ケアを向上させています。
米国の腫瘍学市場は、がん罹患率の上昇に牽引され、大幅な成長を遂げようとしています。高齢化や生活習慣のリスクといった要因がヘルスケアシステムに大きな需要をもたらし、先進的な治療や診断技術の必要性を煽っています。がんの負担の増大は、製薬会社、病院、研究開発機関に対し、より効果的な治療法、診断法、支援サービスの革新と開発を促しています。
目次
第1章 調査手法と調査範囲
第2章 エグゼクティブサマリー
第3章 業界洞察
- エコシステム分析
- 業界への影響要因
- 促進要因
- 世界のがん罹患率の上昇
- 政府やその他の組織による、疾患に対する認識を広めるための複数の取り組み
- 新興諸国における診断機関数の増加
- 先進諸国における技術の進歩
- 業界の潜在的リスク&課題
- 高額の設備投資と画像診断システムに関する高コスト
- がん治療に伴う副作用やCTスキャナーに伴うリスクの高さ
- 熟練した訓練を受けた腫瘍医や放射線科医の不足
- 促進要因
- 成長可能性分析
- 規制状況
- 技術的展望
- 今後の市場動向
- ギャップ分析
- ポーター分析
- PESTEL分析
第4章 競合情勢
- イントロダクション
- 企業シェア分析
- 企業マトリックス分析
- 主要市場プレーヤーの競合分析
- 競合のポジショニングマトリックス
- 戦略ダッシュボード
第5章 市場推計・予測:がん診断・治療別、2021年~2034年
- 主要動向
- がん診断薬
- 腫瘍バイオマーカー検査
- 画像診断
- 生検
- リキッドバイオプシー
- 免疫組織化学
- in situハイブリダイゼーション
- がん治療
- 化学療法
- 標的療法
- 免疫療法
- ホルモン療法
- その他のがん治療
第6章 市場推計・予測:がんタイプ別、2021年~2034年
- 主要動向
- 肺がん
- 前立腺がん
- 結腸・直腸がん
- 胃がん
- 食道がん
- 肝臓がん
- 乳がん
- その他のがん
第7章 市場推計・予測:最終用途別、2021年~2034年
- 主要動向
- 病院
- 診断研究所
- 画像診断センター
- 学術機関
- 専門クリニック
- その他の最終用途
第8章 市場推計・予測:地域別、2021年~2034年
- 主要動向
- 北米
- 米国
- カナダ
- 欧州
- ドイツ
- 英国
- フランス
- スペイン
- イタリア
- ポーランド
- スイス
- オランダ
- アジア太平洋
- 中国
- インド
- 日本
- オーストラリア
- 韓国
- タイ
- インドネシア
- ベトナム
- ラテンアメリカ
- ブラジル
- メキシコ
- アルゼンチン
- コロンビア
- 中東・アフリカ
- 南アフリカ
- サウジアラビア
- アラブ首長国連邦
- イスラエル
第9章 企業プロファイル
- AbbVie
- Amgen
- AstraZeneca
- Bristol-Myers Squibb Company
- Eli Lilly and Company
- GE HealthCare Technologies
- Gilead Sciences
- GlaxoSmithKline
- Johnson &Johnson
- Merck &Co
- Novartis
- Pfizer
- F. Hoffmann-La Roche
- Sanofi
- Takeda Pharmaceutical Company Limited
The Global Oncology Market reached USD 320.3 billion in 2024 and is projected to grow at a CAGR of 10.8% from 2025 to 2034. Oncology, as a medical specialty, focuses on preventing, diagnosing, and treating cancer through a wide array of strategies, including surgical procedures, chemotherapy, radiotherapy, targeted therapies, and immunotherapy. Advances in oncology research aim to uncover the underlying causes and progression of cancer, driving the development of innovative treatments and improving patient outcomes.
The market is divided into cancer diagnostics and cancer treatment. Cancer diagnostics include imaging, biopsies, tumor biomarker tests, liquid biopsies, immunohistochemistry, and in situ hybridization. Meanwhile, the cancer treatment segment covers chemotherapy, targeted therapies, immunotherapy, hormonal therapy, and other interventions. In 2024, the cancer treatment segment held the largest market share at 54.6%, supported by a rising global cancer burden. This increase is attributed to aging populations, changing lifestyles, and environmental factors. Smoking, poor diets, physical inactivity, and exposure to pollutants are key contributors to the increasing incidence of cancer worldwide.
| Market Scope | |
|---|---|
| Start Year | 2024 |
| Forecast Year | 2025-2034 |
| Start Value | $320.3 Billion |
| Forecast Value | $866.1 Billion |
| CAGR | 10.8% |
The market is further categorized by cancer type, including breast, lung, prostate, colorectal, gastric, liver, esophageal, and other cancers. Among these, breast cancer remains a leading segment in terms of revenue, fueled by its rising prevalence and growing focus on early detection and treatment advancements. Contributing factors include genetic predisposition, aging demographics, and shifting lifestyle patterns. Substantial investments in cancer research and healthcare infrastructure, particularly in emerging markets, are further improving access to advanced diagnostics and therapies. These efforts are accelerating market growth and enhancing patient care globally.
U.S. oncology market is poised for substantial growth, driven by the rising incidence of cancer cases. Factors such as an aging population and lifestyle risks are placing significant demands on healthcare systems, fueling the need for advanced treatments and diagnostic technologies. The growing burden of cancer is encouraging pharmaceutical companies, hospitals, and research institutions to innovate and develop more effective therapies, diagnostics, and support services.
Table of Contents
Chapter 1 Methodology and Scope
- 1.1 Market scope and definitions
- 1.2 Research design
- 1.2.1 Research approach
- 1.2.2 Data collection methods
- 1.3 Base estimates and calculations
- 1.3.1 Base year calculation
- 1.3.2 Key trends for market estimation
- 1.4 Forecast model
- 1.5 Primary research and validation
- 1.5.1 Primary sources
- 1.5.2 Data mining sources
Chapter 2 Executive Summary
- 2.1 Industry 3600 Synopsis
Chapter 3 Industry Insights
- 3.1 Industry ecosystem analysis
- 3.2 Industry impact forces
- 3.2.1 Growth drivers
- 3.2.1.1 Rising incidence of cancer globally
- 3.2.1.2 Several initiatives undertaken by government and other organizations to spread disease awareness
- 3.2.1.3 Growing number of diagnostic laboratories in developing countries
- 3.2.1.4 Technological advancements in developed countries
- 3.2.2 Industry pitfalls and challenges
- 3.2.2.1 High capital investment coupled with high cost associated with diagnostic imaging system
- 3.2.2.2 High risk of side effects associated with cancer treatment and risks associated with CT scanners
- 3.2.2.3 Dearth of well-skilled and trained oncologists and radiologists
- 3.2.1 Growth drivers
- 3.3 Growth potential analysis
- 3.4 Regulatory landscape
- 3.5 Technological landscape
- 3.6 Future market trends
- 3.7 Gap analysis
- 3.8 Porter’s analysis
- 3.9 PESTEL analysis
Chapter 4 Competitive Landscape, 2024
- 4.1 Introduction
- 4.2 Company market share analysis
- 4.3 Company matrix analysis
- 4.4 Competitive analysis of major market players
- 4.5 Competitive positioning matrix
- 4.6 Strategy dashboard
Chapter 5 Market Estimates and Forecast, By Cancer Diagnostics and Treatment, 2021 – 2034 ($ Mn)
- 5.1 Key trends
- 5.2 Cancer diagnostics
- 5.2.1 Tumor biomarkers test
- 5.2.2 Imaging
- 5.2.3 Biopsy
- 5.2.4 Liquid biopsy
- 5.2.5 Immunohistochemistry
- 5.2.6 In situ hybridization
- 5.3 Cancer treatment
- 5.3.1 Chemotherapy
- 5.3.2 Targeted therapy
- 5.3.3 Immunotherapy
- 5.3.4 Hormonal therapy
- 5.3.5 Other cancer treatments
Chapter 6 Market Estimates and Forecast, By Cancer Type, 2021 – 2034 ($ Mn)
- 6.1 Key trends
- 6.2 Lung cancer
- 6.3 Prostate cancer
- 6.4 Colon and rectal cancer
- 6.5 Gastric cancer
- 6.6 Esophageal cancer
- 6.7 Liver cancer
- 6.8 Breast cancer
- 6.9 Other cancer types
Chapter 7 Market Estimates and Forecast, By End Use, 2021 – 2034 ($ Mn)
- 7.1 Key trends
- 7.2 Hospitals
- 7.3 Diagnostic laboratories
- 7.4 Diagnostic imaging centers
- 7.5 Academia
- 7.6 Specialty clinics
- 7.7 Other end use
Chapter 8 Market Estimates and Forecast, By Region, 2021 – 2034 ($ Mn)
- 8.1 Key trends
- 8.2 North America
- 8.2.1 U.S.
- 8.2.2 Canada
- 8.3 Europe
- 8.3.1 Germany
- 8.3.2 UK
- 8.3.3 France
- 8.3.4 Spain
- 8.3.5 Italy
- 8.3.6 Poland
- 8.3.7 Switzerland
- 8.3.8 Netherlands
- 8.4 Asia Pacific
- 8.4.1 China
- 8.4.2 India
- 8.4.3 Japan
- 8.4.4 Australia
- 8.4.5 South Korea
- 8.4.6 Thailand
- 8.4.7 Indonesia
- 8.4.8 Vietnam
- 8.5 Latin America
- 8.5.1 Brazil
- 8.5.2 Mexico
- 8.5.3 Argentina
- 8.5.4 Colombia
- 8.6 Middle East and Africa
- 8.6.1 South Africa
- 8.6.2 Saudi Arabia
- 8.6.3 UAE
- 8.6.4 Israel
Chapter 9 Company Profiles
- 9.1 AbbVie
- 9.2 Amgen
- 9.3 AstraZeneca
- 9.4 Bristol-Myers Squibb Company
- 9.5 Eli Lilly and Company
- 9.6 GE HealthCare Technologies
- 9.7 Gilead Sciences
- 9.8 GlaxoSmithKline
- 9.9 Johnson & Johnson
- 9.10 Merck & Co
- 9.11 Novartis
- 9.12 Pfizer
- 9.13 F. Hoffmann-La Roche
- 9.14 Sanofi
- 9.15 Takeda Pharmaceutical Company Limited

