
|
市場調査レポート
商品コード
1913469
廃熱発電(ORC)市場機会、成長要因、業界動向分析、および2026年から2035年までの予測ORC Waste Heat to Power Market Opportunity, Growth Drivers, Industry Trend Analysis, and Forecast 2026 - 2035 |
||||||
カスタマイズ可能
|
|||||||
| 廃熱発電(ORC)市場機会、成長要因、業界動向分析、および2026年から2035年までの予測 |
|
出版日: 2025年12月26日
発行: Global Market Insights Inc.
ページ情報: 英文 110 Pages
納期: 2~3営業日
|

概要
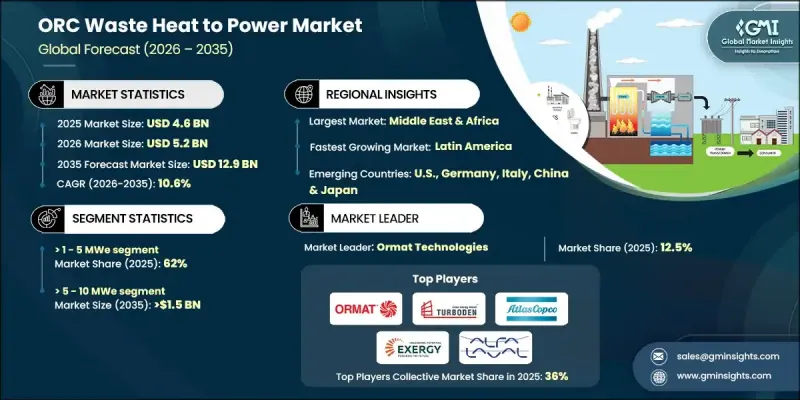
世界の廃熱発電(ORC)市場は、2025年に46億米ドルと評価され、2035年までにCAGR 10.6%で成長し、129億米ドルに達すると予測されています。
この成長は、脱炭素化の取り組みの加速、環境規制の強化、および産業事業者に対するエネルギー効率向上の圧力の高まりによって推進されています。産業プロセスで発生する大量の回収可能な熱は、損失ではなく未活用のエネルギー資源としてますます認識されています。ORC技術により、この残留熱エネルギーは利用可能な電力に変換され、排出量を削減しながら全体的な効率を向上させます。エネルギー価格の変動性や長期的なコスト管理の優先課題も導入を後押ししており、ORCシステムは電力網への依存度を軽減し、運用コストの削減に貢献します。技術の成熟とシステム導入規模の拡大により、均等化発電原価(LCOE)が継続的に低下していることから、大規模施設以外での導入も拡大しています。システム設計、部品効率、運用信頼性の進歩により、出力向上が図られると同時に保守要件が軽減され、より幅広い運用環境においてORCソリューションの商業的魅力が高まっています。
| 市場範囲 | |
|---|---|
| 開始年 | 2025年 |
| 予測年度 | 2026-2035 |
| 開始時価値 | 46億米ドル |
| 予測金額 | 129億米ドル |
| CAGR | 10.6% |
5~10 MWeを超える容量セグメントは、2035年までに15億米ドルに達すると予測されています。この範囲のシステムは、大規模で安定した熱流により現場での有意義な発電が可能な、大量の熱回収アプリケーション向けに選択されます。規制順守目標と長期的な持続可能性への取り組みが、高容量設備への投資を引き続き後押ししています。
2025年時点で、米国ORC廃熱発電市場は6億6,000万米ドルの規模となり、73%のシェアを占めました。市場成長は、有利な政策枠組み、エネルギーコストの上昇、排出量削減への注目の高まりによって支えられています。分散型発電と地域エネルギーレジリエンスへの関心も、導入の勢いをさらに後押ししています。
よくあるご質問
目次
第1章 調査手法と範囲
第2章 エグゼクティブサマリー
第3章 業界考察
- エコシステム分析
- 原材料の入手可能性と調達分析
- 製造能力評価
- サプライチェーンの回復力とリスク要因
- 流通ネットワーク分析
- 規制情勢
- 業界への影響要因
- 促進要因
- 業界の潜在的リスク&課題
- 成長可能性分析
- ポーター分析
- PESTEL分析
- 誘導加熱システムのコスト構造分析
- 新たな機会と動向
- 投資分析と将来展望
- サステナビリティ施策とインダストリー4.0の統合
第4章 競合情勢
- イントロダクション
- 企業の市場シェア分析:地域別
- 北米
- 欧州
- アジア太平洋地域
- 中東・アフリカ
- ラテンアメリカ
- 戦略的ダッシュボード
- 戦略的取り組み
- 主要な提携・協力関係
- 主要なM&A活動
- 製品革新と新製品発売
- 市場拡大戦略
- 競合ベンチマーキング
- イノベーションと持続可能性の情勢
第5章 市場規模・予測:出力別、2022-2035
- <=1 MWe
- 1~5 MWe超
- 5~10 MWe超
- 10 MWe超
第6章 市場規模・予測:地域別、2022-2035
- 北米
- 米国
- カナダ
- メキシコ
- 欧州
- ドイツ
- 英国
- イタリア
- フランス
- ベルギー
- スペイン
- ロシア
- アジア太平洋地域
- 中国
- オーストラリア
- インド
- 日本
- 韓国
- 中東・アフリカ
- サウジアラビア
- アラブ首長国連邦
- 南アフリカ
- ラテンアメリカ
- ブラジル
- アルゼンチン
第7章 企業プロファイル
- ABB
- ALFA LAVAL
- Atlas Copco AB
- Calnetix Technologies, LLC
- Elvosolar, a.s.
- Enertime
- ENOGIA
- Exergy International Srl
- General Electric
- INTEC GMK
- Kaishan USA
- Mitsubishi Heavy Industries, Ltd.
- ORCAN ENERGY AG
- Ormat Technologies
- Triogen
- Turboden S.p.A

