|
|
市場調査レポート
商品コード
1473216
建設市場:規模、動向、地域別、国別の成長予測(2024年~2028年)Construction Market Size, Trends and Growth Forecasts by Regions and Countries, 2024-2028 |
||||||
|
● お客様のご希望に応じて、既存データの加工や未掲載情報(例:国別セグメント)の追加などの対応が可能です。 詳細はお問い合わせください。 |
|||||||
| 建設市場:規模、動向、地域別、国別の成長予測(2024年~2028年) |
|
出版日: 2024年03月31日
発行: GlobalData
ページ情報: 英文 93 Pages
納期: 即納可能
|
- 全表示
- 概要
- 図表
- 目次
課題山積のマクロ経済と地政学的環境により、2024年の世界の建設産業の成長は鈍化します。世界の実質建設の生産高は、2023年の4.1%増から1.6%増になると予測されます。減速は多くの市場で感じられますが、先進国経済の成長はより大きな影響を受けると予想され、西欧の生産高減少に牽引され、2024年の成長率は1%低下します。これに対し、新興市場の成長率は3.3%とプラスを維持し、南アジアは世界のどの地域よりも高い成長率(6.0%)を記録します。2024年の中国の実質建設生産高は4%成長します。世界の建設市場における中国の優位性を考慮すると、中国を除いた世界の実質建設生産高の伸びは0.4%で横ばいとなります。
当レポートでは、世界の建設市場について調査し、地域・国別の動向、今後の予測などを提供しています。
目次
目次
第1章 世界の見通し
第2章 地域の見通し:米国とカナダ
第3章 地域の見通し:ラテンアメリカ
第4章 地域の見通し:西欧
第5章 地域の見通し:東欧と中央アジア
第6章 地域の見通し:東南アジア
第7章 地域の見通し:南アジア
第8章 地域の見通し:オーストラレーシア
第9章 地域の見通し:北東アジア
第10章 地域の見通し:中東および北アフリカ
第11章 地域の見通し:サハラ以南アフリカ
付録
- GlobalDataについて
- お問い合わせ
List of Tables
- Table 1: Global Construction Output Growth (Real, % Change), 2021-2028
- Table 2: North America, Construction Output Value (Real, $ 2022 Billion), 2018-2028
- Table 3: Latin America, Construction Output Value (Real, $ 2022 Billion), 2018-2028
- Table 4: Middle East and North Africa, Construction Output Value (Real, $ 2022 Billion), 2018-2028
- Table 5: Sub-Saharan Africa, Construction Output Value (Real, $ 2022 Billion), 2018-2028
- Table 6: South-East Asia, Construction Output Value (Real, $ 2022 Billion), 2018-2028
- Table 7: South Asia, Construction Output Value (Real, $ 2022 Billion), 2018-2028
- Table 8: North-East Asia, Construction Output Value (Real, $ 2022 Billion), 2018-2028
- Table 9: Australasia, Construction Output Value (Real, $ 2022 Billion), 2018-2028
- Table 10: Western Europe, Construction Output Value (Real, $ 2022 Billion), 2018-2028
- Table 11: Eastern Europe & Central Asia, Construction Output Value (Real, $ 2022 Billion), 2018-2028
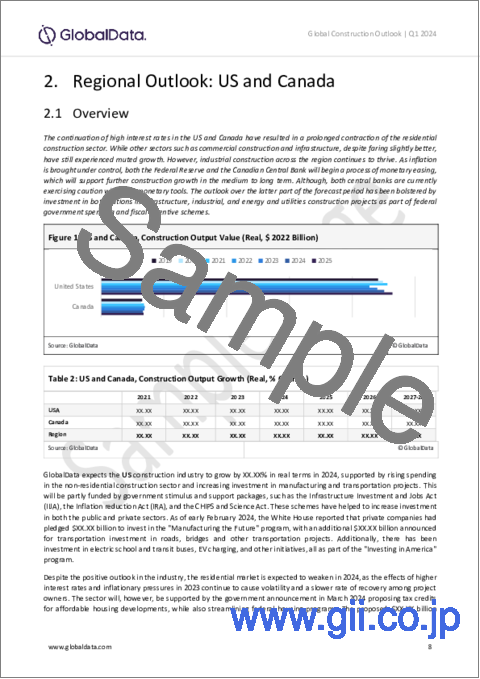
- Table 12: US and Canada, Construction Output Growth (Real, % Change)
- Table 13: Latin America, Construction Output Growth (Real, % Change)
- Table 14: Western Europe, Construction Output Growth (Real, % Change)
- Table 15: Eastern Europe and Central Asia, Construction Output Growth (Real, % Change)
- Table 16: South-East Asia, Construction Output Growth (Real, % Change)
- Table 17: South Asia, Construction Output Growth (Real, % Change)
- Table 18: Australasia, Construction Output Growth (Real, % Change)
- Table 19: North-East Asia, Construction Output Growth (Real, % Change)
- Table 20: Middle East and North Africa, Construction Output Growth (Real, % Change)
- Table 21: Sub-Saharan Africa, Construction Output Growth (Real, % Change)
List of Figures
- Figure 1: Global Construction Output Value by Sector (Real, Index 2019=100), 2021-2028
- Figure 2: Global Construction Output Value by Region (Real, 2022 $ Billion), 2020-2028
- Figure 3: Global Construction Output and GDP by Region and Sector, 2024
- Figure 4: Construction Output Growth vs Risk, by Country
- Figure 5: US and Canada, Construction Output Value (Real, $ 2022 Billion)
- Figure 6: Canada, Construction Employment, In Thousands, In Seasonally Adjusted Terms
- Figure 7: The US, Total Residential Construction Value Put in Place (US$ Million, Non-Seasonally Adjusted)
- Figure 8: Latin America, Construction Output Value (Real, $ 2022 Billion)
- Figure 9: Brazil, National Construction Cost Index - M (INCC-M), August 94=100
- Figure 10: Mexico, Construction Confidence Index, In Seasonally Adjusted Terms
- Figure 11: Chile, Number of Workers in the Construction Industry, In Thousands
- Figure 12: Western Europe, Construction Output Value (Real, $ 2022 Billion)
- Figure 13: Germany, Construction Value Add (2015 Chain Volume, EUR Million)
- Figure 14: Spain, Construction Value Add (2015 Chain Volume, EUR Million)
- Figure 15: France, Construction Value Add (2015 Chain Volume, EUR Million)
- Figure 16: Italy, Construction Value Add (Chain Volume, EUR Million, Seasonally Adjusted)
- Figure 17: UK, Construction Output Volume (Chain Volume, Seasonally Adjusted, GBP Million)
- Figure 18: Eastern Europe and Central Asia, Construction Output Value (Real, $ 2022 Billion)
- Figure 19: Turkey, Construction Value Add (TRY Million, 2009 Chained Volume)
- Figure 20: Russia, Construction Activity Volume Index
- Figure 21: Poland, Construction Value Add (PLN Million, 2015 Chained Volume)
- Figure 22: Slovakia, Construction Value Add (EUR Million, 2015 Chained Volume)
- Figure 23: Hungary, Construction Value Add (HUF Million, 2015 Chained Prices, Seasonally Adjusted)
- Figure 24: South and South-East Asia, Construction Output Value (Real, $ 2022 Billion)
- Figure 25: Indonesia, Construction Value-Add (IDR Billion, 2010 Prices, Seasonally Adjusted)
- Figure 26: Thailand, Construction Value-Add (THB Million, Seasonally Adjusted Chained Volume Measures)
- Figure 27: Singapore, Construction Value-Add (SGD million, 2015 Chained Prices, Seasonally Adjusted)
- Figure 28: Malaysia, Construction Value-Add (MYR Million, 2015 Prices, Seasonally Adjusted)
- Figure 29: Philippines, Construction Value-Add (PHP Billion, 2018 Prices)
- Figure 30: Vietnam, Construction Value-Add (VND Billion, 2010 Prices)
- Figure 31: South Asia, Construction Output Value (Real, $ 2022 Billion)
- Figure 32: India, Construction Value-Add (INR Billion, Constant Prices)
- Figure 33: Sri Lanka, Construction Value-Add (Billion, 2015 Constant Prices)
- Figure 34: Australasia, Construction Output Value (Real, $ 2022 Billion)
- Figure 35: Australia, Construction Work Done (AUD Million, Chained 2018 Prices, Seasonally Adjusted)
- Figure 36: Australia, Construction Value Add (Million AUD, Chained Volume Measures, 2018-19 Prices)
- Figure 37: Australia, Building Approvals (Million AUD, Seasonally Adjusted, Chain Volume, 2018-19 Prices)
- Figure 38: New Zealand, Volume of Building Work Put in Place, NZD million, SA Q3 2022 Prices
- Figure 39: New Zealand, Construction Value-add (Million NZD, Chained Volume Measures, 2009-10 Prices)
- Figure 40: New Zealand, Number of Building Consents Issued, Three-month moving average
- Figure 41: North-East Asia, Construction Output Value (Real, $ 2022 Billion)
- Figure 42: China, Construction Value-Add Index, Constant Prices, % Change YoY
- Figure 43: Japan, Construction Orders Received, JPY Billion, 3-month Moving Average
- Figure 44: South Korea, Construction Value-Add (KRW Billion, 2015 Chained Prices, Seasonally Adjusted)
- Figure 45: South Korea, Value of Construction Orders Received, KRW Billion, 3-month Moving Average
- Figure 46: Taiwan, Construction Value-Add, TWD Million, 2016 Chained Prices
- Figure 47: Hong Kong, Gross Value of Construction Work Performed, HKD Million, Seasonally Adjusted 2000 Chained Prices
- Figure 48: Middle East and North Africa, Construction Output Value (Real, $ 2022 Billion)
- Figure 49: Saudi Arabia, Construction Value-Add (SAR Million, Constant Prices)
- Figure 50: Bahrain, Constructions Value Add (BHD Million, 2010 Constant Prices)
- Figure 51: Sub-Saharan Africa, Construction Output Value (Real, $ 2022 Billion)
- Figure 52: South Africa, Construction Value Add (ZAR Billion, Constant 2015 Prices)
- Figure 53: Nigeria, Construction Value-Add (NGN Million, Constant Prices)
This report provides a detailed analysis of the prospects for the global construction industry up to 2028.
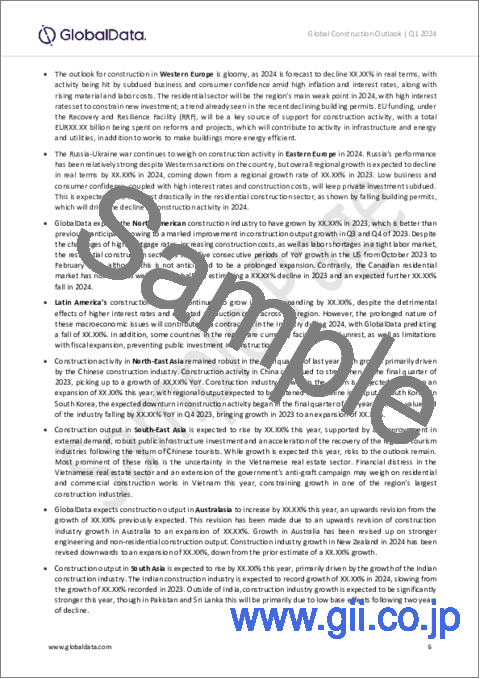
The challenging macroeconomic and geopolitical environment will see growth in the global construction industry slow in 2024. Real global construction output is anticipated to grow by 1.6%, having grown by 4.1% in 2023. Although the slowdown is being felt across many markets, growth in advanced economies is expected to be more impacted - with growth in 2024 falling by 1%, driven by lower output in Western Europe. In comparison, growth in emerging markets will remain positive, at 3.3%, with South Asia posting the highest grow (6.0%) of any region globally. China's real construction output will grow by 4% in 2024. Given the country's dominance across the global construction market, global real construction output growth excluding China will be flat at 0.4%.
Scope
- An overview of the outlook for the global construction industry to 2028.
- Analysis of the outlook for the construction industry in major global regions: North America, Latin America, Western Europe, Eastern Europe, South Asia, South-East Asia, North-East Asia, Australasia, the Middle East and North Africa, and Sub-Saharan Africa.
- A comprehensive benchmarking of 91 leading construction markets according to construction market value and growth
- Analysis of the latest data on construction output trends in key markets.
Reasons to Buy
- Evaluate regional construction trends from insight on output values and forecast data to 2028. Identify the fastest growers to enable assessment and targeting of commercial opportunities in the markets best suited to strategic focus.
- Identify the drivers in the global construction market and consider growth in emerging and developed economies. Formulate plans on where and how to engage with the market while minimizing any negative impact on revenues.
Table of Contents
Table of Contents
1 Global Outlook
2 Regional Outlook: US and Canada
- 2.1 Overview
- 2.2 Key Updates
3 Regional Outlook: Latin America
- 3.1 Overview
- 3.2 Key Updates
4 Regional Outlook: Western Europe
- 4.1 Overview
- 4.2 Key Updates
5 Regional Outlook: Eastern Europe & Central Asia
- 5.1 Overview
- 5.2 Key Updates
6 Regional Outlook: South-East Asia
- 6.1 Overview
- 6.2 Key Updates
7 Regional Outlook: South Asia
- 7.1 Overview
- 7.2 Key Updates
8 Regional Outlook: Australasia
- 8.1 Overview
- 8.2 Key Updates
9 Regional Outlook: North-East Asia
- 9.1 Overview
- 9.2 Key Updates
10 Regional Outlook: Middle East and North Africa
- 10.1 Overview
- 10.2 Key Updates
11 Regional Outlook: Sub-Saharan Africa
- 11.1 Overview
- 11.2 Key Updates
Appendix
- About GlobalData
- Contact Us


