|
|
市場調査レポート
商品コード
1354365
アンモニアの生産能力と設備投資の見通し:地域別、国別、企業別、原料別、プロジェクト、予測(~2030年)Ammonia Capacity and Capital Expenditure Outlook by Region, Countries, Companies, Feedstock, Projects and Forecast to 2030 |
||||||
|
|
|||||||
カスタマイズ可能
適宜更新あり
|
|||||||


| アンモニアの生産能力と設備投資の見通し:地域別、国別、企業別、原料別、プロジェクト、予測(~2030年) |
|
出版日: 2023年08月31日
発行: GlobalData
ページ情報: 英文
納期: 即納可能
|

- 全表示
- 概要
- 図表
- 目次
世界のアンモニアの生産能力は今後数年間で大幅に増加する見込みで、2022年の年間2億3,826万トンから2030年に3億1,102万トンに達する可能性があります。北米と旧ソ連を中心に、2030年までに約114のプラントが稼働する予定です。国々では、米国が2030年までにアンモニア生産能力の成長をリードし、ロシアとインドがそれに続くと予測されます。Denbury Carbon Solutions LLC、BW Group Ltd、Novatekが、今後数年間における世界の計画・発表された生産能力増強の上位3社です。
当レポートでは、世界のアンモニア産業について調査分析し、各地域の生産能力と設備投資の見通しや、プロジェクトの詳細情報などを提供しています。
目次
第1章 世界のアンモニア生産能力と設備投資の見通し
- 主なハイライト
- 主な新プラントの発表
- 新プラントのキャンセル
- 主な停止中のプラント
- 世界のアンモニア生産能力への寄与:地域別
- 世界のアンモニア生産能力への寄与:稼働中、計画・発表済みプラント別(2023年)
- 主要企業:アンモニア生産能力への寄与別(2022年)
- 主要国:稼働中の世界のアンモニア産業の生産能力への寄与別
- 主な原料:世界のアンモニア産業の生産能力への寄与別
- 各地域の世界のアンモニア産業の生産能力への寄与:原料別
- 各地域の計画・発表済みプロジェクトによる生産能力増強
- 世界の計画・発表済みプロジェクトによる生産能力増強:上位10ヶ国別
- 世界の計画・発表済みプロジェクトによる生産能力増強:上位10社別
- 地域の計画・発表済みプロジェクトに対する設備投資支出
- 主要国の計画・発表済みプラントに対する設備投資支出
第2章 主な世界の計画・発表済みアンモニアプロジェクト
第3章 付録
List of Tables
List of Tables
- Table 1: Ammonia Industry, Global, Capacity by Key Countries (mtpa), 2022-2030
- Table 2: Active and planned Ammonia capacity by region (mtpa), 2023
- Table 3: Ammonia capacity share of top 10 companies (%), 2022
- Table 4: Active Ammonia capacity of top 10 countries (mtpa), 2022
- Table 5: Global Ammonia capacity share by feedstock (%)
- Table 6: Total Ammonia feedstock by region (mtpa)
- Table 7: Ammonia Industry, global, planned and announced capacity additions by region (mtpa), 2030
- Table 8: Planned and announced capacity additions by top 10 countries (mtpa), 2030
- Table 9: Planned and announced capacity additions by top 10 companies (mtpa), 2030
- Table 10: Total Capex Spending on Planned and Announced Projects by Region ($B), 2023-2030
- Table 11: Total capex spending on planned and announced plants by top 10 countries ($ B), 2023-2030
- Table 12: Global, top 50 planned and announced Ammonia plant details, 2023-2030
List of Figures
List of Figures
- Figure 1: Ammonia Industry, Global, Capacity by Region (mtpa), 2022-2030
- Figure 2: Active, planned, and announced Ammonia capacity by region (mtpa), 2023
- Figure 3: Ammonia capacity share of top 10 companies (%), 2022
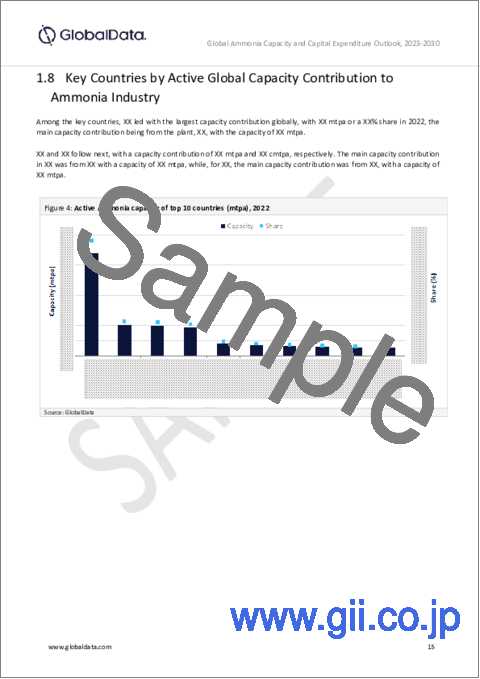
- Figure 4: Active Ammonia capacity of top 10 countries (mtpa), 2022
- Figure 5: Global Ammonia capacity share by feedstock (%)
- Figure 6: Total Ammonia feedstock by region (mtpa)
- Figure 7: Ammonia Industry, global, planned and announced capacity additions by region (mtpa), 2030
- Figure 8: Planned and announced capacity additions by top 10 countries (mtpa), 2030
- Figure 9: Planned and announced capacity additions by top 10 companies (mtpa), 2030
- Figure 10: Total capex spending on planned and announced plants by region ($B), 2023-2030
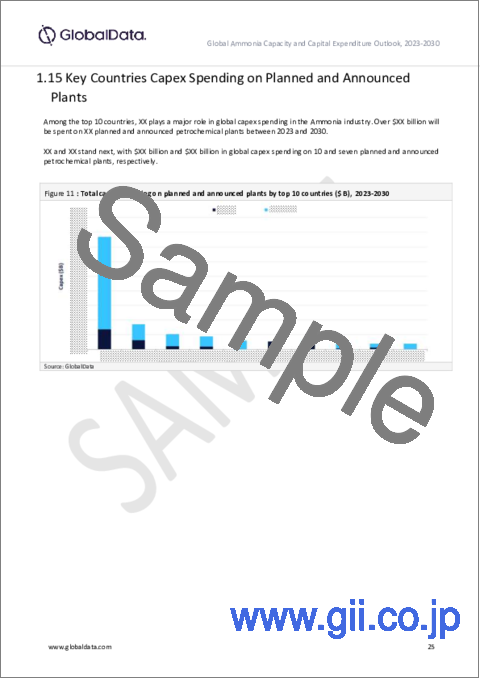
- Figure 11 : Total capex spending on planned and announced plants by top 10 countries ($ B), 2023-2030
Abstract
Global Ammonia capacity is poised to see considerable growth over the upcoming years, potentially increasing from 238.26 million tonnes per annum (mtpa) in 2022 to 311.02 mtpa in 2030. Around 114 planned and announced plants are slated to come online by 2030, primarily in North America and Former Soviet Union. Among countries, US is expected to lead Ammonia capacity growth by 2030, followed by Russia and India. Denbury Carbon Solutions LLC, BW Group Ltd and Novatek are the top three companies by planned and announced capacity additions globally over the upcoming years.
Scope
- Global Ammonia capacity outlook by region
- Ammonia planned and announced plants details
- Capacity share of the major Ammonia producers globally
- Global Ammonia capital expenditure outlook by region
Reasons to Buy
- Understand key trends in the global Ammonia industry
- Identify opportunities in the global Ammonia industry with the help of upcoming plants and capital expenditure outlook
- Understand the current and future competitive scenario
Table of Contents
Table of Contents
1. Global Ammonia Capacity and Capital Expenditure Outlook
- 1.1 Key Highlights
- 1.2 Major New Plants Announcements
- 1.3 New Plant Cancellations
- 1.4 Key Stalled Plants
- 1.5 Global Ammonia Capacity contribution by region
- 1.6 Global Ammonia Capacity Contribution by Active, Planned and Announced Plants, 2023
- 1.7 Key Companies by Ammonia Capacity Contribution (% Share), 2022
- 1.8 Key Countries by Active Global Capacity Contribution to Ammonia Industry
- 1.9 Key Feedstocks by Capacity Contributions to Global Ammonia Industry
- 1.10 Regional Capacity Contributions to Global Ammonia Industry by Feedstock
- 1.11 Regional Capacity Additions from Planned and Announced Projects
- 1.12 Global Capacity Additions from Planned and Announced Projects by Top 10 Countries
- 1.13 Global Capacity Additions from Planned and Announced Projects by Top 10 Companies
- 1.14 Regional Capex Spending on Planned and Announced Projects
- 1.15 Key Countries Capex Spending on Planned and Announced Plants
2. Key Global Planned and Announced Ammonia Projects
3. Appendix
- 3.1 Definitions
- 3.2 Abbreviations
- 3.3 Market Definition
- 3.4 Status Definition
- 3.5 Methodology
- Contact Us
