|
|
市場調査レポート
商品コード
1345165
メチレンジフェニルジイソシアネート(MDI)産業の設備容量と設備投資(CapEx)の予測:地域別、国別、活動中・計画中・発表済みプロジェクトの詳細を含む(~2027年)Methylene Diphenyl Diisocyanate (MDI) Industry Installed Capacity and Capital Expenditure (CapEx) Forecast by Region and Countries Including Details of All Active, Planned and Announced Projects to 2027 |
||||||
|
|
|||||||
カスタマイズ可能
適宜更新あり
|
|||||||


| メチレンジフェニルジイソシアネート(MDI)産業の設備容量と設備投資(CapEx)の予測:地域別、国別、活動中・計画中・発表済みプロジェクトの詳細を含む(~2027年) |
|
出版日: 2023年08月23日
発行: GlobalData
ページ情報: 英文
納期: 即納可能
|

- 全表示
- 概要
- 図表
- 目次
世界のメチレンジフェニルジイソシアネート(MDI)の生産能力は、今後5年間に大きく成長する見通しで、2022年の10.74mtpaから2027年に12.11mtpaに達し、2.4%の成長を示す可能性があります。
計画中・発表済みのおよそ5件のMDIプロジェクトは、今後数年間に主にアジア、次いで北米で稼働を開始すると予測されます。国別では、中国が2027年までにMDIの生産能力増強をリードし、米国がこれに続く見込みです。Wanhua Chemical Group Co Ltd、BASF SE、Mitsui Chemicals Inc.が、今後数年間における世界の計画中・発表済み生産能力増強の上位3社です。
当レポートでは、世界のメチレンジフェニルジイソシアネート(MDI)産業について調査分析し、各地域の生産能力と設備投資の見通しや、プロジェクトの詳細情報などを提供しています。
目次
第1章 イントロダクション
第2章 世界のメチレンジフェニルジイソシアネート(MDI)の生産能力と設備投資のレビュー
- 世界のMDI産業、概要
- 世界のMDI産業、生産能力:主要国別
- 世界のMDI産業、成長率に対する生産能力シェア:主要国別(2017年~2022年)
- 世界のMDI産業、主な計画中・発表済みプロジェクト
- 世界のMDI産業、生産能力の寄与:地域別
- 主要企業:MDIの生産能力寄与率別(2022年)
- 主要国:MDI産業への世界の生産能力の寄与別
- 世界のMDI産業、プラントの設備容量:技術別(2022年)
- 計画中・発表済みプロジェクトによる地域の生産能力増強
- 計画中・発表済みプロジェクトによる世界の生産能力増強:国別
- 計画中・発表済みプロジェクトによる世界の生産能力増強:企業別
- 計画中・発表済みプロジェクトに対する地域の設備投資支出
- 計画中・発表済みプロジェクトに対する世界の設備投資支出:国別
第3章 世界の計画中・発表済みMDIプロジェクト
第4章 アジアのMDI産業
- アジアのMDI産業、概要
- アジアのMDI産業、生産能力:主要国別(2017年~2027年)
- アジアのMDI産業、成長率に対する生産能力シェア:主要国別(2017年~2022年)
- アジアMDI産業、プラントの設備容量:技術別(2022年)
- アジアのMDI産業、計画中・発表済みプロジェクトに対する新設、拡張設備投資の見通し
- アジアのMDI産業、計画中・発表済みプロジェクトに対する新設、拡張設備投資の見通し:国別
- 中国のMDI産業
- MDI産業、韓国
- MDI産業、日本
- MDI産業、インド
第5章 欧州のMDI産業
第6章 中東のMDI産業
第7章 北米のMDI産業
第8章 付録
List of Tables
List of Tables
- Table 1: MDI Industry, Global, key statistics, 2022
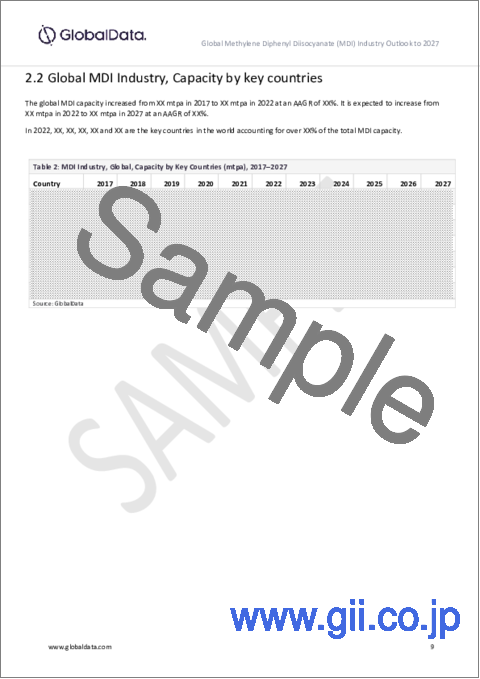
- Table 2: MDI Industry, Global, Capacity by Key Countries (mtpa), 2017-2027
- Table 3: MDI Industry, Global, Top Planned and Announced Projects Details, 2023-2027
- Table 4: MDI Industry, Global, capacity by region (mtpa), 2022-2027
- Table 5: MDI Industry, global, capacity share of top 10 Companies (%), 2022
- Table 6: MDI Industry, global, active Capacity of Top 10 Countries (mtpa), 2022
- Table 7: Global, MDI Industry, Installed Plant Capacity by Technology (%) 2022
- Table 8: Global, MDI Industry, Installed Plant Capacity by Wanhua MDI Technology, 2022
- Table 9: Global, MDI Industry, Installed Plant Capacity by Covestro MDI Technology, 2022
- Table 10: Global, MDI Industry, Installed Plant Capacity by Dow MDI Technology, 2022
- Table 11: Global, MDI Industry, Installed Plant Capacity by Huntsman MDI Technology, 2022
- Table 12: Global, MDI Industry, Installed Plant Capacity by BASF MDI Technology, 2022
- Table 13: MDI Industry, global, planned and announced capacity additions by region (mtpa), 2027
- Table 14: MDI Industry, global, planned and announced capacity additions by countries (mtpa), 2027
- Table 15: MDI Industry, global, planned and announced capacity additions by Companies (mtpa), 2027
- Table 16: MDI Industry, Global, Total Capex Spending on Planned and Announced Projects by Region ($ bil), 2023-2027
- Table 17: MDI Industry, Global, Total Capex Spending on Planned and Announced Projects by Countries ($ bil), 2023-2027
- Table 18: Global, planned and announced MDI projects details
- Table 19: MDI Industry, Asia, key statistics, 2022
- Table 20: MDI Industry, Asia, Capacity by Key Countries (mtpa), 2017-2027
- Table 21: Asia, MDI Industry, Installed Plant Capacity by Technology (%) 2022
- Table 22: Asia, MDI Industry, Installed Plant Capacity by Wanhua MDI Technology, 2022
- Table 23: Asia, MDI Industry, Installed Plant Capacity by Covestro MDI Technology, 2022
- Table 24: Asia, MDI Industry, Installed Plant Capacity by BASF MDI Technology, 2022
- Table 25: Asia, MDI Industry, Installed Plant Capacity by Mitsui MDI Technology, 2022
- Table 26: Asia, MDI Industry, Installed Plant Capacity by Dow MDI Technology, 2022
- Table 27: MDI Industry, Asia, New Build and Expansion Capital Expenditure Outlook for Planned and Announced Projects ($B), 2023-2027
- Table 28: MDI Industry, Asia, New Build and Expansion Capital Expenditure Outlook for Planned and Announced Projects by Countries ($B), 2023-2027
- Table 29: MDI Industry, China, Capacity by Major Plants (mtpa) 2017-2027
- Table 30: MDI Industry, South Korea, Capacity by Major Plants (mtpa) 2017-2027
- Table 31: MDI Industry, Japan, Capacity by Major Plants (mtpa) 2017-2027
- Table 32: MDI Industry, India, Capacity by Major Plants (mtpa) 2017-2027
- Table 33: MDI Industry, Europe, key statistics, 2022
- Table 34: MDI Industry, Europe, Capacity by Key Countries (mtpa), 2017-2027
- Table 35: Europe, MDI Industry, Installed Plant Capacity by Technology (%) 2022
- Table 36: Europe, MDI Industry, Installed Plant Capacity by Covestro MDI Technology, 2022
- Table 37: Europe, MDI Industry, Installed Plant Capacity by Huntsman MDI Technology, 2022
- Table 38: Europe, MDI Industry, Installed Plant Capacity by Dow MDI Technology, 2022
- Table 39: Europe, MDI Industry, Installed Plant Capacity by IPPC MDI Technology, 2022
- Table 40: MDI Industry, Europe, New Build and Expansion Capital Expenditure Outlook for Planned and Announced Projects ($B), 2023-2027
- Table 41: MDI Industry, Europe, New Build and Expansion Capital Expenditure Outlook for Planned and Announced Projects by Countries ($B), 2023-2027
- Table 42: MDI Industry, Germany, Capacity by Major Plants (mtpa) 2017-2027
- Table 43: MDI Industry, Belgium, Capacity by Major Plants (mtpa) 2017-2027
- Table 44: MDI Industry, Netherlands, Capacity by Major Plants (mtpa) 2017-2027
- Table 45: MDI Industry, Hungary, Capacity by Major Plants (mtpa) 2017-2027
- Table 46: MDI Industry, Portugal, Capacity by Major Plants (mtpa) 2017-2027
- Table 47: MDI Industry, Spain, Capacity by Major Plants (mtpa) 2017-2027
- Table 48: MDI Industry, Middle East, key statistics, 2022
- Table 49: MDI Industry, Middle East, Capacity by Key Countries (mtpa), 2017-2027
- Table 50: Middle East, MDI Industry, Installed Plant Capacity by Technology (%) 2022
- Table 51: Middle East, MDI Industry, Installed Plant Capacity by Dow MDI Technology, 2022
- Table 52: Middle East, MDI Industry, Installed Plant Capacity by Chematur MDI Technology, 2022
- Table 53: MDI Industry, Saudi Arabia, Capacity by Major Plants (mtpa) 2017-2027
- Table 54: MDI Industry, Iran, Capacity by Major Plants (mtpa) 2017-2027
- Table 55: MDI Industry, North America, key statistics, 2022
- Table 56: MDI Industry, North America, Capacity by Key Countries (mtpa), 2017-2027
- Table 57: North America, MDI Industry, Installed Plant Capacity by Technology (%) 2022
- Table 58: North America, MDI Industry, Installed Plant Capacity by Huntsman MDI Technology, 2022
- Table 59: North America, MDI Industry, Installed Plant Capacity by Dow MDI Technology, 2022
- Table 60: North America, MDI Industry, Installed Plant Capacity by Covestro MDI Technology, 2022
- Table 61: North America, MDI Industry, Installed Plant Capacity by BASF MDI Technology, 2022
- Table 62: MDI Industry, North America, New Build and Expansion Capital Expenditure Outlook for Planned and Announced Projects ($B), 2023-2027
- Table 63: MDI Industry, North America, New Build and Expansion Capital Expenditure Outlook for Planned and Announced Projects by Countries ($B), 2023-2027
- Table 64: MDI Industry, US, Capacity by Major Plants (mtpa) 2017-2027
List of Figures
List of Figures
- Figure 1: Global MDI Industry, Capacity Share vis-a-vis Growth by Key Countries, 2017-2022
- Figure 2: MDI Industry, global, capacity by region (mtpa), 2022-2027
- Figure 3: MDI Industry, global,capacity share of top 10 companies (%), 2022
- Figure 4: MDI Industry, global, active capacity of top 10 countries (mtpa), 2022
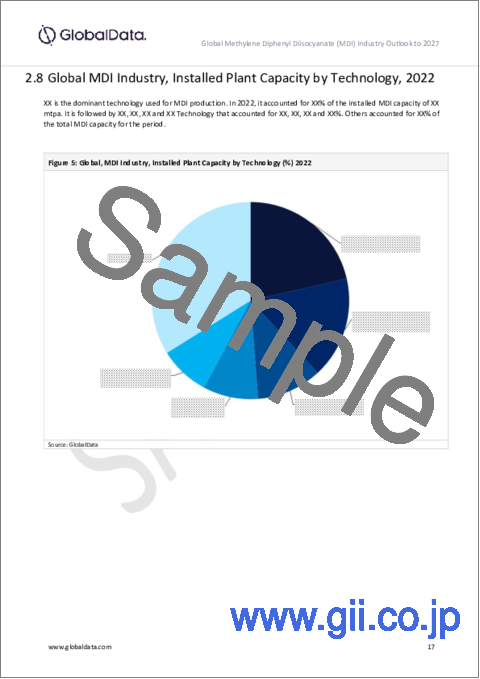
- Figure 5: Global, MDI Industry, Installed Plant Capacity by Technology (%) 2022
- Figure 6: MDI Industry, global, planned and announced capacity additions by region (mtpa), 2027
- Figure 7: MDI Industry, global, planned and announced Capacity Additions by Countries (mtpa), 2027
- Figure 8: MDI Industry, global, planned and announced Capacity Additions by companies (mtpa), 2027
- Figure 9: MDI Industry, Total Capex Spending on Planned and Announced Projects by Region ($ bil), 2023-2027
- Figure 10: MDI Industry, Total Capex Spending on Planned and Announced Projects by Countries ($ bil), 2023-2027
- Figure 11: MDI Industry, Asia, Capacity Share vis-a-vis Growth by Key Countries, 2017-2022
- Figure 12: Asia, MDI Industry, Installed Plant Capacity by Technology (%) 2022
- Figure 13: MDI Industry, Asia, New Build and Expansion Capital Expenditure Outlook for Planned and Announced Projects ($B), 2023-2027
- Figure 14: MDI Industry, Asia, New Build and Expansion Capital Expenditure Outlook for Planned and Announced Projects by Countries ($B), 2023-2027
- Figure 15: MDI Industry, Europe, Capacity Share vis-a-vis Growth by Key Countries, 2017-2022
- Figure 16: Europe, MDI Industry, Installed Plant Capacity by Technology (%) 2022
- Figure 17: MDI Industry, Europe, New Build and Expansion Capital Expenditure Outlook for Planned and Announced Projects ($B), 2023-2027
- Figure 18: MDI Industry, Europe, New Build and Expansion Capital Expenditure Outlook for Planned and Announced Projects by Countries ($B), 2023-2027
- Figure 19: MDI Industry, Middle East, Capacity Share vis-a-vis Growth by Key Countries, 2017-2022
- Figure 20: Middle East, MDI Industry, Installed Plant Capacity by Technology (%) 2022
- Figure 21: MDI Industry, North America, Capacity Share vis-a-vis Growth by Key Countries, 2017-2022
- Figure 22: North America, MDI Industry, Installed Plant Capacity by Technology (%) 2022
- Figure 23: MDI Industry, North America, New Build and Expansion Capital Expenditure Outlook for Planned and Announced Projects ($B), 2023-2027
- Figure 24: MDI Industry, North America, New Build and Expansion Capital Expenditure Outlook for Planned and Announced Projects by Countries ($B), 2023-2027
Abstract
Global Methylene Diphenyl Diisocyanate (MDI) capacity is poised to see considerable growth over the next five years, potentially increasing from 10.74 mtpa in 2022 to 12.11 mtpa in 2027, registering total growth of 2.4%.
Around five planned and announced MDI projects are expected to come online, predominantly in Asia, followed by North America over the upcoming years. Among countries, China is expected to lead MDI capacity additions by 2027, followed by the US. Wanhua Chemical Group Co Ltd, BASF SE and Mitsui Chemicals Inc are the top three companies by planned and announced capacity additions globally over the upcoming years.
Scope
- Global MDI capacity outlook by region
- Global MDI outlook by country
- MDI planned and announced projects details
- Capacity share of the major MDI producers globally
- Global MDI capital expenditure outlook by region
- Global MDI capital expenditure outlook by country
Reasons to Buy
- Obtain the most up to date information available on all active, planned, and announced MDI plants globally
- Identify opportunities in the global MDI industry with the help of upcoming projects and capital expenditure outlook
- Facilitate decision making on the basis of strong historical and forecast of MDI capacity data
Table of Contents
Table of Contents
1. Introduction
2. Global Methylene Diphenyl Diisocyanate (MDI) Capacity and Capital Expenditure Review
- 2.1 Global MDI Industry, An Overview
- 2.2 Global MDI Industry, Capacity by key countries
- 2.3 Global MDI Industry, Capacity Share vis-a-vis Growth by Key Countries, 2017-2022
- 2.4 Global MDI Industry, Top Planned and Announced Projects
- 2.5 Global MDI Industry, Capacity contribution by region
- 2.6 Key Companies by MDI Capacity Contribution (% Share), 2022
- 2.7 Key Countries by Active Global Capacity Contribution to MDI Industry
- 2.8 Global MDI Industry, Installed Plant Capacity by Technology, 2022
- 2.9 Regional Capacity Additions from Planned and Announced Projects
- 2.10 Global Capacity Additions from Planned and Announced Projects by Countries
- 2.11 Global Capacity Additions from Planned and Announced Projects by Companies
- 2.12 Regional Capex Spending on Planned and Announced Projects
- 2.13 Global Capex Spending on Planned and Announced Projects by Countries
3. Global Planned and Announced MDI Projects
4. Asia MDI Industry
- 4.1 Asia MDI Industry, An Overview
- 4.2 Asia MDI Industry, Capacity by Key Countries, 2017-2027
- 4.3 Asia MDI Industry, Capacity Share vis-a-vis Growth by Key Countries, 2017-2022
- 4.4 Asia MDI Industry, Installed Plant Capacity by Technology, 2022
- 4.5 Asia MDI Industry, New Build and Expansion Capital Expenditure Outlook for Planned and Announced Projects
- 4.6 Asia MDI Industry, New Build and Expansion Capital Expenditure Outlook for Planned and Announced Projects by Countries
- 4.7 MDI Industry in China
- 4.8 MDI Industry, South Korea
- 4.9 MDI Industry, Japan
- 4.10 MDI Industry, India
5. Europe MDI Industry
6. Middle East MDI Industry
7. North America MDI Industry
8. Appendix
- 8.1 Definitions
- 8.2 Abbreviations
- 8.3 Status Definition
- 8.4 Methodology
- Contact Us
