|
|
市場調査レポート
商品コード
1248753
苛性ソーダ市場:地域・国別生産能力・設備投資(CapEx)予測(全稼働プラント、計画・発表済みプロジェクトの詳細を含む)、2023年~2027年Caustic Soda Industry Capacity and Capital Expenditure (CapEx) Forecast by Region and Countries Including Details of All Active Plants, Planned and Announced Projects, 2023-2027 |
||||||
|
|
|||||||
|
● お客様のご希望に応じて、既存データの加工や未掲載情報(例:国別セグメント)の追加などの対応が可能です。 詳細はお問い合わせください。 |
|||||||


| 苛性ソーダ市場:地域・国別生産能力・設備投資(CapEx)予測(全稼働プラント、計画・発表済みプロジェクトの詳細を含む)、2023年~2027年 |
|
出版日: 2023年03月09日
発行: GlobalData
ページ情報: 英文 229 Pages
納期: 即納可能
|
- 全表示
- 概要
- 図表
- 目次
世界の苛性ソーダの生産能力は、2022年の100.69mtpaから2027年には106.92mtpaへと、今後5年間で緩やかな成長が見込まれています。今後数年間で、主にアジア、次いで中東で、約40の苛性ソーダプロジェクトが計画・発表され、稼動すると予想されています。国別では、2027年までにインドが苛性ソーダ生産能力の増強をリードし、中国とUAEがそれに続くと予想されています。
当レポートでは、世界の苛性ソーダ市場について調査し、地域・国別生産能力・設備投資動向などを提供しています。
目次
第1章 イントロダクション
第2章 世界の苛性ソーダ生産能力と設備投資のレビュー
第3章 世界で計画・発表済み苛性ソーダプロジェクト
第4章 アフリカの苛性ソーダ産業
- アフリカの苛性ソーダ産業、概要
- アフリカの苛性ソーダ産業、国別生産能力、2017年~2027年
- アフリカの苛性ソーダ産業、国別の成長に対する容量シェア、2017年~2022
- アフリカの苛性ソーダ産業、生産プロセス別の設置済みプラント容量、2022年
- アフリカの苛性ソーダ産業、計画・発表済みプロジェクトの年間新規建設資本支出の見通し
- アフリカの苛性ソーダ産業、国別の計画・発表済みプロジェクトの年間新規建設資本支出の見通し
- エジプト
- 南アフリカ
- モロッコ
- アルジェリア
- スーダン
- タンザニア
第5章 アジアの苛性ソーダ産業
- アジアの苛性ソーダ産業、概要
- アジアの苛性ソーダ産業、主要国別の生産能力、2017年~2027年
- アジアの苛性ソーダ産業、主要国別の成長に対する容量シェア、2017年~2022
- アジアの苛性ソーダ産業、生産プロセス別の設置済みプラント容量、2022年
- アジアの苛性ソーダ産業、計画・発表済みプロジェクトの年間新規建設および拡張資本支出の見通し
- アジアの苛性ソーダ産業、国別の計画・発表済みプラントの年間新規建設および拡張設備投資の見通し
- 中国
- 日本
- インド
- 韓国
- 台湾
- インドネシア
- タイ
- パキスタン
- マレーシア
- ベトナム
- バングラデシュ
- シンガポール
- フィリピン
- ミャンマー
- スリランカ
第6章 欧州の苛性ソーダ産業
第7章 旧ソ連の苛性ソーダ産業
第8章 中東の苛性ソーダ産業
第9章 北米の苛性ソーダ産業
第10章 南米の苛性ソーダ産業
第11章 オセアニアの苛性ソーダ産業
第12章 付録
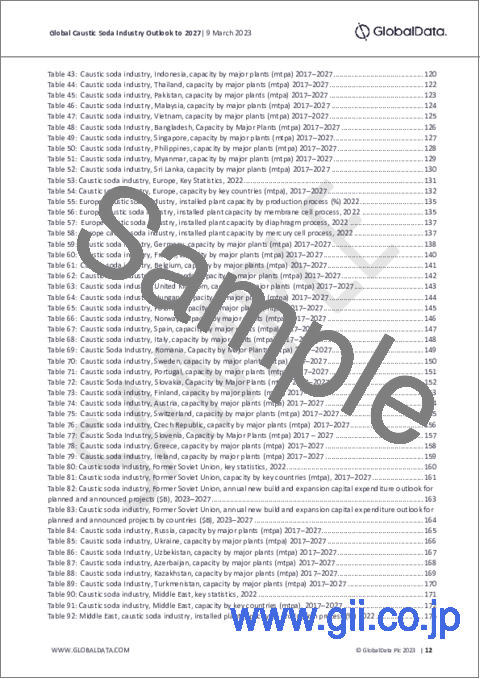
List of Tables
List of Tables
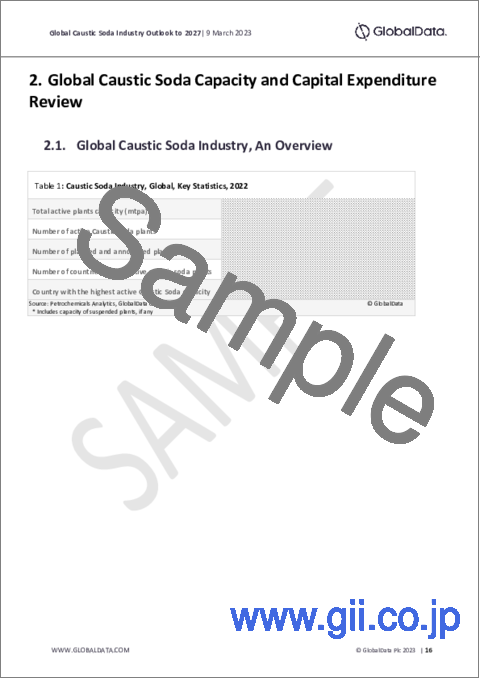
- Table 1: Caustic Soda Industry, Global, Key Statistics, 2022
- Table 2: Caustic soda industry, global, capacity by key countries (mtpa), 2017-2027
- Table 3: Caustic soda industry, global, top 10 planned and announced projects details, 2023-2027
- Table 4: Global, caustic soda industry, installed plant capacity by production process (%) 2022
- Table 5: Global caustic soda industry, installed plant capacity by membrane cell process, 2022
- Table 6: Global caustic soda industry, installed plant capacity by diaphragm process, 2022
- Table 7: Global caustic soda industry, installed plant capacity by mercury cell, 2022
- Table 8: Caustic soda industry, global, capacity by region (mtpa), 2022-2027
- Table 9: Caustic soda industry, global, capacity share of top 10 companies (%), 2022
- Table 10: Caustic soda industry, global, active caustic soda capacity of top 10 countries (mtpa), 2022
- Table 11: Caustic soda industry, global, planned and announced capacity additions by region (mtpa), 2027
- Table 12: Caustic soda industry, global, planned and announced capacity additions by top 10 countries (mtpa), 2027
- Table 13: Caustic soda industry, global, planned and announced capacity additions by top 10 companies (mtpa), 2027
- Table 14: Caustic soda industry, global, total capex spending on planned and announced projects by region ($B), 2023-2027
- Table 15: Caustic soda industry, global, total capex spending on planned and announced projects by countries ($B), 2023-2027
- Table 16: Global, planned and announced caustic soda projects details
- Table 17: Caustic soda industry, Africa, key statistics, 2022
- Table 18: Caustic soda industry, Africa, capacity by countries (mtpa), 2017-2027
- Table 19: Africa, caustic soda industry, installed plant capacity by production process (%) 2022
- Table 20: Africa caustic soda industry, installed plant capacity by membrane cell process, 2022
- Table 21: Africa caustic soda industry, installed plant capacity by diaphragm process, 2022
- Table 22: Caustic soda industry, Africa, annual new build and expansion capital expenditure outlook for planned and announced projects ($B), 2023-2027
- Table 23: Caustic Soda industry, Africa, annual new build and expansion capital expenditure outlook for planned and announced projects by countries ($B), 2023-2027
- Table 24: Caustic Soda industry, Egypt, capacity by major plants (mtpa) 2017-2027
- Table 25: Caustic soda industry, South Africa, capacity by major plants (mtpa) 2017-2027
- Table 26: Caustic soda industry, Morocco, capacity by major plants (mtpa) 2017-2027
- Table 27: Caustic soda industry, Algeria, capacity by major plants (mtpa) 2017-2027
- Table 28: Caustic soda industry, Sudan, capacity by major plants (mtpa) 2017-2027
- Table 29: Caustic Soda industry, Tanzania, capacity by major plants (mtpa) 2017-2027
- Table 30: Caustic Soda industry, Asia, key statistics, 2022
- Table 31: Caustic soda industry, Asia, capacity by key countries (mtpa), 2017-2027
- Table 32: Asia, caustic soda industry, installed plant capacity by production process (%) 2022
- Table 33: Asia caustic soda industry, installed plant capacity by membrane cell process, 2022
- Table 34: Asia caustic soda industry, installed plant capacity by diaphragm process, 2022
- Table 35: Asia caustic soda industry, installed plant capacity by mercury cell, 2022
- Table 36: Caustic Soda industry, Asia, annual new build and expansion capital expenditure outlook for planned and announced projects ($B), 2023-2027
- Table 37: Caustic Soda industry, Asia, annual new build and expansion capital expenditure outlook for planned and announced projects by countries ($B), 2023-2027
- Table 38: Caustic soda industry, China, capacity by major plants (mtpa) 2017-2027
- Table 39: Caustic soda industry, Japan, capacity by major plants (mtpa) 2017-2027
- Table 40: Caustic Soda industry, India, capacity by major plants (mtpa) 2017-2027
- Table 41: Caustic soda industry, South Korea, capacity by major plants (mtpa) 2017-2027
- Table 42: Caustic soda industry, Taiwan, capacity by major plants (mtpa) 2017-2027
- Table 43: Caustic soda industry, Indonesia, capacity by major plants (mtpa) 2017-2027
- Table 44: Caustic soda industry, Thailand, capacity by major plants (mtpa) 2017-2027
- Table 45: Caustic soda industry, Pakistan, capacity by major plants (mtpa) 2017-2027
- Table 46: Caustic soda Industry, Malaysia, capacity by major plants (mtpa) 2017-2027
- Table 47: Caustic soda industry, Vietnam, capacity by major plants (mtpa) 2017-2027
- Table 48: Caustic soda Industry, Bangladesh, Capacity by Major Plants (mtpa) 2017-2027
- Table 49: Caustic soda industry, Singapore, capacity by major plants (mtpa) 2017-2027
- Table 50: Caustic soda Industry, Philippines, capacity by major plants (mtpa) 2017-2027
- Table 51: Caustic soda industry, Myanmar, capacity by major plants (mtpa) 2017-2027
- Table 52: Caustic soda industry, Sri Lanka, capacity by major plants (mtpa) 2017-2027
- Table 53: Caustic soda industry, Europe, Key Statistics, 2022
- Table 54: Caustic soda industry, Europe, capacity by key countries (mtpa), 2017-2027
- Table 55: Europe, caustic soda industry, installed plant capacity by production process (%) 2022
- Table 56: Europe caustic soda industry, installed plant capacity by membrane cell process, 2022
- Table 57: Europe caustic soda industry, installed plant capacity by diaphragm process, 2022
- Table 58: Europe caustic soda industry, installed plant capacity by mercury cell process, 2022
- Table 59: Caustic soda industry, Germany, capacity by major plants (mtpa) 2017-2027
- Table 60: Caustic soda industry, France, capacity by major plants (mtpa) 2017-2027
- Table 61: Caustic soda industry, Belgium, capacity by major plants (mtpa) 2017-2027
- Table 62: Caustic soda industry, Netherlands, capacity by major plants (mtpa) 2017-2027
- Table 63: Caustic soda industry, United Kingdom, capacity by major plants (mtpa) 2017-2027
- Table 64: Caustic soda industry, Hungary, capacity by major plants (mtpa) 2017-2027
- Table 65: Caustic soda industry, Poland, capacity by major plants (mtpa) 2017-2027
- Table 66: Caustic soda industry, Norway, capacity by major plants (mtpa) 2017-2027
- Table 67: Caustic soda industry, Spain, capacity by major plants (mtpa) 2017-2027
- Table 68: Caustic soda industry, Italy, capacity by major plants (mtpa) 2017-2027
- Table 69: Caustic Soda Industry, Romania, Capacity by Major Plants (mtpa) 2017-2027
- Table 70: Caustic soda industry, Sweden, capacity by major plants (mtpa) 2017-2027
- Table 71: Caustic soda industry, Portugal, capacity by major plants (mtpa) 2017-2027
- Table 72: Caustic Soda Industry, Slovakia, Capacity by Major Plants (mtpa) 2017-2027
- Table 73: Caustic soda industry, Finland, capacity by major plants (mtpa) 2017-2027
- Table 74: Caustic soda industry, Austria, capacity by major plants (mtpa) 2017-2027
- Table 75: Caustic soda industry, Switzerland, capacity by major plants (mtpa) 2017-2027
- Table 76: Caustic soda industry, Czech Republic, capacity by major plants (mtpa) 2017-2027
- Table 77: Caustic Soda Industry, Slovenia, Capacity by Major Plants (mtpa) 2017 - 2027
- Table 78: Caustic soda industry, Greece, capacity by major plants (mtpa) 2017-2027
- Table 79: Caustic soda industry, Ireland, capacity by major plants (mtpa) 2017-2027
- Table 80: Caustic soda industry, Former Soviet Union, key statistics, 2022
List of Figures
List of Figures
- Figure 1: Global caustic soda industry, capacity share vis-a-vis growth by key countries, 2017-2022
- Figure 2: Global, caustic soda industry, installed plant capacity by production process (%) 2022
- Figure 3: Caustic soda industry, global, capacity by region (mtpa), 2022-2027
- Figure 4: Caustic soda industry, Global, capacity share of top 10 companies (%), 2022
- Figure 5: Caustic soda industry, global, active caustic soda capacity of top 10 countries (mtpa), 2022
- Figure 6: Caustic soda industry, global, planned and announced capacity additions by region (mtpa), 2027
- Figure 7: Caustic soda industry, global, planned and announced capacity additions by top 10 countries (mtpa), 2027
- Figure 8: Caustic soda industry, global, planned and announced capacity additions by top 10 companies (mtpa), 2027
- Figure 9: Caustic soda industry, global, total capex spending on planned and announced projects by region ($B), 2023-2027
- Figure 10: Caustic soda industry, global, total capex spending on planned and announced projects by countries ($B), 2023-2027
- Figure 11: Caustic soda industry, Africa, capacity share vis-a-vis growth by countries, 2017-2022
- Figure 12: Africa, caustic soda industry, installed plant capacity by production process (%) 2022
- Figure 13: Caustic Soda industry, Africa, annual new build and expansion capital expenditure outlook for planned and announced projects ($B), 2023-2027
- Figure 14: Caustic Soda Industry, Africa, annual new build and expansion capital expenditure outlook for planned and announced projects by countries ($B), 2023-2027
- Figure 15: Caustic soda industry, Asia, capacity share vis-a-vis growth by key countries, 2017-2022
- Figure 16: Asia, caustic soda industry, installed plant capacity by production process (%) 2022
- Figure 17: Caustic soda industry, Asia, annual new build and expansion capital expenditure outlook for planned and announced projects ($B), 2023-2027
- Figure 18: Caustic Soda industry, Asia, annual new build and expansion capital expenditure outlook for planned and announced projects by countries ($B), 2023-2027
- Figure 19: Caustic soda industry, Europe, capacity share vis-a-vis growth by countries, 2017-2022
- Figure 20: Europe, caustic soda industry, installed plant capacity by production process (%) 2022
- Figure 21: Caustic soda industry, Former Soviet Union, capacity share vis-a-vis growth by key countries, 2017-2022
- Figure 22: Caustic soda industry, Former Soviet Union, annual new build and expansion capital expenditure outlook for planned and announced projects ($B), 2023-2027
- Figure 23: Caustic soda industry, Former Soviet Union, annual new build and expansion capital expenditure outlook for planned and announced projects by countries ($B), 2022-2027
- Figure 24: Caustic soda industry, Middle East, capacity share vis-a-vis growth by key countries, 2017-2022
- Figure 25: Middle East, caustic soda industry, installed plant capacity by production process (%) 2022
- Figure 26: Middle East, caustic soda industry, installed plant capacity by technology (%) 2022
- Figure 27: Caustic soda industry, Middle East, annual new build and expansion capital expenditure outlook for planned and announced projects ($B), 2023-2027
- Figure 28: Caustic soda industry, Middle East, annual new build and expansion capital expenditure outlook for planned and announced projects by countries ($B), 2023-2027
- Figure 29: Caustic soda industry, North America, capacity share vis-a-vis growth by countries, 2017-2022
- Figure 30: North America, caustic soda industry, installed plant capacity by production process (%) 2022
- Figure 31: Caustic soda industry, North America, annual new build and expansion capital expenditure outlook for planned and announced projects ($B), 2023-2027
- Figure 32: Caustic soda industry, North America, annual new build and expansion capital expenditure outlook for planned and announced projects by countries ($B), 2023-2027
- Figure 33: Caustic soda industry, South America, capacity share vis-a-vis growth by key countries, 2017-2022
- Figure 34: South America, caustic soda industry, installed plant capacity by production process (%) 2022
- Figure 35: Caustic soda industry, Oceania, capacity share vis-a-vis growth by country, 2017-2022
Global Caustic Soda capacity is expected to experience moderate growth over the next five years from 100.69 mtpa in 2022 to 106.92 mtpa in 2027. Around 40 planned and announced caustic soda projects are expected to come online, predominantly in Asia, followed by Middle East over the upcoming years. Among countries, India is expected to lead caustic soda capacity additions by 2027, followed by China and the UAE. Lords Chloro Alkali Ltd, Formosa Plastics Group, Reliance Industries Ltd and are the top three companies by planned and announced capacity additions globally over the upcoming years.
Scope
- Global caustic soda capacity outlook by region
- Global caustic soda outlook by country
- Caustic soda planned and announced projects details
- Capacity share of the major caustic soda producers globally
- Global caustic soda capital expenditure outlook by region
- Global caustic soda capital expenditure outlook by country
Reasons to Buy
- Obtain the most up to date information available on all active, planned, and announced caustic soda plants globally
- Identify opportunities in the global caustic soda industry with the help of upcoming projects and capital expenditure outlook
- Facilitate decision making on the basis of strong historical and forecast of caustic soda capacity data
Table of Contents
Table of Contents
1. Introduction
- 1.1. What is This Report About?
- 1.2. Market Definition
2. Global Caustic Soda Capacity and Capital Expenditure Review
- 2.1. Global Caustic Soda Industry, An Overview
- 2.2. Global Caustic Soda Industry, Capacity by Key Countries, 2017-2027
- 2.3. Global Caustic Soda Industry, Capacity Share vis-a-vis Growth by Key Countries, 2017-2022
- 2.4. Global Caustic Soda Industry, Top 10 Planned and Announced Projects
- 2.5. Global Caustic Soda Industry, Installed Plant Capacity by Production Process, 2022
- 2.6. Global Caustic Soda Capacity Contribution by Region
- 2.7. Key Companies by Caustic Soda Capacity Contribution (% Share), 2022
- 2.8. Key Countries by Active Global Capacity Contribution to Caustic Soda Industry
- 2.9. Regional Capacity Additions from Planned and Announced Projects
- 2.10. Global Capacity Additions from Planned and Announced Projects by Top 10 Countries
- 2.11. Global Capacity Additions from Planned and Announced Projects by Top 10 Companies
- 2.12. Regional Capex Spending on Planned and Announced Projects
- 2.13. Global Capex Spending on Planned and Announced Projects by Countries
3. Global Planned and Announced Caustic Soda Projects
4. Africa Caustic Soda Industry
- 4.1. Africa Caustic Soda Industry, An Overview
- 4.2. Africa Caustic Soda Industry, Capacity by Countries, 2017-2027
- 4.3. Africa Caustic Soda Industry, Capacity Share vis-a-vis Growth by Countries, 2017-2022
- 4.4. Africa Caustic Soda Industry, Installed Plant Capacity by Production Process, 2022
- 4.5. Africa Caustic Soda Industry, Annual New Build Capital Expenditure Outlook for Planned and Announced Projects
- 4.6. Africa Caustic Soda Industry, Annual New Build Capital Expenditure Outlook for Planned and Announced Projects by Countries
- 4.7. Caustic Soda Industry in Egypt
- 4.8. Caustic Soda Industry in South Africa
- 4.9. Caustic Soda Industry in Morocco
- 4.10. Caustic Soda Industry in Algeria
- 4.11. Caustic Soda Industry in Sudan
- 4.12. Caustic Soda Industry in Tanzania
5. Asia Caustic Soda Industry
- 5.1. Asia Caustic Soda Industry, An Overview
- 5.2. Asia Caustic Soda Industry, Capacity by Key Countries, 2017-2027
- 5.3. Asia Caustic Soda Industry, Capacity Share vis-a-vis Growth by Key Countries, 2017-2022
- 5.4. Asia Caustic Soda Industry, Installed Plant Capacity by Production Process, 2022
- 5.5. Asia Caustic Soda Industry, Annual New Build and Expansion Capital Expenditure Outlook for Planned and Announced Projects
- 5.6. Asia Caustic Soda Industry, Annual New Build and Expansion Capital Expenditure Outlook for Planned and Announced Plants by Countries
- 5.7. Caustic Soda Industry in China
- 5.8. Caustic Soda Industry in Japan
- 5.9. Caustic Soda Industry in India
- 5.10. Caustic Soda Industry in South Korea
- 5.11. Caustic Soda Industry in Taiwan
- 5.12. Caustic Soda Industry in Indonesia
- 5.13. Caustic Soda Industry in Thailand
- 5.14. Caustic Soda Industry in Pakistan
- 5.15. Caustic Soda Industry in Malaysia
- 5.16. Caustic Soda Industry in Vietnam
- 5.17. Caustic Soda Industry in Bangladesh
- 5.18. Caustic Soda Industry in Singapore
- 5.19. Caustic Soda Industry in the Philippines
- 5.20. Caustic Soda Industry in Myanmar
- 5.21. Caustic Soda Industry in Sri Lanka
6. Europe Caustic Soda Industry
7. Former Soviet Union Caustic Soda Industry
8. Middle East Caustic Soda Industry
9. North America Caustic Soda Industry
10. South America Caustic Soda Industry
11. Oceania Caustic Soda Industry
12. Appendix
- 12.1. Definitions
- 12.2. Abbreviations
- 12.3. Status Definition
- 12.4. Methodology
- Contact Us