|
|
市場調査レポート
商品コード
1631231
クリーンラベル原料の世界市場 - 世界の業界分析、規模、シェア、成長、動向、予測(2032年)Clean Label Ingredients Market - Global Industry Analysis, Size, Share, Growth, Trends, and Forecast 2032 |
||||||
|
|||||||
|
|||||||

| クリーンラベル原料の世界市場 - 世界の業界分析、規模、シェア、成長、動向、予測(2032年) |
|
出版日: 2025年01月06日
発行: Fairfield Market Research
ページ情報: 英文 168 Pages
納期: 2~5営業日
|

全表示
- 概要
- 目次
クリーンラベル原料の市場規模は、より健康的で透明性の高い食品オプションへの消費者嗜好の強いシフトに牽引され、急速な成長を遂げています。2025年には594億5,000万米ドル、2032年には1,692億1,000万米ドルに達すると予測され、CAGR16.1%で拡大すると予測されています。クリーンラベルの食材は、自然で加工が最小限に抑えられ、容易に認識できる成分を強調し、シンプルで本格的な食品を求める消費者の需要に合致しています。この動向は、健康、持続可能性、倫理的消費への注目が高まっていることを強調するものであり、メーカー各社は市場の期待に応えるために技術革新を進め、よりクリーンな手法を採用するようになっています。
クリーンラベル原料とは、天然で加工が最小限に抑えられ、識別が容易な飲食品成分を指します。こうした原材料は、シンプルで本物志向、健康志向の食品を求める消費者の需要の高まりに応えるものです。この動向は、倫理的消費と持続可能性への注目の高まりと一致しており、メーカーは消費者の価値観に沿った慣行を採用する必要に迫られています。
クリーンラベル原料市場は、健康志向の消費者と支持的な規制によって推進される、食品生産と消費の変革的シフトを反映しています。イノベーションとコラボレーションの有望な見通しとともに、この市場は世界の食品基準を再定義し、透明で倫理的な食品ソリューションの提供を目指す企業に多大な成長機会を提供するものと期待されます。
消費者は、合成化学物質、防腐剤、人工添加物を含まない、明確で理解しやすいラベルの付いた製品をますます求めるようになっています。ラベルの透明性を促進する規制の枠組みは、こうした消費者の嗜好に合わせることをメーカーにさらに促します。
当レポートでは、世界のクリーンラベル原料市場について調査し、市場の概要とともに、タイプ別、用途別、形態別、地域別動向、および市場に参入する企業の競合動向などを提供しています。
目次
第1章 エグゼクティブサマリー
第2章 市場概要
- 市場の定義とセグメンテーション
- 市場力学
- バリューチェーン分析
- ポーターのファイブフォース分析
- COVID-19の影響分析
- ウクライナ・ロシア紛争の影響
- 経済概要
- PESTLE分析
第3章 世界のクリーンラベル原料市場の見通し、2019年~2032年
- 世界のクリーンラベル原料市場の見通し、タイプ別、金額(10億米ドル)、2019年~2032年
- 世界のクリーンラベル原料市場の見通し、用途別、金額(10億米ドル)、2019年~2032年
- 世界のクリーンラベル原料市場の見通し、形態別、金額(10億米ドル)、2019年~2032年
- 世界のクリーンラベル原料市場の見通し、地域別、金額(10億米ドル)、2019年~2032年
第4章 北米のクリーンラベル原料市場の見通し、2019年~2032年
第5章 欧州のクリーンラベル原料市場の見通し、2019年~2032年
第6章 アジア太平洋のクリーンラベル原料市場の見通し、2019年~2032年
第7章 ラテンアメリカのクリーンラベル原料市場の見通し、2019年~2032年
第8章 中東・アフリカのクリーンラベル原料市場の見通し、2019年~2032年
第9章 競合情勢
- 形態別と用途別のヒートマップ
- メーカー別と用途別のヒートマップ
- 企業市場シェア分析、2024年
- 競合ダッシュボード
- 企業プロファイル
- Cargill
- Ingredion Incorporated
- Koninklijke DSM N.V.
- E.I. Du Pont De Nemours and Company
- Archer Daniels Midland Company
- Kerry Group PLC
- Tate & Lyle PLC
- Daikin America
- Fluoryx
- Wilshire Technologies
- TCI Chemicals
第10章 付録
The clean label ingredients market is experiencing rapid growth, driven by a strong shift in consumer preferences toward healthier and more transparent food options. Forecasted to reach USD 59.45 billion in 2025 and USD 169.21 billion by 2032, the market is expanding at a CAGR of 16.1%. Clean label ingredients emphasize natural, minimally processed, and easily recognizable components, aligning with consumer demand for simple and authentic food. This trend underscores an increasing focus on health, sustainability, and ethical consumption, encouraging manufacturers to innovate and adopt cleaner practices to meet evolving market expectations.
Market Overview
Clean label ingredients refer to food and beverage components that are natural, minimally processed, and easily identifiable. These ingredients cater to the rising consumer demand for simple, authentic, and health-oriented food products. This trend coincides with an increased focus on ethical consumption and sustainability, compelling manufacturers to adopt practices aligned with consumer values.
The clean label ingredients market reflects a transformative shift in food production and consumption, driven by health-conscious consumers and supportive regulations. With a promising outlook for innovation and collaboration, the market is expected to redefine global food standards, offering tremendous growth opportunities for businesses aiming to deliver transparent and ethical food solutions.
Key Drivers of Growth
1. Consumer Demand for Simplicity and Transparency:
-
Shoppers increasingly seek products with clear, comprehensible labels free from synthetic chemicals, preservatives, and artificial additives.
Regulatory frameworks promoting label clarity further encourage manufacturers to align with these consumer preferences.
2. Advancing Regulations:
-
Governments globally are introducing stringent labeling guidelines, pushing for cleaner and more transparent ingredient disclosures.
3. Product Innovation:
-
Investment in research and development has enabled manufacturers to introduce natural substitutes that maintain taste, quality, and consumer appeal, broadening the range of clean-label offerings.
Business Potential
1. Diversifying Product Lines:
-
Companies have significant opportunities to expand their portfolios with organic, non-GMO, and allergen-free products, catering to niche markets.
The introduction of innovative products can strengthen brand positioning and boost consumer retention.
2. Collaborative Ventures:
-
Partnerships with research entities and startups foster innovation, enabling companies to stay ahead of market trends and extend their market reach.
Joint ventures also allow for enhanced distribution channels and increased market penetration.
Regional Performance
1. Europe Dominates:
-
The region leads the global market with its rigorous regulatory standards and growing demand for organic and natural food options.
European consumers' emphasis on sustainable and ethical choices fosters continuous innovation in the industry.
2. South Asia & Pacific on the Rise:
-
This region is emerging as the fastest-growing market due to increasing consumer awareness and disposable incomes, driving demand for premium, health-centric products.
Challenges in the Market
Supply Chain Risks:
-
The market faces challenges from disruptions caused by geopolitical issues, natural disasters, and global health crises, affecting the steady supply of raw materials.
Businesses must focus on creating diversified and robust supply chains to ensure reliability.
Competitive Analysis
Leading companies in the clean label ingredients market are focusing on innovation, sustainability, and consumer engagement to solidify their positions. Key players include:
- Cargill
- Ingredion Incorporated
- Koninklijke DSM N.V.
- Archer Daniels Midland Company
- Kerry Group PLC
- Tate & Lyle PLC
Market Segmentation
By Type:
- Natural Colors
- Natural Flavors
- Fruit & Vegetable Ingredients
- Starch & Sweeteners
- Flours
- Malt
- Natural Preservatives
- Fermentation Ingredients
- Oils & Shortenings
- Emulsifiers
By Application:
- Dry Form Products
- Cereals & Snacks
- Bakery Products
- Beverages
- Prepared Food/Ready Meals & Processed Foods
- Dairy & Frozen Desserts
- Others
By Form:
- Dry
- Liquid
By Region:
- North America
- Europe
- Asia Pacific
- South Asia & Oceania
- Latin America
- Middle East & Africa
Table of Contents
1. Executive Summary
- 1.1. Global Clean Label Ingredients Market Snapshot
- 1.2. Future Projections
- 1.3. Key Market Trends
- 1.4. Regional Snapshot, by Value, 2024
- 1.5. Analyst Recommendations
2. Market Overview
- 2.1. Market Definitions and Segmentations
- 2.2. Market Dynamics
- 2.2.1. Drivers
- 2.2.2. Restraints
- 2.2.3. Market Opportunities
- 2.3. Value Chain Analysis
- 2.4. Porter's Five Forces Analysis
- 2.5. COVID-19 Impact Analysis
- 2.5.1. Supply
- 2.5.2. Demand
- 2.6. Impact of Ukraine-Russia Conflict
- 2.7. Economic Overview
- 2.7.1. World Economic Projections
- 2.8. PESTLE Analysis
3. Global Clean Label Ingredients Market Outlook, 2019 - 2032
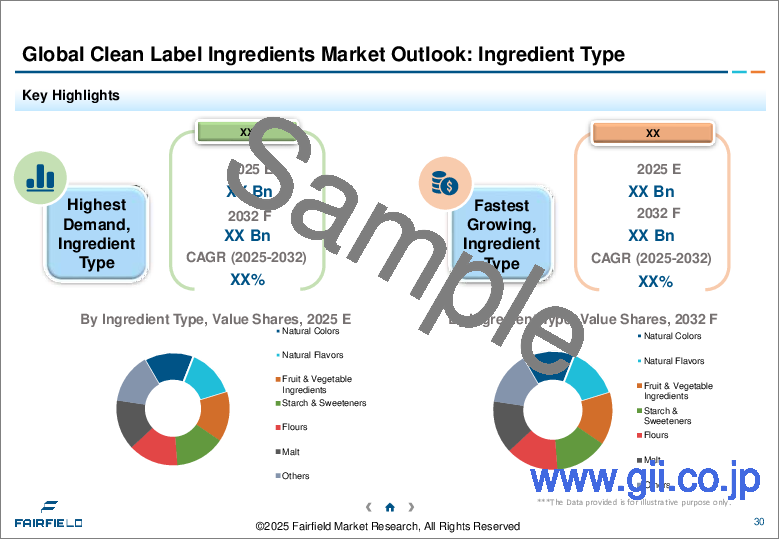
- 3.1. Global Clean Label Ingredients Market Outlook, by Type, Value (US$ Bn), 2019 - 2032
- 3.1.1. Key Highlights
- 3.1.1.1. Natural Colors
- 3.1.1.2. Natural Flavors
- 3.1.1.3. Fruits and Vegetable Ingredients
- 3.1.1.4. Starch & Sweeteners
- 3.1.1.5. Flours
- 3.1.1.6. Malt
- 3.1.1.7. Natural Preservatives
- 3.1.1.8. Fermentation Ingredients
- 3.1.1.9. Oils & Shortenings
- 3.1.1.10. Emulsifiers
- 3.1.1. Key Highlights
- 3.2. Global Clean Label Ingredients Market Outlook, by Application, Value (US$ Bn), 2019 - 2032
- 3.2.1. Key Highlights
- 3.2.1.1. Dry Form Products
- 3.2.1.2. Cereals & Snacks
- 3.2.1.3. Bakery Products
- 3.2.1.4. Beverages
- 3.2.1.5. Prepared Foods/ Ready Meals and Processed Foods
- 3.2.1.6. Dairy & Frozen Desserts
- 3.2.1.7. Others
- 3.2.1. Key Highlights
- 3.3. Global Clean Label Ingredients Market Outlook, by Form, Value (US$ Bn), 2019 - 2032
- 3.3.1. Key Highlights
- 3.3.1.1. Dry
- 3.3.1.2. Liquid
- 3.3.1. Key Highlights
- 3.4. Global Clean Label Ingredients Market Outlook, by Region, Value (US$ Bn), 2019 - 2032
- 3.4.1. Key Highlights
- 3.4.1.1. North America
- 3.4.1.2. Europe
- 3.4.1.3. Asia Pacific
- 3.4.1.4. Latin America
- 3.4.1.5. Middle East & Africa
- 3.4.1. Key Highlights
4. North America Clean Label Ingredients Market Outlook, 2019 - 2032
- 4.1. North America Clean Label Ingredients Market Outlook, by Type, Value (US$ Bn), 2019 - 2032
- 4.1.1. Key Highlights
- 4.1.1.1. Natural Colors
- 4.1.1.2. Natural Flavors
- 4.1.1.3. Fruits and Vegetable Ingredients
- 4.1.1.4. Starch & Sweeteners
- 4.1.1.5. Flours
- 4.1.1.6. Malt
- 4.1.1.7. Natural Preservatives
- 4.1.1.8. Fermentation Ingredients
- 4.1.1.9. Oils & Shortenings
- 4.1.1.10. Emulsifiers
- 4.1.1. Key Highlights
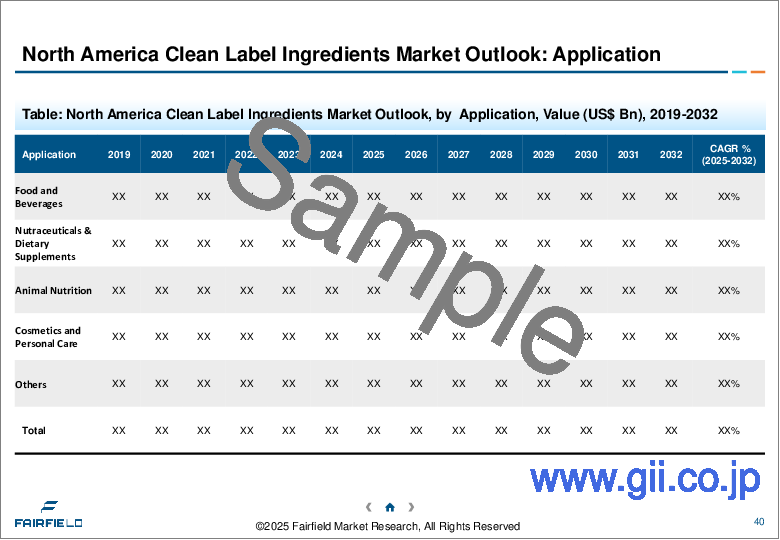
- 4.2. North America Clean Label Ingredients Market Outlook, by Application, Value (US$ Bn), 2019 - 2032
- 4.2.1. Key Highlights
- 4.2.1.1. Dry Form Products
- 4.2.1.2. Cereals & Snacks
- 4.2.1.3. Bakery Products
- 4.2.1.4. Beverages
- 4.2.1.5. Prepared Foods/ Ready Meals and Processed Foods
- 4.2.1.6. Dairy & Frozen Desserts
- 4.2.1.7. Others
- 4.2.1. Key Highlights
- 4.3. North America Clean Label Ingredients Market Outlook, by Form, Value (US$ Bn), 2019 - 2032
- 4.3.1. Key Highlights
- 4.3.1.1. Dry
- 4.3.1.2. Liquid
- 4.3.2. BPS Analysis/Market Attractiveness Analysis
- 4.3.1. Key Highlights
- 4.4. North America Clean Label Ingredients Market Outlook, by Country, Value (US$ Bn), 2019 - 2032
- 4.4.1. Key Highlights
- 4.4.1.1. U.S. Clean Label Ingredients Market by Type, Value (US$ Bn), 2019 - 2032
- 4.4.1.2. U.S. Clean Label Ingredients Market by Application, Value (US$ Bn), 2019 - 2032
- 4.4.1.3. U.S. Clean Label Ingredients Market by Form, Value (US$ Bn), 2019 - 2032
- 4.4.1.4. Canada Clean Label Ingredients Market by Type, Value (US$ Bn), 2019 - 2032
- 4.4.1.5. Canada Clean Label Ingredients Market by Application, Value (US$ Bn), 2019 - 2032
- 4.4.1.6. Canada Clean Label Ingredients Market by Form, Value (US$ Bn), 2019 - 2032
- 4.4.2. BPS Analysis/Market Attractiveness Analysis
- 4.4.1. Key Highlights
5. Europe Clean Label Ingredients Market Outlook, 2019 - 2032
- 5.1. Europe Clean Label Ingredients Market Outlook, by Type, Value (US$ Bn), 2019 - 2032
- 5.1.1. Key Highlights
- 5.1.1.1. Natural Colors
- 5.1.1.2. Natural Flavors
- 5.1.1.3. Fruits and Vegetable Ingredients
- 5.1.1.4. Starch & Sweeteners
- 5.1.1.5. Flours
- 5.1.1.6. Malt
- 5.1.1.7. Natural Preservatives
- 5.1.1.8. Fermentation Ingredients
- 5.1.1.9. Oils & Shortenings
- 5.1.1.10. Emulsifiers
- 5.1.1. Key Highlights
- 5.2. Europe Clean Label Ingredients Market Outlook, by Application, Value (US$ Bn), 2019 - 2032
- 5.2.1. Key Highlights
- 5.2.1.1. Dry Form Products
- 5.2.1.2. Cereals & Snacks
- 5.2.1.3. Bakery Products
- 5.2.1.4. Beverages
- 5.2.1.5. Prepared Foods/ Ready Meals and Processed Foods
- 5.2.1.6. Dairy & Frozen Desserts
- 5.2.1.7. Others
- 5.2.1. Key Highlights
- 5.3. Europe Clean Label Ingredients Market Outlook, by Form, Value (US$ Bn), 2019 - 2032
- 5.3.1. Key Highlights
- 5.3.1.1. Dry
- 5.3.1.2. Liquid
- 5.3.2. BPS Analysis/Market Attractiveness Analysis
- 5.3.1. Key Highlights
- 5.4. Europe Clean Label Ingredients Market Outlook, by Country, Value (US$ Bn), 2019 - 2032
- 5.4.1. Key Highlights
- 5.4.1.1. Germany Clean Label Ingredients Market by Type, Value (US$ Bn), 2019 - 2032
- 5.4.1.2. Germany Clean Label Ingredients Market by Application, Value (US$ Bn), 2019 - 2032
- 5.4.1.3. Germany Clean Label Ingredients Market by Form, Value (US$ Bn), 2019 - 2032
- 5.4.1.4. U.K. Clean Label Ingredients Market by Type, Value (US$ Bn), 2019 - 2032
- 5.4.1.5. U.K. Clean Label Ingredients Market by Application, Value (US$ Bn), 2019 - 2032
- 5.4.1.6. U.K. Clean Label Ingredients Market by Form, Value (US$ Bn), 2019 - 2032
- 5.4.1.7. France Clean Label Ingredients Market by Type, Value (US$ Bn), 2019 - 2032
- 5.4.1.8. France Clean Label Ingredients Market by Application, Value (US$ Bn), 2019 - 2032
- 5.4.1.9. France Clean Label Ingredients Market by Form, Value (US$ Bn), 2019 - 2032
- 5.4.1.10. Italy Clean Label Ingredients Market by Type, Value (US$ Bn), 2019 - 2032
- 5.4.1.11. Italy Clean Label Ingredients Market by Application, Value (US$ Bn), 2019 - 2032
- 5.4.1.12. Italy Clean Label Ingredients Market by Form, Value (US$ Bn), 2019 - 2032
- 5.4.1.13. Turkey Clean Label Ingredients Market by Type, Value (US$ Bn), 2019 - 2032
- 5.4.1.14. Turkey Clean Label Ingredients Market by Application, Value (US$ Bn), 2019 - 2032
- 5.4.1.15. Turkey Clean Label Ingredients Market by Form, Value (US$ Bn), 2019 - 2032
- 5.4.1.16. Russia Clean Label Ingredients Market by Type, Value (US$ Bn), 2019 - 2032
- 5.4.1.17. Russia Clean Label Ingredients Market by Application, Value (US$ Bn), 2019 - 2032
- 5.4.1.18. Russia Clean Label Ingredients Market by Form, Value (US$ Bn), 2019 - 2032
- 5.4.1.19. Rest of Europe Clean Label Ingredients Market by Type, Value (US$ Bn), 2019 - 2032
- 5.4.1.20. Rest of Europe Clean Label Ingredients Market by Application, Value (US$ Bn), 2019 - 2032
- 5.4.1.21. Rest of Europe Clean Label Ingredients Market by Form, Value (US$ Bn), 2019 - 2032
- 5.4.2. BPS Analysis/Market Attractiveness Analysis
- 5.4.1. Key Highlights
6. Asia Pacific Clean Label Ingredients Market Outlook, 2019 - 2032
- 6.1. Asia Pacific Clean Label Ingredients Market Outlook, by Type, Value (US$ Bn), 2019 - 2032
- 6.1.1. Key Highlights
- 6.1.1.1. Natural Colors
- 6.1.1.2. Natural Flavors
- 6.1.1.3. Fruits and Vegetable Ingredients
- 6.1.1.4. Starch & Sweeteners
- 6.1.1.5. Flours
- 6.1.1.6. Malt
- 6.1.1.7. Natural Preservatives
- 6.1.1.8. Fermentation Ingredients
- 6.1.1.9. Oils & Shortenings
- 6.1.1.10. Emulsifiers
- 6.1.1. Key Highlights
- 6.2. Asia Pacific Clean Label Ingredients Market Outlook, by Application, Value (US$ Bn), 2019 - 2032
- 6.2.1. Key Highlights
- 6.2.1.1. Dry Form Products
- 6.2.1.2. Cereals & Snacks
- 6.2.1.3. Bakery Products
- 6.2.1.4. Beverages
- 6.2.1.5. Prepared Foods/ Ready Meals and Processed Foods
- 6.2.1.6. Dairy & Frozen Desserts
- 6.2.1.7. Others
- 6.2.1. Key Highlights
- 6.3. Asia Pacific Clean Label Ingredients Market Outlook, by Form, Value (US$ Bn), 2019 - 2032
- 6.3.1. Key Highlights
- 6.3.1.1. Dry
- 6.3.1.2. Liquid
- 6.3.2. BPS Analysis/Market Attractiveness Analysis
- 6.3.1. Key Highlights
- 6.4. Asia Pacific Clean Label Ingredients Market Outlook, by Country, Value (US$ Bn), 2019 - 2032
- 6.4.1. Key Highlights
- 6.4.1.1. China Clean Label Ingredients Market by Type, Value (US$ Bn), 2019 - 2032
- 6.4.1.2. China Clean Label Ingredients Market by Application, Value (US$ Bn), 2019 - 2032
- 6.4.1.3. China Clean Label Ingredients Market by Form, Value (US$ Bn), 2019 - 2032
- 6.4.1.4. Japan Clean Label Ingredients Market by Type, Value (US$ Bn), 2019 - 2032
- 6.4.1.5. Japan Clean Label Ingredients Market by Application, Value (US$ Bn), 2019 - 2032
- 6.4.1.6. Japan Clean Label Ingredients Market by Form, Value (US$ Bn), 2019 - 2032
- 6.4.1.7. South Korea Clean Label Ingredients Market by Type, Value (US$ Bn), 2019 - 2032
- 6.4.1.8. South Korea Clean Label Ingredients Market by Application, Value (US$ Bn), 2019 - 2032
- 6.4.1.9. South Korea Clean Label Ingredients Market by Form, Value (US$ Bn), 2019 - 2032
- 6.4.1.10. India Clean Label Ingredients Market by Type, Value (US$ Bn), 2019 - 2032
- 6.4.1.11. India Clean Label Ingredients Market by Application, Value (US$ Bn), 2019 - 2032
- 6.4.1.12. India Clean Label Ingredients Market by Form, Value (US$ Bn), 2019 - 2032
- 6.4.1.13. Southeast Asia Clean Label Ingredients Market by Type, Value (US$ Bn), 2019 - 2032
- 6.4.1.14. Southeast Asia Clean Label Ingredients Market by Application, Value (US$ Bn), 2019 - 2032
- 6.4.1.15. Southeast Asia Clean Label Ingredients Market by Form, Value (US$ Bn), 2019 - 2032
- 6.4.1.16. Rest of Asia Pacific Clean Label Ingredients Market by Type, Value (US$ Bn), 2019 - 2032
- 6.4.1.17. Rest of Asia Pacific Clean Label Ingredients Market by Application, Value (US$ Bn), 2019 - 2032
- 6.4.1.18. Rest of Asia Pacific Clean Label Ingredients Market by Form, Value (US$ Bn), 2019 - 2032
- 6.4.2. BPS Analysis/Market Attractiveness Analysis
- 6.4.1. Key Highlights
7. Latin America Clean Label Ingredients Market Outlook, 2019 - 2032
- 7.1. Latin America Clean Label Ingredients Market Outlook, by Type, Value (US$ Bn), 2019 - 2032
- 7.1.1. Key Highlights
- 7.1.1.1. Natural Colors
- 7.1.1.2. Natural Flavors
- 7.1.1.3. Fruits and Vegetable Ingredients
- 7.1.1.4. Starch & Sweeteners
- 7.1.1.5. Flours
- 7.1.1.6. Malt
- 7.1.1.7. Natural Preservatives
- 7.1.1.8. Fermentation Ingredients
- 7.1.1.9. Oils & Shortenings
- 7.1.1.10. Emulsifiers
- 7.1.1. Key Highlights
- 7.2. Latin America Clean Label Ingredients Market Outlook, by Application, Value (US$ Bn), 2019 - 2032
- 7.2.1.1. Dry Form Products
- 7.2.1.2. Cereals & Snacks
- 7.2.1.3. Bakery Products
- 7.2.1.4. Beverages
- 7.2.1.5. Prepared Foods/ Ready Meals and Processed Foods
- 7.2.1.6. Dairy & Frozen Desserts
- 7.2.1.7. Others
- 7.3. Latin America Clean Label Ingredients Market Outlook, by Form, Value (US$ Bn), 2019 - 2032
- 7.3.1. Key Highlights
- 7.3.1.1. Dry
- 7.3.1.2. Liquid
- 7.3.2. BPS Analysis/Market Attractiveness Analysis
- 7.3.1. Key Highlights
- 7.4. Latin America Clean Label Ingredients Market Outlook, by Country, Value (US$ Bn), 2019 - 2032
- 7.4.1. Key Highlights
- 7.4.1.1. Brazil Clean Label Ingredients Market by Type, Value (US$ Bn), 2019 - 2032
- 7.4.1.2. Brazil Clean Label Ingredients Market by Application, Value (US$ Bn), 2019 - 2032
- 7.4.1.3. Brazil Clean Label Ingredients Market by Form, Value (US$ Bn), 2019 - 2032
- 7.4.1.4. Mexico Clean Label Ingredients Market by Type, Value (US$ Bn), 2019 - 2032
- 7.4.1.5. Mexico Clean Label Ingredients Market by Application, Value (US$ Bn), 2019 - 2032
- 7.4.1.6. Mexico Clean Label Ingredients Market by Form, Value (US$ Bn), 2019 - 2032
- 7.4.1.7. Argentina Clean Label Ingredients Market by Type, Value (US$ Bn), 2019 - 2032
- 7.4.1.8. Argentina Clean Label Ingredients Market by Application, Value (US$ Bn), 2019 - 2032
- 7.4.1.9. Argentina Clean Label Ingredients Market by Form, Value (US$ Bn), 2019 - 2032
- 7.4.1.10. Rest of Latin America Clean Label Ingredients Market by Type, Value (US$ Bn), 2019 - 2032
- 7.4.1.11. Rest of Latin America Clean Label Ingredients Market by Application, Value (US$ Bn), 2019 - 2032
- 7.4.1.12. Rest of Latin America Clean Label Ingredients Market by Form, Value (US$ Bn), 2019 - 2032
- 7.4.2. BPS Analysis/Market Attractiveness Analysis
- 7.4.1. Key Highlights
8. Middle East & Africa Clean Label Ingredients Market Outlook, 2019 - 2032
- 8.1. Middle East & Africa Clean Label Ingredients Market Outlook, by Type, Value (US$ Bn), 2019 - 2032
- 8.1.1. Key Highlights
- 8.1.1.1. Natural Colors
- 8.1.1.2. Natural Flavors
- 8.1.1.3. Fruits and Vegetable Ingredients
- 8.1.1.4. Starch & Sweeteners
- 8.1.1.5. Flours
- 8.1.1.6. Malt
- 8.1.1.7. Natural Preservatives
- 8.1.1.8. Fermentation Ingredients
- 8.1.1.9. Oils & Shortenings
- 8.1.1.10. Emulsifiers
- 8.1.1. Key Highlights
- 8.2. Middle East & Africa Clean Label Ingredients Market Outlook, by Application, Value (US$ Bn), 2019 - 2032
- 8.2.1. Key Highlights
- 8.2.1.1. Dry Form Products
- 8.2.1.2. Cereals & Snacks
- 8.2.1.3. Bakery Products
- 8.2.1.4. Beverages
- 8.2.1.5. Prepared Foods/ Ready Meals and Processed Foods
- 8.2.1.6. Dairy & Frozen Desserts
- 8.2.1.7. Others
- 8.2.1. Key Highlights
- 8.3. Middle East & Africa Clean Label Ingredients Market Outlook, by Form, Value (US$ Bn), 2019 - 2032
- 8.3.1. Key Highlights
- 8.3.1.1. Dry
- 8.3.1.2. Liquid
- 8.3.2. BPS Analysis/Market Attractiveness Analysis
- 8.3.1. Key Highlights
- 8.4. Middle East & Africa Clean Label Ingredients Market Outlook, by Country, Value (US$ Bn), 2019 - 2032
- 8.4.1. Key Highlights
- 8.4.1.1. GCC Clean Label Ingredients Market by Type, Value (US$ Bn), 2019 - 2032
- 8.4.1.2. GCC Clean Label Ingredients Market by Application, Value (US$ Bn), 2019 - 2032
- 8.4.1.3. GCC Clean Label Ingredients Market by Form, Value (US$ Bn), 2019 - 2032
- 8.4.1.4. South Africa Clean Label Ingredients Market by Type, Value (US$ Bn), 2019 - 2032
- 8.4.1.5. South Africa Clean Label Ingredients Market by Application, Value (US$ Bn), 2019 - 2032
- 8.4.1.6. South Africa Clean Label Ingredients Market by Form, Value (US$ Bn), 2019 - 2032
- 8.4.1.7. Egypt Clean Label Ingredients Market by Type, Value (US$ Bn), 2019 - 2032
- 8.4.1.8. Egypt Clean Label Ingredients Market by Application, Value (US$ Bn), 2019 - 2032
- 8.4.1.9. Egypt Clean Label Ingredients Market by Form, Value (US$ Bn), 2019 - 2032
- 8.4.1.10. Nigeria Clean Label Ingredients Market by Type, Value (US$ Bn), 2019 - 2032
- 8.4.1.11. Nigeria Clean Label Ingredients Market by Application, Value (US$ Bn), 2019 - 2032
- 8.4.1.12. Nigeria Clean Label Ingredients Market by Form, Value (US$ Bn), 2019 - 2032
- 8.4.1.13. Rest of Middle East & Africa Clean Label Ingredients Market by Type, Value (US$ Bn), 2019 - 2032
- 8.4.1.14. Rest of Middle East & Africa Clean Label Ingredients Market by Application, Value (US$ Bn), 2019 - 2032
- 8.4.1.15. Rest of Middle East & Africa Clean Label Ingredients Market by Form, Value (US$ Bn), 2019 - 2032
- 8.4.2. BPS Analysis/Market Attractiveness Analysis
- 8.4.1. Key Highlights
9. Competitive Landscape
- 9.1. By Form vs by Application Heat map
- 9.2. Manufacturer vs by Application Heatmap
- 9.3. Company Market Share Analysis, 2024
- 9.4. Competitive Dashboard
- 9.5. Company Profiles
- 9.5.1. Cargill
- 9.5.1.1. Company Overview
- 9.5.1.2. Product Portfolio
- 9.5.1.3. Financial Overview
- 9.5.1.4. Business Strategies and Development
- 9.5.2. Ingredion Incorporated
- 9.5.3. Koninklijke DSM N.V.
- 9.5.4. E.I. Du Pont De Nemours and Company
- 9.5.5. Archer Daniels Midland Company
- 9.5.6. Kerry Group PLC
- 9.5.7. Tate & Lyle PLC
- 9.5.8. Daikin America
- 9.5.9. Fluoryx
- 9.5.10. Wilshire Technologies
- 9.5.11. TCI Chemicals
- 9.5.1. Cargill
10. Appendix
- 10.1. Research Methodology
- 10.2. Report Assumptions
- 10.3. Acronyms and Abbreviations

