|
|
市場調査レポート
商品コード
1344578
再生可能材料および持続可能材料の世界市場:2024-2034年The Global Market for Renewable and Sustainable Materials 2024-2034 |
||||||
|
|
|||||||
|
|||||||

| 再生可能材料および持続可能材料の世界市場:2024-2034年 |
|
出版日: 2023年11月07日
発行: Future Markets, Inc.
ページ情報: 英文 1742 Pages,429 Tables, 563 Figures
納期: 即納可能
|

全表示
- 概要
- 図表
- 目次
化石燃料を原料とする化学物質や材料に代わる、再生可能で持続可能な材料への需要が急速に高まっています。建設、自動車、エネルギー、繊維などの分野では、再生可能で持続可能な材料を使用することにより、バイオベース製品の新市場が創出されるだけでなく、排出量、製造エネルギー要件、製造コスト、廃棄物が大幅に削減されます。主な市場促進要因としては、持続可能性に対する企業や政府の取り組みの高まり、自然エネルギーを優遇する規制、消費者の嗜好の変化などが挙げられます。
当レポートでは、世界の再生可能材料および持続可能材料の市場を調査し、植物由来原料 (デンプン、砂糖作物、リグノセルロース、油) 、廃棄物 (食品、農業、林業、自治体) 、微生物、鉱物資源を含むバイオベース原料の詳細分析、バイオベースのポリマー、プラスチック、燃料、天然繊維、リグニン、持続可能コーティング剤&塗料の市場規模・製造能力の予測、CCUS (炭素回収・利用・貯蔵) の最新技術と市場機会のレビュー、市場課題、関連政策、プロジェクト、主要企業プロファイルなどをまとめています。
目次
第1章 調査手法
第2章 バイオベース原料および中間体市場
- バイオ精製所
- バイオベース原料と土地利用
- 植物由来
- デンプン
- 砂糖作物
- リグノセルロース系バイオマス
- 植物油
- 非食用牛乳
- 廃棄物
- 食品廃棄物
- 農業廃棄物
- 林業廃棄物
- 養殖・漁業廃棄物
- 都市固形廃棄物
- 産業廃棄物
- 廃油
- 微生物・ミネラル
- 微細藻類
- 大型藻類
- ミネラル
- ガス状
- バイオガス
- 合成ガス
- オフガス- 発酵CO2、CO
- 企業プロファイル (105企業プロファイル)
第3章 バイオベースプラスチックおよびポリマー市場
- バイオベースまたは再生可能プラスチック
- ドロップインバイオベースプラスチック
- 新しいバイオベースプラスチック
- 生分解性で堆肥化可能なプラスチック
- 生分解性
- 堆肥化可能性
- タイプ
- 主要企業
- 合成バイオベースポリマー
- ポリ乳酸 (バイオPLA)
- ポリエチレンテレフタレート (バイオPET)
- ポリトリメチレンテレフタレート (バイオPTT)
- ポリエチレンフラノエート (Bio-PEF)
- ポリアミド (Bio-PA)
- ポリ (アジピン酸ブチレン-コ-テレフタレート) (バイオ-PBAT)
- ポリブチレンサクシネート (PBS) およびコポリマー
- ポリエチレン (バイオPE)
- ポリプロピレン (バイオPP)
- 天然バイオベースポリマー
- ポリヒドロキシアルカノエート (PHA)
- セルロース
- タンパク質ベースのバイオプラスチック
- 藻類と菌類
- キトサン
- バイオベースプラスチックおよび生分解性プラスチックの製造:地域別
- 北米
- 欧州
- アジア太平洋
- ラテンアメリカ
- バイオプラスチックおよびバイオポリマー市場の分類
- 包装
- 消費者製品
- 自動車
- 建築・建設
- テキスタイル
- エレクトロニクス
- 農業・園芸
- 天然繊維
- 天然繊維の製法、マトリックス材料、用途
- 天然繊維の利点
- 市販の次世代天然繊維製品
- 次世代天然繊維の市場促進要因
- 課題
- 植物性 (セルロース、リグノセルロース)
- 動物性 (繊維状タンパク質)
- 天然繊維の市場
- 天然繊維の世界の生産量
- リグニン
- リグニンの製造プロセス
- リグニンの市場
- バイオプラスチックおよびバイオポリマーの企業プロファイル (503の企業プロファイル)
第4章 バイオベース燃料市場
- 化石燃料との比較
- 循環経済における役割
- 市場促進要因
- 市場の課題
- 液体バイオ燃料市場
- SWOT分析
- バイオ燃料コストのタイプ別比較
- タイプ
- 固体バイオ燃料
- 液体バイオ燃料
- 気体バイオ燃料
- 従来型バイオ燃料
- 先進バイオ燃料
- 原料
- 第1世代 (1-G)
- 第2世代 (2-G)
- 第3世代 (3-G)
- 第4世代 (4-G)
- 世代別のメリット・デメリット
- エネルギー作物
- 農業残渣
- ふん尿、下水汚泥、有機性廃棄物
- 林業および木材廃棄物
- 原料コスト
- 炭化水素バイオ燃料
- バイオディーゼル
- 再生可能ディーゼル
- バイオ航空燃料 (バイオジェット燃料、持続可能航空燃料、再生可能ジェット燃料または航空バイオ燃料)
- バイオナフサ
- 概要
- アルコール燃料
- バイオマス系ガス
- バイオ燃料のためのケミカルリサイクル
- 電気燃料 (E燃料)
- 藻類由来バイオ燃料
- グリーンアンモニア
- バイオオイル (熱分解油)
- ごみ由来燃料 (RDF)
- 企業プロファイル (164企業プロファイル)
第5章 バイオベースの塗料およびコーティング剤市場
- 世界の塗料およびコーティング剤市場
- バイオベースの塗料&コーティング剤
- バイオベースの塗料&コーティング剤の課題
- バイオベースコーティング剤の材料対ぴ
- バイオベースの塗料およびコーティング剤の市場
- バイオベースの塗料およびコーティング剤の企業プロファイル (130の企業プロファイル)
第6章 CCUS (二酸化炭素回収・有効利用・貯留) 市場
- 二酸化炭素の主な排出源
- 商品としてのCO2
- 気候変動目標の達成
- 市場促進要因と動向
- 現在の市場と今後の見通し
- CCUS業界の発展
- CCUSへの投資
- 政府によるCCUSの取り組み
- マーケットマップ
- 商業用CCUS施設とプロジェクト
- CCUSのバリューチェーン
- CCUSの主な障壁
- CCUSとは何か
- CO2の輸送
- コスト
- カーボンクレジット
- 炭素回収
- 炭素有効利用
- 炭素貯留
- 企業プロファイル (243企業プロファイル)
第7章 先進ケミカルリサイクル
- リサイクル技術の分類
- プラスチックのリサイクル
- 先進リサイクル市場
- 先進リサイクル技術
- 企業プロファイル (143企業プロファイル)
第8章 参考文献
List of Tables
- Table 1. Plant-based feedstocks and biochemicals produced
- Table 2. Waste-based feedstocks and biochemicals produced
- Table 3. Microbial and mineral-based feedstocks and biochemicals produced
- Table 4. Common starch sources that can be used as feedstocks for producing biochemicals
- Table 5. Common lysine sources that can be used as feedstocks for producing biochemicals
- Table 6. Applications of lysine as a feedstock for biochemicals
- Table 7. HDMA sources that can be used as feedstocks for producing biochemicals
- Table 8. Applications of bio-based HDMA
- Table 9. Biobased feedstocks that can be used to produce 1,5-diaminopentane (DA5)
- Table 10. Applications of DN5
- Table 11. Biobased feedstocks for isosorbide
- Table 12. Applications of bio-based isosorbide
- Table 13. Lactide applications
- Table 14. Biobased feedstock sources for itaconic acid
- Table 15. Applications of bio-based itaconic acid
- Table 16. Biobased feedstock sources for 3-HP
- Table 17. Applications of 3-HP
- Table 18. Applications of bio-based acrylic acid
- Table 19. Applications of bio-based 1,3-Propanediol (1,3-PDO)
- Table 20. Biobased feedstock sources for Succinic acid
- Table 21. Applications of succinic acid
- Table 22. Applications of bio-based 1,4-Butanediol (BDO)
- Table 23. Applications of bio-based Tetrahydrofuran (THF)
- Table 24. Applications of bio-based caprolactam
- Table 25. Biobased feedstock sources for isobutanol
- Table 26. Applications of bio-based isobutanol
- Table 27. Applications of bio-based 1,4-Butanediol
- Table 28. Biobased feedstock sources for p-Xylene
- Table 29. Applications of bio-based p-Xylene
- Table 30. Applications of bio-based Terephthalic acid (TPA)
- Table 31. Biobased feedstock sources for 1,3 Proppanediol
- Table 32. Applications of bio-based 1,3 Proppanediol
- Table 33. Biobased feedstock sources for MEG
- Table 34. Applications of bio-based MEG
- Table 35. Biobased MEG producers capacities
- Table 36. Biobased feedstock sources for ethanol
- Table 37. Applications of bio-based ethanol
- Table 38. Applications of bio-based ethylene
- Table 39. Applications of bio-based propylene
- Table 40. Applications of bio-based vinyl chloride
- Table 41. Applications of bio-based Methly methacrylate
- Table 42. Applications of bio-based aniline
- Table 43. Applications of biobased fructose
- Table 44. Applications of bio-based 5-Hydroxymethylfurfural (5-HMF)
- Table 45. Applications of 5-(Chloromethyl)furfural (CMF)
- Table 46. Applications of Levulinic acid
- Table 47. Markets and applications for bio-based FDME
- Table 48. Applications of FDCA
- Table 49. Markets and applications for bio-based levoglucosenone
- Table 50. Biochemicals derived from hemicellulose
- Table 51. markets and applications for bio-based hemicellulose
- Table 52. Markets and applications for bio-based furfuryl alcohol
- Table 53. Commercial and pre-commercial biorefinery lignin production facilities and processes
- Table 54. Lignin aromatic compound products
- Table 55. Prices of benzene, toluene, xylene and their derivatives
- Table 56. Lignin products in polymeric materials
- Table 57. Application of lignin in plastics and composites
- Table 58. Markets and applications for bio-based glycerol
- Table 59. Markets and applications for Bio-based MPG
- Table 60. Markets and applications: Bio-based ECH
- Table 61. Mineral source products and applications
- Table 62. Type of biodegradation
- Table 63. Advantages and disadvantages of biobased plastics compared to conventional plastics
- Table 64. Types of Bio-based and/or Biodegradable Plastics, applications
- Table 65. Key market players by Bio-based and/or Biodegradable Plastic types
- Table 66. Polylactic acid (PLA) market analysis-manufacture, advantages, disadvantages and applications
- Table 67. Lactic acid producers and production capacities
- Table 68. PLA producers and production capacities
- Table 69. Planned PLA capacity expansions in China
- Table 70. Bio-based Polyethylene terephthalate (Bio-PET) market analysis- manufacture, advantages, disadvantages and applications
- Table 71. Bio-based Polyethylene terephthalate (PET) producers and production capacities,
- Table 72. Polytrimethylene terephthalate (PTT) market analysis-manufacture, advantages, disadvantages and applications
- Table 73. Production capacities of Polytrimethylene terephthalate (PTT), by leading producers
- Table 74. Polyethylene furanoate (PEF) market analysis-manufacture, advantages, disadvantages and applications
- Table 75. PEF vs. PET
- Table 76. FDCA and PEF producers
- Table 77. Bio-based polyamides (Bio-PA) market analysis - manufacture, advantages, disadvantages and applications
- Table 78. Leading Bio-PA producers production capacities
- Table 79. Poly(butylene adipate-co-terephthalate) (PBAT) market analysis- manufacture, advantages, disadvantages and applications
- Table 80. Leading PBAT producers, production capacities and brands
- Table 81. Bio-PBS market analysis-manufacture, advantages, disadvantages and applications
- Table 82. Leading PBS producers and production capacities
- Table 83. Bio-based Polyethylene (Bio-PE) market analysis- manufacture, advantages, disadvantages and applications
- Table 84. Leading Bio-PE producers
- Table 85. Bio-PP market analysis- manufacture, advantages, disadvantages and applications
- Table 86. Leading Bio-PP producers and capacities
- Table 87.Types of PHAs and properties
- Table 88. Comparison of the physical properties of different PHAs with conventional petroleum-based polymers
- Table 89. Polyhydroxyalkanoate (PHA) extraction methods
- Table 90. Polyhydroxyalkanoates (PHA) market analysis
- Table 91. Commercially available PHAs
- Table 92. Markets and applications for PHAs
- Table 93. Applications, advantages and disadvantages of PHAs in packaging
- Table 94. Polyhydroxyalkanoates (PHA) producers
- Table 95. Microfibrillated cellulose (MFC) market analysis-manufacture, advantages, disadvantages and applications
- Table 96. Leading MFC producers and capacities
- Table 97. Synthesis methods for cellulose nanocrystals (CNC)
- Table 98. CNC sources, size and yield
- Table 99. CNC properties
- Table 100. Mechanical properties of CNC and other reinforcement materials
- Table 101. Applications of nanocrystalline cellulose (NCC)
- Table 102. Cellulose nanocrystals analysis
- Table 103: Cellulose nanocrystal production capacities and production process, by producer
- Table 104. Applications of cellulose nanofibers (CNF)
- Table 105. Cellulose nanofibers market analysis
- Table 106. CNF production capacities (by type, wet or dry) and production process, by producer, metric tonnes
- Table 107. Applications of bacterial nanocellulose (BNC)
- Table 108. Types of protein based-bioplastics, applications and companies
- Table 109. Types of algal and fungal based-bioplastics, applications and companies
- Table 110. Overview of alginate-description, properties, application and market size
- Table 111. Companies developing algal-based bioplastics
- Table 112. Overview of mycelium fibers-description, properties, drawbacks and applications
- Table 113. Companies developing mycelium-based bioplastics
- Table 114. Overview of chitosan-description, properties, drawbacks and applications
- Table 115. Global production capacities of biobased and sustainable plastics in 2019-2034, by region, tons
- Table 116. Biobased and sustainable plastics producers in North America
- Table 117. Biobased and sustainable plastics producers in Europe
- Table 118. Biobased and sustainable plastics producers in Asia-Pacific
- Table 119. Biobased and sustainable plastics producers in Latin America
- Table 120. Processes for bioplastics in packaging
- Table 121. Comparison of bioplastics' (PLA and PHAs) properties to other common polymers used in product packaging
- Table 122. Typical applications for bioplastics in flexible packaging
- Table 123. Typical applications for bioplastics in rigid packaging
- Table 124. Types of next-gen natural fibers
- Table 125. Application, manufacturing method, and matrix materials of natural fibers
- Table 126. Typical properties of natural fibers
- Table 127. Commercially available next-gen natural fiber products
- Table 128. Market drivers for natural fibers
- Table 129. Overview of cotton fibers-description, properties, drawbacks and applications
- Table 130. Overview of kapok fibers-description, properties, drawbacks and applications
- Table 131. Overview of luffa fibers-description, properties, drawbacks and applications
- Table 132. Overview of jute fibers-description, properties, drawbacks and applications
- Table 133. Overview of hemp fibers-description, properties, drawbacks and applications
- Table 134. Overview of flax fibers-description, properties, drawbacks and applications
- Table 135. Overview of ramie fibers- description, properties, drawbacks and applications
- Table 136. Overview of kenaf fibers-description, properties, drawbacks and applications
- Table 137. Overview of sisal leaf fibers-description, properties, drawbacks and applications
- Table 138. Overview of abaca fibers-description, properties, drawbacks and applications
- Table 139. Overview of coir fibers-description, properties, drawbacks and applications
- Table 140. Overview of banana fibers-description, properties, drawbacks and applications
- Table 141. Overview of pineapple fibers-description, properties, drawbacks and applications
- Table 142. Overview of rice fibers-description, properties, drawbacks and applications
- Table 143. Overview of corn fibers-description, properties, drawbacks and applications
- Table 144. Overview of switch grass fibers-description, properties and applications
- Table 145. Overview of sugarcane fibers-description, properties, drawbacks and application and market size
- Table 146. Overview of bamboo fibers-description, properties, drawbacks and applications
- Table 147. Overview of mycelium fibers-description, properties, drawbacks and applications
- Table 148. Overview of chitosan fibers-description, properties, drawbacks and applications
- Table 149. Overview of alginate-description, properties, application and market size
- Table 150. Overview of wool fibers-description, properties, drawbacks and applications
- Table 151. Alternative wool materials producers
- Table 152. Overview of silk fibers-description, properties, application and market size
- Table 153. Alternative silk materials producers
- Table 154. Alternative leather materials producers
- Table 155. Next-gen fur producers
- Table 156. Alternative down materials producers
- Table 157. Applications of natural fiber composites
- Table 158. Typical properties of short natural fiber-thermoplastic composites
- Table 159. Properties of non-woven natural fiber mat composites
- Table 160. Properties of aligned natural fiber composites
- Table 161. Properties of natural fiber-bio-based polymer compounds
- Table 162. Properties of natural fiber-bio-based polymer non-woven mats
- Table 163. Natural fibers in the aerospace sector-market drivers, applications and challenges for NF use
- Table 164. Natural fiber-reinforced polymer composite in the automotive market
- Table 165. Natural fibers in the aerospace sector- market drivers, applications and challenges for NF use
- Table 166. Applications of natural fibers in the automotive industry
- Table 167. Natural fibers in the building/construction sector- market drivers, applications and challenges for NF use
- Table 168. Applications of natural fibers in the building/construction sector
- Table 169. Natural fibers in the sports and leisure sector-market drivers, applications and challenges for NF use
- Table 170. Natural fibers in the textiles sector- market drivers, applications and challenges for NF use
- Table 171. Natural fibers in the packaging sector-market drivers, applications and challenges for NF use
- Table 172. Technical lignin types and applications
- Table 173. Classification of technical lignins
- Table 174. Lignin content of selected biomass
- Table 175. Properties of lignins and their applications
- Table 176. Example markets and applications for lignin
- Table 177. Processes for lignin production
- Table 178. Biorefinery feedstocks
- Table 179. Comparison of pulping and biorefinery lignins
- Table 180. Commercial and pre-commercial biorefinery lignin production facilities and processes
- Table 181. Market drivers and trends for lignin
- Table 182. Production capacities of technical lignin producers
- Table 183. Production capacities of biorefinery lignin producers
- Table 184. Estimated consumption of lignin, 2019-2034 (000 MT)
- Table 185. Prices of benzene, toluene, xylene and their derivatives
- Table 186. Application of lignin in plastics and polymers
- Table 187. Lignin-derived anodes in lithium batteries
- Table 188. Application of lignin in binders, emulsifiers and dispersants
- Table 189. Lactips plastic pellets
- Table 190. Oji Holdings CNF products
- Table 191. Market drivers for biofuels
- Table 192. Market challenges for biofuels
- Table 193. Liquid biofuels market 2020-2034, by type and production
- Table 194. Comparison of biofuel costs (USD/liter) 2023, by type
- Table 195. Categories and examples of solid biofuel
- Table 196. Comparison of biofuels and e-fuels to fossil and electricity
- Table 197. Classification of biomass feedstock
- Table 198. Biorefinery feedstocks
- Table 199. Feedstock conversion pathways
- Table 200. First-Generation Feedstocks
- Table 201. Lignocellulosic ethanol plants and capacities
- Table 202. Comparison of pulping and biorefinery lignins
- Table 203. Commercial and pre-commercial biorefinery lignin production facilities and processes
- Table 204. Operating and planned lignocellulosic biorefineries and industrial flue gas-to-ethanol
- Table 205. Properties of microalgae and macroalgae
- Table 206. Yield of algae and other biodiesel crops
- Table 207. Advantages and disadvantages of biofuels, by generation
- Table 208. Biodiesel by generation
- Table 209. Biodiesel production techniques
- Table 210. Summary of pyrolysis technique under different operating conditions
- Table 211. Biomass materials and their bio-oil yield
- Table 212. Biofuel production cost from the biomass pyrolysis process
- Table 213. Properties of vegetable oils in comparison to diesel
- Table 214. Main producers of HVO and capacities
- Table 215. Example commercial Development of BtL processes
- Table 216. Pilot or demo projects for biomass to liquid (BtL) processes
- Table 217. Global biodiesel consumption, 2010-2034 (M litres/year)
- Table 218. Global renewable diesel consumption, to 2033 (M litres/year)
- Table 219. Renewable diesel price ranges
- Table 220. Advantages and disadvantages of Bio-aviation fuel
- Table 221. Production pathways for Bio-aviation fuel
- Table 222. Current and announced Bio-aviation fuel facilities and capacities
- Table 223. Global bio-jet fuel consumption to 2033 (Million litres/year)
- Table 224. Comparison of biogas, biomethane and natural gas
- Table 225. Processes in bioethanol production
- Table 226. Microorganisms used in CBP for ethanol production from biomass lignocellulosic
- Table 227. Ethanol consumption 2010-2034 (million litres)
- Table 228. Biogas feedstocks
- Table 229. Existing and planned bio-LNG production plants
- Table 230. Methods for capturing carbon dioxide from biogas
- Table 231. Comparison of different Bio-H2 production pathways
- Table 232. Markets and applications for biohydrogen
- Table 233. Summary of gasification technologies
- Table 234. Overview of hydrothermal cracking for advanced chemical recycling
- Table 235. Applications of e-fuels, by type
- Table 236. Overview of e-fuels
- Table 237. Benefits of e-fuels
- Table 238. eFuel production facilities, current and planned
- Table 239. Main characteristics of different electrolyzer technologies
- Table 240. Market challenges for e-fuels
- Table 241. E-fuels companies
- Table 242. Algae-derived biofuel producers
- Table 243. Green ammonia projects (current and planned)
- Table 244. Blue ammonia projects
- Table 245. Ammonia fuel cell technologies
- Table 246. Market overview of green ammonia in marine fuel
- Table 247. Summary of marine alternative fuels
- Table 248. Estimated costs for different types of ammonia
- Table 249. Main players in green ammonia
- Table 250. Typical composition and physicochemical properties reported for bio-oils and heavy petroleum-derived oils
- Table 251. Properties and characteristics of pyrolysis liquids derived from biomass versus a fuel oil
- Table 252. Main techniques used to upgrade bio-oil into higher-quality fuels
- Table 253. Markets and applications for bio-oil
- Table 254. Bio-oil producers
- Table 255. Key resource recovery technologies
- Table 256. Markets and end uses for refuse-derived fuels (RDF)
- Table 257. Granbio Nanocellulose Processes
- Table 258. Types of alkyd resins and properties
- Table 259. Market summary for biobased alkyd coatings-raw materials, advantages, disadvantages, applications and producers
- Table 260. Biobased alkyd coating products
- Table 261. Types of polyols
- Table 262. Polyol producers
- Table 263. Biobased polyurethane coating products
- Table 264. Market summary for biobased epoxy resins
- Table 265. Biobased polyurethane coating products
- Table 266. Biobased acrylate resin products
- Table 267. Polylactic acid (PLA) market analysis
- Table 268. PLA producers and production capacities
- Table 269. Polyhydroxyalkanoates (PHA) market analysis
- Table 270.Types of PHAs and properties
- Table 271. Companies developing cellulose nanofibers products in paints and coatings
- Table 272. Edible coatings market summary
- Table 273. Types of protein based-biomaterials, applications and companies
- Table 274. Overview of alginate-description, properties, application and market size
- Table 275. Market revenues for biobased paints and coatings, 2018-2034 (billions USD)
- Table 276. Oji Holdings CNF products
- Table 277. Carbon Capture, Utilisation and Storage (CCUS) market drivers and trends
- Table 278. Carbon capture, usage, and storage (CCUS) industry developments 2020-2023
- Table 279. Demonstration and commercial CCUS facilities in China
- Table 280. Global commercial CCUS facilities-in operation
- Table 281. Global commercial CCUS facilities-under development/construction
- Table 282. Key market barriers for CCUS
- Table 283. CO2 utilization and removal pathways
- Table 284. Approaches for capturing carbon dioxide (CO2) from point sources
- Table 285. CO2 capture technologies
- Table 286. Advantages and challenges of carbon capture technologies
- Table 287. Overview of commercial materials and processes utilized in carbon capture
- Table 288. Methods of CO2 transport
- Table 289. Carbon capture, transport, and storage cost per unit of CO2
- Table 290. Estimated capital costs for commercial-scale carbon capture
- Table 291. Point source examples
- Table 292. Assessment of carbon capture materials
- Table 293. Chemical solvents used in post-combustion
- Table 294. Commercially available physical solvents for pre-combustion carbon capture
- Table 295. Main capture processes and their separation technologies
- Table 296. Absorption methods for CO2 capture overview
- Table 297. Commercially available physical solvents used in CO2 absorption
- Table 298. Adsorption methods for CO2 capture overview
- Table 299. Membrane-based methods for CO2 capture overview
- Table 300. Benefits and drawbacks of microalgae carbon capture
- Table 301. Comparison of main separation technologies
- Table 302. Technology readiness level (TRL) of gas separtion technologies
- Table 303. Opportunities and Barriers by sector
- Table 304. Existing and planned capacity for sequestration of biogenic carbon
- Table 305. Existing facilities with capture and/or geologic sequestration of biogenic CO2
- Table 306. Advantages and disadvantages of DAC
- Table 307. Companies developing airflow equipment integration with DAC
- Table 308. Companies developing Passive Direct Air Capture (PDAC) technologies
- Table 309. Companies developing regeneration methods for DAC technologies
- Table 310. DAC companies and technologies
- Table 311. DAC technology developers and production
- Table 312. DAC projects in development
- Table 313. Markets for DAC
- Table 314. Costs summary for DAC
- Table 315. Cost estimates of DAC
- Table 316. Challenges for DAC technology
- Table 317. DAC companies and technologies
- Table 318. Biological CCS technologies
- Table 319. Biochar in carbon capture overview
- Table 320. Carbon utilization revenue forecast by product (US$)
- Table 321. CO2 utilization and removal pathways
- Table 322. Market challenges for CO2 utilization
- Table 323. Example CO2 utilization pathways
- Table 324. CO2 derived products via Thermochemical conversion-applications, advantages and disadvantages
- Table 325. Electrochemical CO2 reduction products
- Table 326. CO2 derived products via electrochemical conversion-applications, advantages and disadvantages
- Table 327. CO2 derived products via biological conversion-applications, advantages and disadvantages
- Table 328. Companies developing and producing CO2-based polymers
- Table 329. Companies developing mineral carbonation technologies
- Table 330. Market overview for CO2 derived fuels
- Table 331. Microalgae products and prices
- Table 332. Main Solar-Driven CO2 Conversion Approaches
- Table 333. Companies in CO2-derived fuel products
- Table 334. Commodity chemicals and fuels manufactured from CO2
- Table 335. Companies in CO2-derived chemicals products
- Table 336. Carbon capture technologies and projects in the cement sector
- Table 337. Companies in CO2 derived building materials
- Table 338. Market challenges for CO2 utilization in construction materials
- Table 339. Companies in CO2 Utilization in Biological Yield-Boosting
- Table 340. Applications of CCS in oil and gas production
- Table 341. CO2 EOR/Storage Challenges
- Table 342. Storage and utilization of CO2
- Table 343. Global depleted reservoir storage projects
- Table 344. Global CO2 ECBM storage projects
- Table 345. CO2 EOR/storage projects
- Table 346. Global storage sites-saline aquifer projects
- Table 347. Global storage capacity estimates, by region
- Table 348. Types of recycling
- Table 349. Overview of the recycling technologies
- Table 350. Polymer types, use, and recovery
- Table 351. Composition of plastic waste streams
- Table 352. Comparison of mechanical and advanced chemical recycling
- Table 353. Market drivers and trends in the advanced chemical recycling market
- Table 354. Advanced recycling industry developments 2020-2023
- Table 355. Advanced recycling capacities, by technology
- Table 356. Global polymer demand 2022-2040, segmented by recycling technology for PE (million tons)
- Table 357. Global polymer demand 2022-2040, segmented by recycling technology for PP (million tons)
- Table 358. Global polymer demand 2022-2040, segmented by recycling technology for PET (million tons)
- Table 359. Global polymer demand 2022-2040, segmented by recycling technology for PS (million tons)
- Table 360. Global polymer demand 2022-2040, segmented by recycling technology for Nylon (million tons)
- Table 361. Global polymer demand 2022-2040, segmented by recycling technology for Other types (million tons).*
- Table 362. Global polymer demand in Europe, by recycling technology 2022-2040 (million tons)
- Table 363. Global polymer demand in North America, by recycling technology 2022-2040 (million tons)
- Table 364. Global polymer demand in South America, by recycling technology 2022-2040 (million tons)
- Table 365. Global polymer demand in Asia, by recycling technology 2022-2040 (million tons)
- Table 366. Global polymer demand in Oceania, by recycling technology 2022-2040 (million tons)
- Table 367. Global polymer demand in Africa, by recycling technology 2022-2040 (million tons)
- Table 368. Global polymer demand 2022-2040 by region, for PE (millions tons)
- Table 369. Global polymer demand 2022-2040 by region, for PP (millions tons)
- Table 370. Global polymer demand 2022-2040 by region, for PET (millions tons)
- Table 371. Global polymer demand 2022-2040 by region, for PS (millions tons)
- Table 372. Global polymer demand 2022-2040 by region, for NY (millions tons)
- Table 373. Global polymer demand 2022-2040 by region, for others (millions tons).*
- Table 374. Treatment capacity 2023-2026 for PE, by advanced recycling technology, 2023-2026 (million tons)
- Table 375. Treatment capacity 2023-2026 for PP, by advanced recycling technology, 2023-2026 (million tons)
- Table 376. Treatment capacity 2023-2026 for PET, by advanced recycling technology, 2023-2026 (million tons)
- Table 377. Treatment capacity 2023-2026 for PS, by advanced recycling technology, 2023-2026 (million tons)
- Table 378. Treatment capacity 2023-2026 for PS, by advanced recycling technology, 2023-2026 (million tons)
- Table 379. Treatment capacity 2023-2026 for others, by advanced recycling technology, 2023-2026
- Table 380. Treatment capacity by region for PE (2023-2026), million tons
- Table 381. Treatment capacity by region for PP (2023-2026), million tons
- Table 382. Treatment capacity by region for PET (2023-2026), million tons
- Table 383. Treatment capacity by region for PS (2023-2026), million tons
- Table 384. Treatment capacity by region for Ny (2023-2026), million tons
- Table 385. Treatment capacity by region for Others (2023-2026), million tons
- Table 386. Life cycle assessment of virgin plastic production, mechanical recycling and chemical recycling
- Table 387. Life cycle assessment of chemical recycling technologies (pyrolysis, gasification, depolymerization and dissolution)
- Table 388. Life cycle assessment of mechanically versus chemically recycling polyethylene (PE)
- Table 389. Life cycle assessment of mechanically versus chemically recycling polypropylene (PP)
- Table 390. Life cycle assessment of mechanically versus chemically recycling polyethylene terephthalate (PET)
- Table 391. Plastic yield of each chemical recycling technologies
- Table 392. Chemically recycled plastics prices in USD
- Table 393. Example chemically recycled plastic products
- Table 394. Life Cycle Assessments (LCA) of Advanced Chemical Recycling Processes
- Table 395. Challenges in the advanced recycling market
- Table 396. Applications of chemically recycled materials
- Table 397. Summary of non-catalytic pyrolysis technologies
- Table 398. Summary of catalytic pyrolysis technologies
- Table 399. Summary of pyrolysis technique under different operating conditions
- Table 400. Biomass materials and their bio-oil yield
- Table 401. Biofuel production cost from the biomass pyrolysis process
- Table 402. Pyrolysis companies and plant capacities, current and planned
- Table 403. Summary of gasification technologies
- Table 404. Advanced recycling (Gasification) companies
- Table 405. Summary of dissolution technologies
- Table 406. Advanced recycling (Dissolution) companies
- Table 407. depolymerisation processes for PET, PU, PC and PA, products and yields
- Table 408. Summary of hydrolysis technologies-feedstocks, process, outputs, commercial maturity and technology developers
- Table 409. Summary of Enzymolysis technologies-feedstocks, process, outputs, commercial maturity and technology developers
- Table 410. Summary of methanolysis technologies-feedstocks, process, outputs, commercial maturity and technology developers
- Table 411. Summary of glycolysis technologies-feedstocks, process, outputs, commercial maturity and technology developers
- Table 412. Summary of aminolysis technologies
- Table 413. Advanced recycling (Depolymerisation) companies and capacities (current and planned)
- Table 414. Overview of hydrothermal cracking for advanced chemical recycling
- Table 415. Overview of Pyrolysis with in-line reforming for advanced chemical recycling
- Table 416. Overview of microwave-assisted pyrolysis for advanced chemical recycling
- Table 417. Overview of plasma pyrolysis for advanced chemical recycling
- Table 418. Overview of plasma gasification for advanced chemical recycling
- Table 419. Summary of carbon fiber (CF) recycling technologies. Advantages and disadvantages
- Table 420. Retention rate of tensile properties of recovered carbon fibres by different recycling processes
- Table 421. Recycled carbon fiber producers, technology and capacity
List of Figures
- Figure 1. Schematic of biorefinery processes
- Figure 2. Global production of starch for biobased chemicals and intermediates, 2018-2034 (million metric tonnes)
- Figure 3. Global production of biobased lysine, 2018-2034 (metric tonnes)
- Figure 4. Global glucose production for bio-based chemicals and intermediates 2018-2034 (million metric tonnes)
- Figure 5. Global production volumes of bio-HMDA, 2018 to 2034 in metric tonnes
- Figure 6. Global production of bio-based DN5, 2018-2034 (metric tonnes)
- Figure 7. Global production of bio-based isosorbide, 2018-2034 (metric tonnes)
- Figure 8. L-lactic acid (L-LA) production, 2018-2034 (metric tonnes)
- Figure 9. Global lactide production, 2018-2034 (metric tonnes)
- Figure 10. Global production of bio-itaconic acid, 2018-2034 (metric tonnes)
- Figure 11. Global production of 3-HP, 2018-2034 (metric tonnes)
- Figure 12. Global production of bio-based acrylic acid, 2018-2034 (metric tonnes)
- Figure 13. Global production of bio-based 1,3-Propanediol (1,3-PDO), 2018-2034 (metric tonnes)
- Figure 14. Global production of bio-based Succinic acid, 2018-2034 (metric tonnes)
- Figure 15. Global production of 1,4-Butanediol (BDO), 2018-2034 (metric tonnes)
- Figure 16. Global production of bio-based tetrahydrofuran (THF), 2018-2034 (metric tonnes)
- Figure 17. Overview of Toray process
- Figure 18. Global production of bio-based caprolactam, 2018-2034 (metric tonnes)
- Figure 19. Global production of bio-based isobutanol, 2018-2034 (metric tonnes)
- Figure 20. Global production of bio-based 1,4-butanediol, 2018-2034 (metric tonnes)
- Figure 21. Global production of bio-based p-xylene, 2018-2034 (metric tonnes)
- Figure 22. Global production of biobased terephthalic acid (TPA), 2018-2034 (metric tonnes)
- Figure 23. Global production of biobased 1,3 Proppanediol, 2018-2034 (metric tonnes)
- Figure 24. Global production of biobased MEG, 2018-2034 (metric tonnes)
- Figure 25. Global production of biobased ethanol, 2018-2034 (million metric tonnes)
- Figure 26. Global production of biobased ethylene, 2018-2034 (million metric tonnes)
- Figure 27. Global production of biobased propylene, 2018-2034 (metric tonnes)
- Figure 28. Global production of biobased vinyl chloride, 2018-2034 (metric tonnes)
- Figure 29. Global production of bio-based Methly methacrylate, 2018-2034 (metric tonnes)
- Figure 30. Global production of biobased aniline, 2018-2034 (metric tonnes)
- Figure 31. Global production of biobased fructose, 2018-2034 (metric tonnes)
- Figure 32. Global production of biobased 5-Hydroxymethylfurfural (5-HMF), 2018-2034 (metric tonnes)
- Figure 33. Global production of biobased 5-(Chloromethyl)furfural (CMF), 2018-2034 (metric tonnes)
- Figure 34. Global production of biobased Levulinic acid, 2018-2034 (metric tonnes)
- Figure 35. Global production of biobased FDME, 2018-2034 (metric tonnes)
- Figure 36. Global production of biobased Furan-2,5-dicarboxylic acid (FDCA), 2018-2034 (metric tonnes)
- Figure 37. Global production projections for bio-based levoglucosenone from 2018 to 2034 in metric tonnes:
- Figure 38. Global production of hemicellulose, 2018-2034 (metric tonnes)
- Figure 39. Global production of biobased furfural, 2018-2034 (metric tonnes)
- Figure 40. Global production of biobased furfuryl alcohol, 2018-2034 (metric tonnes)
- Figure 41. Schematic of WISA plywood home
- Figure 42. Global production of biobased lignin, 2018-2034 (metric tonnes)
- Figure 43. Global production of biobased glycerol, 2018-2034 (metric tonnes)
- Figure 44. Global production of Bio-MPG, 2018-2034 (metric tonnes)
- Figure 45. Global production of biobased ECH, 2018-2034 (metric tonnes)
- Figure 46. Global production of biobased fatty acids, 2018-2034 (million metric tonnes)
- Figure 47. Global production of biobased sebacic acid, 2018-2034 (metric tonnes)
- Figure 48. Global production of biobased 11-Aminoundecanoic acid (11-AA), 2018-2034 (metric tonnes)
- Figure 49. Global production of biobased Dodecanedioic acid (DDDA), 2018-2034 (metric tonnes)
- Figure 50. Global production of biobased Pentamethylene diisocyanate, 2018-2034 (metric tonnes)
- Figure 51. Global production of biobased casein, 2018-2034 (metric tonnes)
- Figure 52. Global production of food waste for biochemicals, 2018-2034 (million metric tonnes)
- Figure 53. Global production of agricultural waste for biochemicals, 2018-2034 (million metric tonnes)
- Figure 54. Global production of forestry waste for biochemicals, 2018-2034 (million metric tonnes)
- Figure 55. Global production of aquaculture/fishing waste for biochemicals, 2018-2034 (million metric tonnes)
- Figure 56. Global production of municipal solid waste for biochemicals, 2018-2034 (million metric tonnes)
- Figure 57. Global production of waste oils for biochemicals, 2018-2034 (million metric tonnes)
- Figure 58. Global microalgae production, 2018-2034 (million metric tonnes)
- Figure 59. Global macroalgae production, 2018-2034 (million metric tonnes)
- Figure 60. Global production of biogas, 2018-2034 (billion m3)
- Figure 61. Global production of syngas, 2018-2034 (billion m3)
- Figure 62. formicobio™ technology
- Figure 63. Domsjö process
- Figure 64. TMP-Bio Process
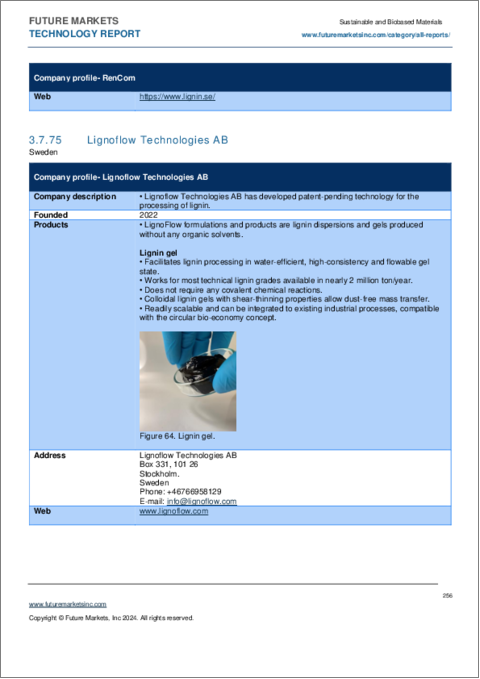
- Figure 65. Lignin gel
- Figure 66. BioFlex process
- Figure 67. LX Process
- Figure 68. METNIN™ Lignin refining technology
- Figure 69. Enfinity cellulosic ethanol technology process
- Figure 70. Fabric consisting of 70 per cent wool and 30 per cent Qmilk
- Figure 71. UPM biorefinery process
- Figure 72. The Proesa® Process
- Figure 73. Goldilocks process and applications
- Figure 74. Coca-Cola PlantBottle®
- Figure 75. Interrelationship between conventional, bio-based and biodegradable plastics
- Figure 76. Polylactic acid (Bio-PLA) production 2019-2034 (1,000 tons)
- Figure 77. Polyethylene terephthalate (Bio-PET) production 2019-2034 (1,000 tons)
- Figure 78. Polytrimethylene terephthalate (PTT) production 2019-2034 (1,000 tons)
- Figure 79. Production capacities of Polyethylene furanoate (PEF) to 2025
- Figure 80. Polyethylene furanoate (Bio-PEF) production 2019-2034 (1,000 tons)
- Figure 81. Polyamides (Bio-PA) production 2019-2034 (1,000 tons)
- Figure 82. Poly(butylene adipate-co-terephthalate) (Bio-PBAT) production 2019-2034 (1,000 tons)
- Figure 83. Polybutylene succinate (PBS) production 2019-2034 (1,000 tons)
- Figure 84. Polyethylene (Bio-PE) production 2019-2034 (1,000 tons)
- Figure 85. Polypropylene (Bio-PP) production capacities 2019-2034 (1,000 tons)
- Figure 86. PHA family
- Figure 87. PHA production capacities 2019-2034 (1,000 tons)
- Figure 88. TEM image of cellulose nanocrystals
- Figure 89. CNC preparation
- Figure 90. Extracting CNC from trees
- Figure 91. CNC slurry
- Figure 92. CNF gel
- Figure 93. Bacterial nanocellulose shapes
- Figure 94. BLOOM masterbatch from Algix
- Figure 95. Typical structure of mycelium-based foam
- Figure 96. Commercial mycelium composite construction materials
- Figure 97. Global production capacities of biobased and sustainable plastics 2022
- Figure 98. Global production capacities of biobased and sustainable plastics 2034
- Figure 99. Global production capacities for bioplastics by end user market 2019-2034, 1,000 tons
- Figure 100. PHA bioplastics products
- Figure 101. The global market for biobased and biodegradable plastics for flexible packaging 2019-2033 ('000 tonnes)
- Figure 102. Production volumes for bioplastics for rigid packaging, 2019-2033 ('000 tonnes)
- Figure 103. Global production for biobased and biodegradable plastics in consumer products 2019-2034, in 1,000 tons
- Figure 104. Global production capacities for biobased and biodegradable plastics in automotive 2019-2034, in 1,000 tons
- Figure 105. Global production volumes for biobased and biodegradable plastics in building and construction 2019-2034, in 1,000 tons
- Figure 106. AlgiKicks sneaker, made with the Algiknit biopolymer gel
- Figure 107. Reebok's [REE]GROW running shoes
- Figure 108. Camper Runner K21
- Figure 109. Global production volumes for biobased and biodegradable plastics in textiles 2019-2034, in 1,000 tons
- Figure 110. Global production volumes for biobased and biodegradable plastics in electronics 2019-2034, in 1,000 tons
- Figure 111. Biodegradable mulch films
- Figure 112. Global production volulmes for biobased and biodegradable plastics in agriculture 2019-2034, in 1,000 tons
- Figure 113. Types of natural fibers
- Figure 114. Absolut natural based fiber bottle cap
- Figure 115. Adidas algae-ink tees
- Figure 116. Carlsberg natural fiber beer bottle
- Figure 117. Miratex watch bands
- Figure 118. Adidas Made with Nature Ultraboost 22
- Figure 119. PUMA RE:SUEDE sneaker
- Figure 120. Cotton production volume 2018-2034 (Million MT)
- Figure 121. Kapok production volume 2018-2034 (MT)
- Figure 122. Luffa cylindrica fiber
- Figure 123. Jute production volume 2018-2034 (Million MT)
- Figure 124. Hemp fiber production volume 2018-2034 ( MT)
- Figure 125. Flax fiber production volume 2018-2034 (MT)
- Figure 126. Ramie fiber production volume 2018-2034 (MT)
- Figure 127. Kenaf fiber production volume 2018-2034 (MT)
- Figure 128. Sisal fiber production volume 2018-2034 (MT)
- Figure 129. Abaca fiber production volume 2018-2034 (MT)
- Figure 130. Coir fiber production volume 2018-2034 (MILLION MT)
- Figure 131. Banana fiber production volume 2018-2034 (MT)
- Figure 132. Pineapple fiber
- Figure 133. A bag made with pineapple biomaterial from the H&M Conscious Collection 2019
- Figure 134. Bamboo fiber production volume 2018-2034 (MILLION MT)
- Figure 135. Typical structure of mycelium-based foam
- Figure 136. Commercial mycelium composite construction materials
- Figure 137. Frayme Mylo™
- Figure 138. BLOOM masterbatch from Algix
- Figure 139. Conceptual landscape of next-gen leather materials
- Figure 140. Hemp fibers combined with PP in car door panel
- Figure 141. Car door produced from Hemp fiber
- Figure 142. Mercedes-Benz components containing natural fibers
- Figure 143. AlgiKicks sneaker, made with the Algiknit biopolymer gel
- Figure 144. Coir mats for erosion control
- Figure 145. Global fiber production in 2022, by fiber type, million MT and %
- Figure 146. Global fiber production (million MT) to 2020-2034
- Figure 147. Plant-based fiber production 2018-2034, by fiber type, MT
- Figure 148. Animal based fiber production 2018-2034, by fiber type, million MT
- Figure 149. High purity lignin
- Figure 150. Lignocellulose architecture
- Figure 151. Extraction processes to separate lignin from lignocellulosic biomass and corresponding technical lignins
- Figure 152. The lignocellulose biorefinery
- Figure 153. LignoBoost process
- Figure 154. LignoForce system for lignin recovery from black liquor
- Figure 155. Sequential liquid-lignin recovery and purification (SLPR) system
- Figure 156. A-Recovery+ chemical recovery concept
- Figure 157. Schematic of a biorefinery for production of carriers and chemicals
- Figure 158. Organosolv lignin
- Figure 159. Hydrolytic lignin powder
- Figure 160. Estimated consumption of lignin, 2019-2034 (000 MT)
- Figure 161. Schematic of WISA plywood home
- Figure 162. Lignin based activated carbon
- Figure 163. Lignin/celluose precursor
- Figure 164. Pluumo
- Figure 165. ANDRITZ Lignin Recovery process
- Figure 166. Anpoly cellulose nanofiber hydrogel
- Figure 167. MEDICELLU™
- Figure 168. Asahi Kasei CNF fabric sheet
- Figure 169. Properties of Asahi Kasei cellulose nanofiber nonwoven fabric
- Figure 170. CNF nonwoven fabric
- Figure 171. Roof frame made of natural fiber
- Figure 172. Beyond Leather Materials product
- Figure 173. BIOLO e-commerce mailer bag made from PHA
- Figure 174. Reusable and recyclable foodservice cups, lids, and straws from Joinease Hong Kong Ltd., made with plant-based NuPlastiQ BioPolymer from BioLogiQ, Inc
- Figure 175. Fiber-based screw cap
- Figure 176. formicobio™ technology
- Figure 177. nanoforest-S
- Figure 178. nanoforest-PDP
- Figure 179. nanoforest-MB
- Figure 180. sunliquid® production process
- Figure 181. CuanSave film
- Figure 182. Celish
- Figure 183. Trunk lid incorporating CNF
- Figure 184. ELLEX products
- Figure 185. CNF-reinforced PP compounds
- Figure 186. Kirekira! toilet wipes
- Figure 187. Color CNF
- Figure 188. Rheocrysta spray
- Figure 189. DKS CNF products
- Figure 190. Domsjö process
- Figure 191. Mushroom leather
- Figure 192. CNF based on citrus peel
- Figure 193. Citrus cellulose nanofiber
- Figure 194. Filler Bank CNC products
- Figure 195. Fibers on kapok tree and after processing
- Figure 196. TMP-Bio Process
- Figure 197. Flow chart of the lignocellulose biorefinery pilot plant in Leuna
- Figure 198. Water-repellent cellulose
- Figure 199. Cellulose Nanofiber (CNF) composite with polyethylene (PE)
- Figure 200. PHA production process
- Figure 201. CNF products from Furukawa Electric
- Figure 202. AVAPTM process
- Figure 203. GreenPower+™ process
- Figure 204. Cutlery samples (spoon, knife, fork) made of nano cellulose and biodegradable plastic composite materials
- Figure 205. Non-aqueous CNF dispersion "Senaf" (Photo shows 5% of plasticizer)
- Figure 206. CNF gel
- Figure 207. Block nanocellulose material
- Figure 208. CNF products developed by Hokuetsu
- Figure 209. Marine leather products
- Figure 210. Inner Mettle Milk products
- Figure 211. Kami Shoji CNF products
- Figure 212. Dual Graft System
- Figure 213. Engine cover utilizing Kao CNF composite resins
- Figure 214. Acrylic resin blended with modified CNF (fluid) and its molded product (transparent film), and image obtained with AFM (CNF 10wt% blended)
- Figure 215. Kel Labs yarn
- Figure 216. 0.3% aqueous dispersion of sulfated esterified CNF and dried transparent film (front side)
- Figure 217. Lignin gel
- Figure 218. BioFlex process
- Figure 219. Nike Algae Ink graphic tee
- Figure 220. LX Process
- Figure 221. Made of Air's HexChar panels
- Figure 222. TransLeather
- Figure 223. Chitin nanofiber product
- Figure 224. Marusumi Paper cellulose nanofiber products
- Figure 225. FibriMa cellulose nanofiber powder
- Figure 226. METNIN™ Lignin refining technology
- Figure 227. IPA synthesis method
- Figure 228. MOGU-Wave panels
- Figure 229. CNF slurries
- Figure 230. Range of CNF products
- Figure 231. Reishi
- Figure 232. Compostable water pod
- Figure 233. Leather made from leaves
- Figure 234. Nike shoe with beLEAF™
- Figure 235. CNF clear sheets
- Figure 236. Oji Holdings CNF polycarbonate product
- Figure 237. Enfinity cellulosic ethanol technology process
- Figure 238. Fabric consisting of 70 per cent wool and 30 per cent Qmilk
- Figure 239. XCNF
- Figure 240: Plantrose process
- Figure 241. LOVR hemp leather
- Figure 242. CNF insulation flat plates
- Figure 243. Hansa lignin
- Figure 244. Manufacturing process for STARCEL
- Figure 245. Manufacturing process for STARCEL
- Figure 246. 3D printed cellulose shoe
- Figure 247. Lyocell process
- Figure 248. North Face Spiber Moon Parka
- Figure 249. PANGAIA LAB NXT GEN Hoodie
- Figure 250. Spider silk production
- Figure 251. Stora Enso lignin battery materials
- Figure 252. 2 wt.% CNF suspension
- Figure 253. BiNFi-s Dry Powder
- Figure 254. BiNFi-s Dry Powder and Propylene (PP) Complex Pellet
- Figure 255. Silk nanofiber (right) and cocoon of raw material
- Figure 256. Sulapac cosmetics containers
- Figure 257. Sulzer equipment for PLA polymerization processing
- Figure 258. Solid Novolac Type lignin modified phenolic resins
- Figure 259. Teijin bioplastic film for door handles
- Figure 260. Corbion FDCA production process
- Figure 261. Comparison of weight reduction effect using CNF
- Figure 262. CNF resin products
- Figure 263. UPM biorefinery process
- Figure 264. Vegea production process
- Figure 265. The Proesa® Process
- Figure 266. Goldilocks process and applications
- Figure 267. Visolis' Hybrid Bio-Thermocatalytic Process
- Figure 268. HefCel-coated wood (left) and untreated wood (right) after 30 seconds flame test
- Figure 269. Worn Again products
- Figure 270. Zelfo Technology GmbH CNF production process
- Figure 271. Liquid biofuel production and consumption (in thousands of m3), 2000-2021
- Figure 272. Distribution of global liquid biofuel production in 2022
- Figure 273. SWOT analysis for biofuels
- Figure 274. Schematic of a biorefinery for production of carriers and chemicals
- Figure 275. Hydrolytic lignin powder
- Figure 276. SWOT analysis for energy crops in biofuels
- Figure 277. SWOT analysis for agricultural residues in biofuels
- Figure 278. SWOT analysis for Manure, sewage sludge and organic waste in biofuels
- Figure 279. SWOT analysis for forestry and wood waste in biofuels
- Figure 280. Range of biomass cost by feedstock type
- Figure 281. Regional production of biodiesel (billion litres)
- Figure 282. SWOT analysis for biodiesel
- Figure 283. Flow chart for biodiesel production
- Figure 284. Biodiesel (B20) average prices, current and historical, USD/litre
- Figure 285. Global biodiesel consumption, 2010-2034 (M litres/year)
- Figure 286. SWOT analysis for renewable iesel
- Figure 287. Global renewable diesel consumption, to 2033 (M litres/year)
- Figure 288. SWOT analysis for Bio-aviation fuel
- Figure 289. Global bio-jet fuel consumption to 2033 (Million litres/year)
- Figure 290. SWOT analysis biomethanol
- Figure 291. Renewable Methanol Production Processes from Different Feedstocks
- Figure 292. Production of biomethane through anaerobic digestion and upgrading
- Figure 293. Production of biomethane through biomass gasification and methanation
- Figure 294. Production of biomethane through the Power to methane process
- Figure 295. SWOT analysis for ethanol
- Figure 296. Ethanol consumption 2010-2034 (million litres)
- Figure 297. Properties of petrol and biobutanol
- Figure 298. Biobutanol production route
- Figure 299. Biogas and biomethane pathways
- Figure 300. Overview of biogas utilization
- Figure 301. Biogas and biomethane pathways
- Figure 302. Schematic overview of anaerobic digestion process for biomethane production
- Figure 303. Schematic overview of biomass gasification for biomethane production
- Figure 304. SWOT analysis for biogas
- Figure 305. Total syngas market by product in MM Nm3/h of Syngas, 2021
- Figure 306. SWOT analysis for biohydrogen
- Figure 307. Waste plastic production pathways to (A) diesel and (B) gasoline
- Figure 308. Schematic for Pyrolysis of Scrap Tires
- Figure 309. Used tires conversion process
- Figure 310. Total syngas market by product in MM Nm3/h of Syngas, 2021
- Figure 311. Overview of biogas utilization
- Figure 312. Biogas and biomethane pathways
- Figure 313. SWOT analysis for chemical recycling of biofuels
- Figure 314. Process steps in the production of electrofuels
- Figure 315. Mapping storage technologies according to performance characteristics
- Figure 316. Production process for green hydrogen
- Figure 317. SWOT analysis for E-fuels
- Figure 318. E-liquids production routes
- Figure 319. Fischer-Tropsch liquid e-fuel products
- Figure 320. Resources required for liquid e-fuel production
- Figure 321. Levelized cost and fuel-switching CO2 prices of e-fuels
- Figure 322. Cost breakdown for e-fuels
- Figure 323. Pathways for algal biomass conversion to biofuels
- Figure 324. SWOT analysis for algae-derived biofuels
- Figure 325. Algal biomass conversion process for biofuel production
- Figure 326. Classification and process technology according to carbon emission in ammonia production
- Figure 327. Green ammonia production and use
- Figure 328. Schematic of the Haber Bosch ammonia synthesis reaction
- Figure 329. Schematic of hydrogen production via steam methane reformation
- Figure 330. SWOT analysis for green ammonia
- Figure 331. Estimated production cost of green ammonia
- Figure 332. Projected annual ammonia production, million tons
- Figure 333. Bio-oil upgrading/fractionation techniques
- Figure 334. SWOT analysis for bio-oils
- Figure 335. ANDRITZ Lignin Recovery process
- Figure 336. FBPO process
- Figure 337. Direct Air Capture Process
- Figure 338. CRI process
- Figure 339. Colyser process
- Figure 340. ECFORM electrolysis reactor schematic
- Figure 341. Dioxycle modular electrolyzer
- Figure 342. Domsjö process
- Figure 343. FuelPositive system
- Figure 344. INERATEC unit
- Figure 345. Infinitree swing method
- Figure 346. Enfinity cellulosic ethanol technology process
- Figure 347: Plantrose process
- Figure 348. O12 Reactor
- Figure 349. Sunglasses with lenses made from CO2-derived materials
- Figure 350. CO2 made car part
- Figure 351. The Velocys process
- Figure 352. The Proesa® Process
- Figure 353. Goldilocks process and applications
- Figure 354. Paints and coatings industry by market segmentation 2019-2020
- Figure 355. PHA family
- Figure 356. Market revenues for biobased paints and coatings, 2018-2034 (billions USD)
- Figure 357. Dulux Better Living Air Clean Biobased
- Figure 358: NCCTM Process
- Figure 359: CNC produced at Tech Futures' pilot plant; cloudy suspension (1 wt.%), gel-like (10 wt.%), flake-like crystals, and very fine powder. Product advantages include:
- Figure 360. Cellugy materials
- Figure 361. EcoLine® 3690 (left) vs Solvent-Based Competitor Coating (right)
- Figure 362. Rheocrysta spray
- Figure 363. DKS CNF products
- Figure 364. Domsjö process
- Figure 365. CNF gel
- Figure 366. Block nanocellulose material
- Figure 367. CNF products developed by Hokuetsu
- Figure 368. BioFlex process
- Figure 369. Marusumi Paper cellulose nanofiber products
- Figure 370: Fluorene cellulose ® powder
- Figure 371. XCNF
- Figure 372. Spider silk production
- Figure 373. CNF dispersion and powder from Starlite
- Figure 374. 2 wt.% CNF suspension
- Figure 375. BiNFi-s Dry Powder
- Figure 376. BiNFi-s Dry Powder and Propylene (PP) Complex Pellet
- Figure 377. Silk nanofiber (right) and cocoon of raw material
- Figure 378. HefCel-coated wood (left) and untreated wood (right) after 30 seconds flame test
- Figure 379. Bio-based barrier bags prepared from Tempo-CNF coated bio-HDPE film
- Figure 380. Bioalkyd products
- Figure 381. Carbon emissions by sector
- Figure 382. Overview of CCUS market
- Figure 383. Pathways for CO2 use
- Figure 384. Regional capacity share 2022-2030
- Figure 385. Global investment in carbon capture 2010-2022, millions USD
- Figure 386. Carbon Capture, Utilization, & Storage (CCUS) Market Map
- Figure 387. CCS deployment projects, historical and to 2035
- Figure 388. Existing and planned CCS projects
- Figure 389. CCUS Value Chain
- Figure 390. Schematic of CCUS process
- Figure 391. Pathways for CO2 utilization and removal
- Figure 392. A pre-combustion capture system
- Figure 393. Carbon dioxide utilization and removal cycle
- Figure 394. Various pathways for CO2 utilization
- Figure 395. Example of underground carbon dioxide storage
- Figure 396. Transport of CCS technologies
- Figure 397. Railroad car for liquid CO2 transport
- Figure 398. Estimated costs of capture of one metric ton of carbon dioxide (Co2) by sector
- Figure 399. Cost of CO2 transported at different flowrates
- Figure 400. Cost estimates for long-distance CO2 transport
- Figure 401. CO2 capture and separation technology
- Figure 402. Global capacity of point-source carbon capture and storage facilities
- Figure 403. Global carbon capture capacity by CO2 source, 2022
- Figure 404. Global carbon capture capacity by CO2 source, 2030
- Figure 405. Global carbon capture capacity by CO2 endpoint, 2021 and 2030
- Figure 406. Post-combustion carbon capture process
- Figure 407. Postcombustion CO2 Capture in a Coal-Fired Power Plant
- Figure 408. Oxy-combustion carbon capture process
- Figure 409. Liquid or supercritical CO2 carbon capture process
- Figure 410. Pre-combustion carbon capture process
- Figure 411. Amine-based absorption technology
- Figure 412. Pressure swing absorption technology
- Figure 413. Membrane separation technology
- Figure 414. Liquid or supercritical CO2 (cryogenic) distillation
- Figure 415. Process schematic of chemical looping
- Figure 416. Calix advanced calcination reactor
- Figure 417. Fuel Cell CO2 Capture diagram
- Figure 418. Microalgal carbon capture
- Figure 419. Cost of carbon capture
- Figure 420. CO2 capture capacity to 2030, MtCO2
- Figure 421. Capacity of large-scale CO2 capture projects, current and planned vs. the Net Zero Scenario, 2020-2030
- Figure 422. Bioenergy with carbon capture and storage (BECCS) process
- Figure 423. CO2 captured from air using liquid and solid sorbent DAC plants, storage, and reuse
- Figure 424. Global CO2 capture from biomass and DAC in the Net Zero Scenario
- Figure 425. DAC technologies
- Figure 426. Schematic of Climeworks DAC system
- Figure 427. Climeworks' first commercial direct air capture (DAC) plant, based in Hinwil, Switzerland
- Figure 428. Flow diagram for solid sorbent DAC
- Figure 429. Direct air capture based on high temperature liquid sorbent by Carbon Engineering
- Figure 430. Global capacity of direct air capture facilities
- Figure 431. Global map of DAC and CCS plants
- Figure 432. Schematic of costs of DAC technologies
- Figure 433. DAC cost breakdown and comparison
- Figure 434. Operating costs of generic liquid and solid-based DAC systems
- Figure 435. Schematic of biochar production
- Figure 436. CO2 non-conversion and conversion technology, advantages and disadvantages
- Figure 437. Applications for CO2
- Figure 438. Cost to capture one metric ton of carbon, by sector
- Figure 439. Life cycle of CO2-derived products and services
- Figure 440. Co2 utilization pathways and products
- Figure 441. Plasma technology configurations and their advantages and disadvantages for CO2 conversion
- Figure 442. LanzaTech gas-fermentation process
- Figure 443. Schematic of biological CO2 conversion into e-fuels
- Figure 444. Econic catalyst systems
- Figure 445. Mineral carbonation processes
- Figure 446. Conversion route for CO2-derived fuels and chemical intermediates
- Figure 447. Conversion pathways for CO2-derived methane, methanol and diesel
- Figure 448. CO2 feedstock for the production of e-methanol
- Figure 449. Schematic illustration of (a) biophotosynthetic, (b) photothermal, (c) microbial-photoelectrochemical, (d) photosynthetic and photocatalytic (PS/PC), (e) photoelectrochemical (PEC), and (f) photovoltaic plus electrochemical (PV+EC) approaches for CO2 c
- Figure 450. Audi synthetic fuels
- Figure 451. Conversion of CO2 into chemicals and fuels via different pathways
- Figure 452. Conversion pathways for CO2-derived polymeric materials
- Figure 453. Conversion pathway for CO2-derived building materials
- Figure 454. Schematic of CCUS in cement sector
- Figure 455. Carbon8 Systems' ACT process
- Figure 456. CO2 utilization in the Carbon Cure process
- Figure 457. Algal cultivation in the desert
- Figure 458. Example pathways for products from cyanobacteria
- Figure 459. Typical Flow Diagram for CO2 EOR
- Figure 460. Large CO2-EOR projects in different project stages by industry
- Figure 461. Carbon mineralization pathways
- Figure 462. CO2 Storage Overview - Site Options
- Figure 463. CO2 injection into a saline formation while producing brine for beneficial use
- Figure 464. Subsurface storage cost estimation
- Figure 465. Air Products production process
- Figure 466. Aker carbon capture system
- Figure 467. ALGIECEL PhotoBioReactor
- Figure 468. Schematic of carbon capture solar project
- Figure 469. Aspiring Materials method
- Figure 470. Aymium's Biocarbon production
- Figure 471. Carbonminer technology
- Figure 472. Carbon Blade system
- Figure 473. CarbonCure Technology
- Figure 474. Direct Air Capture Process
- Figure 475. CRI process
- Figure 476. PCCSD Project in China
- Figure 477. Orca facility
- Figure 478. Process flow scheme of Compact Carbon Capture Plant
- Figure 479. Colyser process
- Figure 480. ECFORM electrolysis reactor schematic
- Figure 481. Dioxycle modular electrolyzer
- Figure 482. Fuel Cell Carbon Capture
- Figure 483. Topsoe's SynCORTM autothermal reforming technology
- Figure 484. Carbon Capture balloon
- Figure 485. Holy Grail DAC system
- Figure 486. INERATEC unit
- Figure 487. Infinitree swing method
- Figure 488. Audi/Krajete unit
- Figure 489. Made of Air's HexChar panels
- Figure 490. Mosaic Materials MOFs
- Figure 491. Neustark modular plant
- Figure 492. OCOchem's Carbon Flux Electrolyzer
- Figure 493. ZerCaL™ process
- Figure 494. CCS project at Arthit offshore gas field
- Figure 495. RepAir technology
- Figure 496. Soletair Power unit
- Figure 497. Sunfire process for Blue Crude production
- Figure 498. CALF-20 has been integrated into a rotating CO2 capture machine (left), which operates inside a CO2 plant module (right)
- Figure 499. O12 Reactor
- Figure 500. Sunglasses with lenses made from CO2-derived materials
- Figure 501. CO2 made car part
- Figure 502. Global production, use, and fate of polymer resins, synthetic fibers, and additives
- Figure 503. Current management systems for waste plastics
- Figure 504. Global polymer demand 2022-2040, segmented by recycling technology for PE (million tons)
- Figure 505. Global polymer demand 2022-2040, segmented by recycling technology for PP (million tons)
- Figure 506. Global polymer demand 2022-2040, segmented by recycling technology for PET (million tons)
- Figure 507. Global polymer demand 2022-2040, segmented by recycling technology for PS (million tons)
- Figure 508. Global polymer demand 2022-2040, segmented by recycling technology for Nylon (million tons)
- Figure 509. Global polymer demand 2022-2040, segmented by recycling technology for Other types (million tons)
- Figure 510. Global polymer demand in Europe, by recycling technology 2022-2040 (million tons)
- Figure 511. Global polymer demand in North America, by recycling technology 2022-2040 (million tons)
- Figure 512. Global polymer demand in South America, by recycling technology 2022-2040 (million tons)
- Figure 513. Global polymer demand in Asia, by recycling technology 2022-2040 (million tons)
- Figure 514. Global polymer demand in Oceania, by recycling technology 2022-2040 (million tons)
- Figure 515. Global polymer demand in Africa, by recycling technology 2022-2040 (million tons)
- Figure 516. Global polymer demand 2022-2040 by region, for PE (millions tons)
- Figure 517. Global polymer demand 2022-2040 by region, for PP (millions tons)
- Figure 518. Global polymer demand 2022-2040 by region, for PET (millions tons)
- Figure 519. Global polymer demand 2022-2040 by region, for PS (millions tons)
- Figure 520. Global polymer demand 2022-2040 by region, for NY (millions tons)
- Figure 521. Global polymer demand 2022-2040 by region, for others (millions tons)
- Figure 522. Market map for advanced recycling
- Figure 523. Value chain for advanced recycling market
- Figure 524. Schematic layout of a pyrolysis plant
- Figure 525. Waste plastic production pathways to (A) diesel and (B) gasoline
- Figure 526. Schematic for Pyrolysis of Scrap Tires
- Figure 527. Used tires conversion process
- Figure 528. SWOT analysis-pyrolysis for advanced recycling
- Figure 529. Total syngas market by product in MM Nm3/h of Syngas, 2021
- Figure 530. Overview of biogas utilization
- Figure 531. Biogas and biomethane pathways
- Figure 532. SWOT analysis-gasification for advanced recycling
- Figure 533. SWOT analysis-dissoluton for advanced recycling
- Figure 534. Products obtained through the different solvolysis pathways of PET, PU, and PA
- Figure 535. SWOT analysis-Hydrolysis for advanced chemical recycling
- Figure 536. SWOT analysis-Enzymolysis for advanced chemical recycling
- Figure 537. SWOT analysis-Methanolysis for advanced chemical recycling
- Figure 538. SWOT analysis-Glycolysis for advanced chemical recycling
- Figure 539. SWOT analysis-Aminolysis for advanced chemical recycling
- Figure 540. NewCycling process
- Figure 541. ChemCyclingTM prototypes
- Figure 542. ChemCycling circle by BASF
- Figure 543. Recycled carbon fibers obtained through the R3FIBER process
- Figure 544. Cassandra Oil process
- Figure 545. CuRe Technology process
- Figure 546. MoReTec
- Figure 547. Chemical decomposition process of polyurethane foam
- Figure 548. Schematic Process of Plastic Energy's TAC Chemical Recycling
- Figure 549. Easy-tear film material from recycled material
- Figure 550. Polyester fabric made from recycled monomers
- Figure 551. A sheet of acrylic resin made from conventional, fossil resource-derived MMA monomer (left) and a sheet of acrylic resin made from chemically recycled MMA monomer (right)
- Figure 552. Teijin Frontier Co., Ltd. Depolymerisation process
- Figure 553. The Velocys process
- Figure 554. The Proesa® Process
- Figure 555. Worn Again products
The demand for renewable and sustainable alternatives to fossil-fuel based chemicals and materials is experiencing rapid growth. The use of renewable and sustainable materials in construction, automotive, energy, textiles and others sectors can create new markets for bio-based products, as well as significantly reduce emissions, manufacturing energy requirements, manufacturing costs and waste. Key market drivers include rising corporate and government commitments to sustainability, regulations favouring renewables, and shifting consumer preferences.
The 1,742 report provides a comprehensive analysis of the global market for bio-based, CO2-utilization, and chemically recycled materials. It profiles over 1,200 companies developing innovative technologies and products in these sectors.
Contents include:
- In-depth analysis of bio-based feedstocks including plant-based sources (starch, sugar crops, lignocellulose, oils), waste streams (food, agricultural, forestry, municipal), and microbial & mineral sources.
- In-depth analysis of bio-based polymers, plastics, fuels, natural fibers, lignin, and sustainable coatings and paints. Market sizes, production capacities, volume trends and forecasts to 2034.
- Review of latest technologies and market opportunities in carbon capture, utilization and storage (CCUS). Barriers, policies, projects, product markets including CO2-based fuels, minerals, etc.
- Overview of advanced chemical recycling processes such as pyrolysis, gasification, depolymerization, etc. Plastics market drivers, industry developments, technology analysis, and company profiles.
- Companies profiled include: NatureWorks, Total Corbion, Danimer Scientific, Novamont, Mitsubishi Chemicals, Indorama, Braskem, Avantium, Borealis, Cathay, Dupont, BASF, Arkema, DuPont, BASF, AMSilk GmbH, Loliware, Bolt Threads, Ecovative, Bioform Technologies, Algal Bio, Kraig Biocraft Laboratories, Biotic Circular Technologies Ltd., Full Cycle Bioplastics, Stora Enso Oyj, Spiber, Traceless Materials GmbH, CJ Biomaterials, Natrify, Plastus, Humble Bee Bio, B'ZEOS, Ecovative, Notpla, Smartfiber, Keel Labs, MycoWorks, Algiecel, Aspiring Materials, Cambridge Carbon Capture, Carbon Engineering Ltd., Captura, Carbyon BV, CarbonCure Technologies Inc., CarbonOrO, Carbon Collect, Climeworks, Dimensional Energy, Dioxycle, Ebb Carbon, enaDyne, Fortera Corporation, Global Thermostat, Heirloom Carbon Technologies, High Hopes Labs, LanzaTech, Liquid Wind AB, Lithos, Living Carbon, Mars Materials, Mercurius Biorefining, Mission Zero Technologies, OXCUU, Oxylum, Paebbl, Prometheus Fuels, RepAir, Sunfire GmbH, Sustaera, Svante, Travertine Technologies, Verdox, Agilyx, APK AG, Aquafil, Carbios, Eastman, Extracthive, Fych Technologies, Garbo, gr3n SA, Ioniqa, Itero, Licella, Mura Technology, revalyu Resources GmbH, Plastic Energy, Polystyvert, Pyrowave, ReVital Polymers and SABIC.
TABLE OF CONTENTS
1. RESEARCH METHODOLOGY
2. BIO-BASED FEEDSTOCKS AND INTERMEDIATES MARKET
- 2.1. BIOREFINERIES
- 2.2. BIO-BASED FEEDSTOCK AND LAND USE
- 2.3. PLANT-BASED
- 2.3.1. STARCH
- 2.3.1.1. Overview
- 2.3.1.2. Sources
- 2.3.1.3. Global production
- 2.3.1.4. Lysine
- 2.3.1.4.1. Source
- 2.3.1.4.2. Applications
- 2.3.1.4.3. Global production
- 2.3.1.5. Glucose
- 2.3.1.5.1. HMDA
- 2.3.1.5.1.1. Overview
- 2.3.1.5.1.2. Sources
- 2.3.1.5.1.3. Applications
- 2.3.1.5.1.4. Global production
- 2.3.1.5.2. 1,5-diaminopentane (DA5):
- 2.3.1.5.2.1. Overview
- 2.3.1.5.2.2. Sources
- 2.3.1.5.2.3. Applications
- 2.3.1.5.2.4. Global production
- 2.3.1.5.3. Sorbitol
- 2.3.1.5.3.1. Isosorbide
- 2.3.1.5.3.1.1. Overview
- 2.3.1.5.3.1.2. Sources
- 2.3.1.5.3.1.3. Applications
- 2.3.1.5.3.1.4. Global production
- 2.3.1.5.3.1. Isosorbide
- 2.3.1.5.4. Lactic acid
- 2.3.1.5.4.1. Overview
- 2.3.1.5.4.2. D-lactic acid
- 2.3.1.5.4.3. L-lactic acid
- 2.3.1.5.4.4. Lactide
- 2.3.1.5.5. Itaconic acid
- 2.3.1.5.5.1. Overview
- 2.3.1.5.5.2. Sources
- 2.3.1.5.5.3. Applications
- 2.3.1.5.5.4. Global production
- 2.3.1.5.6. 3-HP
- 2.3.1.5.6.1. Overview
- 2.3.1.5.6.2. Sources
- 2.3.1.5.6.3. Applications
- 2.3.1.5.6.4. Global production
- 2.3.1.5.6.5. Acrylic acid
- 2.3.1.5.6.5.1. Overview
- 2.3.1.5.6.5.2. Applications
- 2.3.1.5.6.5.3. Global production
- 2.3.1.5.6.6. 1,3-Propanediol (1,3-PDO)
- 2.3.1.5.6.6.1. Overview
- 2.3.1.5.6.6.2. Applications
- 2.3.1.5.6.6.3. Global production
- 2.3.1.5.7. Succinic Acid
- 2.3.1.5.7.1. Overview
- 2.3.1.5.7.2. Sources
- 2.3.1.5.7.3. Applications
- 2.3.1.5.7.4. Global production
- 2.3.1.5.7.5. 1,4-Butanediol (1,4-BDO)
- 2.3.1.5.7.5.1. Overview
- 2.3.1.5.7.5.2. Applications
- 2.3.1.5.7.5.3. Global production
- 2.3.1.5.7.6. Tetrahydrofuran (THF)
- 2.3.1.5.7.6.1. Overview
- 2.3.1.5.7.6.2. Applications
- 2.3.1.5.7.6.3. Global production
- 2.3.1.5.8. Adipic acid
- 2.3.1.5.8.1. Overview
- 2.3.1.5.8.2. Caprolactame
- 2.3.1.5.8.2.1. Overview
- 2.3.1.5.8.2.2. Applications
- 2.3.1.5.8.2.3. Global production
- 2.3.1.5.9. Isobutanol
- 2.3.1.5.9.1. Overview
- 2.3.1.5.9.2. Sources
- 2.3.1.5.9.3. Applications
- 2.3.1.5.9.4. Global production
- 2.3.1.5.9.5. 1,4-Butanediol
- 2.3.1.5.9.5.1. Overview
- 2.3.1.5.9.5.2. Applications
- 2.3.1.5.9.5.3. Global production
- 2.3.1.5.9.6. p-Xylene
- 2.3.1.5.9.6.1. Overview
- 2.3.1.5.9.6.2. Sources
- 2.3.1.5.9.6.3. Applications
- 2.3.1.5.9.6.4. Global production
- 2.3.1.5.9.6.5. Terephthalic acid
- 2.3.1.5.9.6.6. Overview
- 2.3.1.5.10. 1,3 Proppanediol
- 2.3.1.5.10.1. Overview
- 2.3.1.5.10.2. Sources
- 2.3.1.5.10.3. Applications
- 2.3.1.5.10.4. Global production
- 2.3.1.5.11. Monoethylene glycol (MEG)
- 2.3.1.5.11.1. Overview
- 2.3.1.5.11.2. Sources
- 2.3.1.5.11.3. Applications
- 2.3.1.5.11.4. Global production
- 2.3.1.5.12. Ethanol
- 2.3.1.5.12.1. Overview
- 2.3.1.5.12.2. Sources
- 2.3.1.5.12.3. Applications
- 2.3.1.5.12.4. Global production
- 2.3.1.5.12.5. Ethylene
- 2.3.1.5.12.5.1. Overview
- 2.3.1.5.12.5.2. Applications
- 2.3.1.5.12.5.3. Global production
- 2.3.1.5.12.5.4. Propylene
- 2.3.1.5.12.5.5. Vinyl chloride
- 2.3.1.5.12.6. Methly methacrylate
- 2.3.1.5.1. HMDA
- 2.3.2. SUGAR CROPS
- 2.3.2.1. Saccharose
- 2.3.2.1.1. Aniline
- 2.3.2.1.1.1. Overview
- 2.3.2.1.1.2. Applications
- 2.3.2.1.1.3. Global production
- 2.3.2.1.2. Fructose
- 2.3.2.1.2.1. Overview
- 2.3.2.1.2.2. Applications
- 2.3.2.1.2.3. Global production
- 2.3.2.1.2.4. 5-Hydroxymethylfurfural (5-HMF)
- 2.3.2.1.2.4.1. Overview
- 2.3.2.1.2.4.2. Applications
- 2.3.2.1.2.4.3. Global production
- 2.3.2.1.2.5. 5-Chloromethylfurfural (5-CMF)
- 2.3.2.1.2.5.1. Overview
- 2.3.2.1.2.5.2. Applications
- 2.3.2.1.2.5.3. Global production
- 2.3.2.1.2.6. Levulinic Acid
- 2.3.2.1.2.6.1. Overview
- 2.3.2.1.2.6.2. Applications
- 2.3.2.1.2.6.3. Global production
- 2.3.2.1.2.7. FDME
- 2.3.2.1.2.7.1. Overview
- 2.3.2.1.2.7.2. Applications
- 2.3.2.1.2.7.3. Global production
- 2.3.2.1.2.8. 2,5-FDCA
- 2.3.2.1.2.8.1. Overview
- 2.3.2.1.2.8.2. Applications
- 2.3.2.1.2.8.3. Global production
- 2.3.2.1.1. Aniline
- 2.3.2.1. Saccharose
- 2.3.3. LIGNOCELLULOSIC BIOMASS
- 2.3.3.1. Levoglucosenone
- 2.3.3.1.1. Overview
- 2.3.3.1.2. Applications
- 2.3.3.1.3. Global production
- 2.3.3.2. Hemicellulose
- 2.3.3.2.1. Overview
- 2.3.3.2.2. Biochemicals from hemicellulose
- 2.3.3.2.3. Global production
- 2.3.3.2.4. Furfural
- 2.3.3.2.4.1. Overview
- 2.3.3.2.4.2. Applications
- 2.3.3.2.4.3. Global production
- 2.3.3.2.4.4. Furfuyl alcohol
- 2.3.3.2.4.4.1. Overview
- 2.3.3.2.4.4.2. Applications
- 2.3.3.2.4.4.3. Global production
- 2.3.3.3. Lignin
- 2.3.3.3.1. Overview
- 2.3.3.3.2. Sources
- 2.3.3.3.3. Applications
- 2.3.3.3.3.1. Aromatic compounds
- 2.3.3.3.3.1.1. Benzene, toluene and xylene
- 2.3.3.3.3.1.2. Phenol and phenolic resins
- 2.3.3.3.3.1.3. Vanillin
- 2.3.3.3.3.2. Polymers
- 2.3.3.3.3.1. Aromatic compounds
- 2.3.3.3.4. Global production
- 2.3.3.1. Levoglucosenone
- 2.3.4. PLANT OILS
- 2.3.4.1. Overview
- 2.3.4.2. Glycerol
- 2.3.4.2.1. Overview
- 2.3.4.2.2. Applications
- 2.3.4.2.3. Global production
- 2.3.4.2.4. MPG
- 2.3.4.2.4.1. Overview
- 2.3.4.2.4.2. Applications
- 2.3.4.2.4.3. Global production
- 2.3.4.2.5. ECH
- 2.3.4.2.5.1. Overview
- 2.3.4.2.5.2. Applications
- 2.3.4.2.5.3. Global production
- 2.3.4.3. Fatty acids
- 2.3.4.3.1. Overview
- 2.3.4.3.2. Applications
- 2.3.4.3.3. Global production
- 2.3.4.4. Castor oil
- 2.3.4.4.1. Overview
- 2.3.4.4.2. Sebacic acid
- 2.3.4.4.2.1. Overview
- 2.3.4.4.2.2. Applications
- 2.3.4.4.2.3. Global production
- 2.3.4.4.3. 11-Aminoundecanoic acid (11-AA)
- 2.3.4.4.3.1. Overview
- 2.3.4.4.3.2. Applications
- 2.3.4.4.3.3. Global production
- 2.3.4.5. Dodecanedioic acid (DDDA)
- 2.3.4.5.1. Overview
- 2.3.4.5.2. Applications
- 2.3.4.5.3. Global production
- 2.3.4.6. Pentamethylene diisocyanate
- 2.3.4.6.1. Overview
- 2.3.4.6.2. Applications
- 2.3.4.6.3. Global production
- 2.3.5. NON-EDIBIBLE MILK
- 2.3.5.1. Casein
- 2.3.5.1.1. Overview
- 2.3.5.1.2. Applications
- 2.3.5.1.3. Global production
- 2.3.5.1. Casein
- 2.3.1. STARCH
- 2.4. WASTE
- 2.4.1. Food waste
- 2.4.1.1. Overview
- 2.4.1.2. Products and applications
- 2.4.1.2.1. Global production
- 2.4.2. Agricultural waste
- 2.4.2.1. Overview
- 2.4.2.2. Products and applications
- 2.4.2.3. Global production
- 2.4.3. Forestry waste
- 2.4.3.1. Overview
- 2.4.3.2. Products and applications
- 2.4.3.3. Global production
- 2.4.4. Aquaculture/fishing waste
- 2.4.4.1. Overview
- 2.4.4.2. Products and applications
- 2.4.4.3. Global production
- 2.4.5. Municipal solid waste
- 2.4.5.1. Overview
- 2.4.5.2. Products and applications
- 2.4.5.3. Global production
- 2.4.6. Industrial waste
- 2.4.6.1. Overview
- 2.4.7. Waste oils
- 2.4.7.1. Overview
- 2.4.7.2. Products and applications
- 2.4.7.3. Global production
- 2.4.1. Food waste
- 2.5. MICROBIAL & MINERAL SOURCES
- 2.5.1. Microalgae
- 2.5.1.1. Overview
- 2.5.1.2. Products and applications
- 2.5.1.3. Global production
- 2.5.2. Macroalgae
- 2.5.2.1. Overview
- 2.5.2.2. Products and applications
- 2.5.2.3. Global production
- 2.5.3. Mineral sources
- 2.5.3.1. Overview
- 2.5.3.2. Products and applications
- 2.5.1. Microalgae
- 2.6. GASEOUS
- 2.6.1. Biogas
- 2.6.1.1. Overview
- 2.6.1.2. Products and applications
- 2.6.1.3. Global production
- 2.6.2. Syngas
- 2.6.2.1. Overview
- 2.6.2.2. Products and applications
- 2.6.2.3. Global production
- 2.6.3. Off gases - fermentation CO2, CO
- 2.6.3.1. Overview
- 2.6.3.2. Products and applications
- 2.6.1. Biogas
- 2.7. COMPANY PROFILES (105 company profiles)
3. BIO-BASED PLASTICS AND POLYMERS MARKET
- 3.1. BIO-BASED OR RENEWABLE PLASTICS
- 3.1.1. Drop-in bio-based plastics
- 3.1.2. Novel bio-based plastics
- 3.2. BIODEGRADABLE AND COMPOSTABLE PLASTICS
- 3.2.1. Biodegradability
- 3.2.2. Compostability
- 3.3. TYPES
- 3.4. KEY MARKET PLAYERS
- 3.5. SYNTHETIC BIO-BASED POLYMERS
- 3.5.1. Polylactic acid (Bio-PLA)
- 3.5.1.1. Market analysis
- 3.5.1.2. Production
- 3.5.1.3. Producers and production capacities, current and planned
- 3.5.1.3.1. Lactic acid producers and production capacities
- 3.5.1.3.2. PLA producers and production capacities
- 3.5.1.3.3. Polylactic acid (Bio-PLA) production 2019-2034 (1,000 tons)
- 3.5.2. Polyethylene terephthalate (Bio-PET)
- 3.5.2.1. Market analysis
- 3.5.2.2. Producers and production capacities
- 3.5.2.3. Polyethylene terephthalate (Bio-PET) production 2019-2034 (1,000 tons)
- 3.5.3. Polytrimethylene terephthalate (Bio-PTT)
- 3.5.3.1. Market analysis
- 3.5.3.2. Producers and production capacities
- 3.5.3.3. Polytrimethylene terephthalate (PTT) production 2019-2034 (1,000 tons)
- 3.5.4. Polyethylene furanoate (Bio-PEF)
- 3.5.4.1. Market analysis
- 3.5.4.2. Comparative properties to PET
- 3.5.4.3. Producers and production capacities
- 3.5.4.3.1. FDCA and PEF producers and production capacities
- 3.5.4.3.2. Polyethylene furanoate (Bio-PEF) production 2019-2034 (1,000 tons)
- 3.5.5. Polyamides (Bio-PA)
- 3.5.5.1. Market analysis
- 3.5.5.2. Producers and production capacities
- 3.5.5.3. Polyamides (Bio-PA) production 2019-2034 (1,000 tons)
- 3.5.6. Poly(butylene adipate-co-terephthalate) (Bio-PBAT)
- 3.5.6.1. Market analysis
- 3.5.6.2. Producers and production capacities
- 3.5.6.3. Poly(butylene adipate-co-terephthalate) (Bio-PBAT) production 2019-2034 (1,000 tons)
- 3.5.7. Polybutylene succinate (PBS) and copolymers
- 3.5.7.1. Market analysis
- 3.5.7.2. Producers and production capacities
- 3.5.7.3. Polybutylene succinate (PBS) production 2019-2034 (1,000 tons)
- 3.5.8. Polyethylene (Bio-PE)
- 3.5.8.1. Market analysis
- 3.5.8.2. Producers and production capacities
- 3.5.8.3. Polyethylene (Bio-PE) production 2019-2034 (1,000 tons)
- 3.5.9. Polypropylene (Bio-PP)
- 3.5.9.1. Market analysis
- 3.5.9.2. Producers and production capacities
- 3.5.9.3. Polypropylene (Bio-PP) production 2019-2034 (1,000 tons)
- 3.5.1. Polylactic acid (Bio-PLA)
- 3.6. NATURAL BIO-BASED POLYMERS
- 3.6.1. Polyhydroxyalkanoates (PHA)
- 3.6.1.1. Technology description
- 3.6.1.2. Types
- 3.6.1.2.1. PHB
- 3.6.1.2.2. PHBV
- 3.6.1.3. Synthesis and production processes
- 3.6.1.4. Market analysis
- 3.6.1.5. Commercially available PHAs
- 3.6.1.6. Markets for PHAs
- 3.6.1.6.1. Packaging
- 3.6.1.6.2. Cosmetics
- 3.6.1.6.2.1. PHA microspheres
- 3.6.1.6.3. Medical
- 3.6.1.6.3.1. Tissue engineering
- 3.6.1.6.3.2. Drug delivery
- 3.6.1.6.4. Agriculture
- 3.6.1.6.4.1. Mulch film
- 3.6.1.6.4.2. Grow bags
- 3.6.1.7. Producers and production capacities
- 3.6.1.8. PHA production capacities 2019-2034 (1,000 tons)
- 3.6.2. Cellulose
- 3.6.2.1. Microfibrillated cellulose (MFC)
- 3.6.2.1.1. Market analysis
- 3.6.2.1.2. Producers and production capacities
- 3.6.2.2. Nanocellulose
- 3.6.2.2.1. Cellulose nanocrystals
- 3.6.2.2.1.1. Synthesis
- 3.6.2.2.1.2. Properties
- 3.6.2.2.1.3. Production
- 3.6.2.2.1.4. Applications
- 3.6.2.2.1.5. Market analysis
- 3.6.2.2.1.6. Producers and production capacities
- 3.6.2.2.2. Cellulose nanofibers
- 3.6.2.2.2.1. Applications
- 3.6.2.2.2.2. Market analysis
- 3.6.2.2.2.3. Producers and production capacities
- 3.6.2.2.3. Bacterial Nanocellulose (BNC)
- 3.6.2.2.3.1. Production
- 3.6.2.2.3.2. Applications
- 3.6.2.2.1. Cellulose nanocrystals
- 3.6.2.1. Microfibrillated cellulose (MFC)
- 3.6.3. Protein-based bioplastics
- 3.6.3.1. Types, applications and producers
- 3.6.4. Algal and fungal
- 3.6.4.1. Algal
- 3.6.4.1.1. Advantages
- 3.6.4.1.2. Production
- 3.6.4.1.3. Producers
- 3.6.4.2. Mycelium
- 3.6.4.2.1. Properties
- 3.6.4.2.2. Applications
- 3.6.4.2.3. Commercialization
- 3.6.4.1. Algal
- 3.6.5. Chitosan
- 3.6.5.1. Technology description
- 3.6.1. Polyhydroxyalkanoates (PHA)
- 3.7. PRODUCTION OF BIOBASED AND BIODEGRADABLE PLASTICS, BY REGION
- 3.7.1. North America
- 3.7.2. Europe
- 3.7.3. Asia-Pacific
- 3.7.3.1. China
- 3.7.3.2. Japan
- 3.7.3.3. Thailand
- 3.7.3.4. Indonesia
- 3.7.4. Latin America
- 3.8. MARKET SEGMENTATION OF BIOPLASTICS & BIOPOLYMERS
- 3.8.1. Packaging
- 3.8.1.1. Processes for bioplastics in packaging
- 3.8.1.2. Applications
- 3.8.1.3. Flexible packaging
- 3.8.1.3.1. Production volumes 2019-2034
- 3.8.1.4. Rigid packaging
- 3.8.1.4.1. Production volumes 2019-2034
- 3.8.2. Consumer products
- 3.8.2.1. Applications
- 3.8.2.2. Production volumes 2019-2034
- 3.8.3. Automotive
- 3.8.3.1. Applications
- 3.8.3.2. Production volumes 2019-2034
- 3.8.4. Building & construction
- 3.8.4.1. Applications
- 3.8.4.2. Production volumes 2019-2034
- 3.8.5. Textiles
- 3.8.5.1. Apparel
- 3.8.5.2. Footwear
- 3.8.5.3. Medical textiles
- 3.8.5.4. Production volumes 2019-2034
- 3.8.6. Electronics
- 3.8.6.1. Applications
- 3.8.6.2. Production volumes 2019-2034
- 3.8.7. Agriculture and horticulture
- 3.8.7.1. Production volumes 2019-2034
- 3.8.1. Packaging
- 3.9. NATURAL FIBERS
- 3.9.1. Manufacturing method, matrix materials and applications of natural fibers
- 3.9.2. Advantages of natural fibers
- 3.9.3. Commercially available next-gen natural fiber products
- 3.9.4. Market drivers for next-gen natural fibers
- 3.9.5. Challenges
- 3.9.6. Plants (cellulose, lignocellulose)
- 3.9.6.1. Seed fibers
- 3.9.6.1.1. Cotton
- 3.9.6.1.1.1. Production volumes 2018-2034
- 3.9.6.1.2. Kapok
- 3.9.6.1.2.1. Production volumes 2018-2034
- 3.9.6.1.3. Luffa
- 3.9.6.1.1. Cotton
- 3.9.6.2. Bast fibers
- 3.9.6.2.1. Jute
- 3.9.6.2.2. Production volumes 2018-2034
- 3.9.6.2.2.1. Hemp
- 3.9.6.2.2.2. Production volumes 2018-2034
- 3.9.6.2.3. Flax
- 3.9.6.2.3.1. Production volumes 2018-2034
- 3.9.6.2.4. Ramie
- 3.9.6.2.4.1. Production volumes 2018-2034
- 3.9.6.2.5. Kenaf
- 3.9.6.2.5.1. Production volumes 2018-2034
- 3.9.6.3. Leaf fibers
- 3.9.6.3.1. Sisal
- 3.9.6.3.1.1. Production volumes 2018-2034
- 3.9.6.3.2. Abaca
- 3.9.6.3.2.1. Production volumes 2018-2034
- 3.9.6.3.1. Sisal
- 3.9.6.4. Fruit fibers
- 3.9.6.4.1. Coir
- 3.9.6.4.1.1. Production volumes 2018-2034
- 3.9.6.4.2. Banana
- 3.9.6.4.2.1. Production volumes 2018-2034
- 3.9.6.4.3. Pineapple
- 3.9.6.4.1. Coir
- 3.9.6.5. Stalk fibers from agricultural residues
- 3.9.6.5.1. Rice fiber
- 3.9.6.5.2. Corn
- 3.9.6.6. Cane, grasses and reed
- 3.9.6.6.1. Switch grass
- 3.9.6.6.2. Sugarcane (agricultural residues)
- 3.9.6.6.3. Bamboo
- 3.9.6.6.3.1. Production volumes 2018-2034
- 3.9.6.6.4. Fresh grass (green biorefinery)
- 3.9.6.7. Modified natural polymers
- 3.9.6.7.1. Mycelium
- 3.9.6.7.2. Chitosan
- 3.9.6.7.3. Alginate
- 3.9.6.1. Seed fibers
- 3.9.7. Animal (fibrous protein)
- 3.9.7.1. Wool
- 3.9.7.1.1. Alternative wool materials
- 3.9.7.1.2. Producers
- 3.9.7.2. Silk fiber
- 3.9.7.2.1. Alternative silk materials
- 3.9.7.2.1.1. Producers
- 3.9.7.2.1. Alternative silk materials
- 3.9.7.3. Leather
- 3.9.7.3.1. Alternative leather materials
- 3.9.7.3.1.1. Producers
- 3.9.7.3.1. Alternative leather materials
- 3.9.7.4. Fur
- 3.9.7.4.1. Producers
- 3.9.7.5. Down
- 3.9.7.5.1. Alternative down materials
- 3.9.7.5.1.1. Producers
- 3.9.7.5.1. Alternative down materials
- 3.9.7.1. Wool
- 3.9.8. Markets for natural fibers
- 3.9.8.1. Composites
- 3.9.8.2. Applications
- 3.9.8.3. Natural fiber injection moulding compounds
- 3.9.8.3.1. Properties
- 3.9.8.3.2. Applications
- 3.9.8.4. Non-woven natural fiber mat composites
- 3.9.8.4.1. Automotive
- 3.9.8.4.2. Applications
- 3.9.8.5. Aligned natural fiber-reinforced composites
- 3.9.8.6. Natural fiber biobased polymer compounds
- 3.9.8.7. Natural fiber biobased polymer non-woven mats
- 3.9.8.7.1. Flax
- 3.9.8.7.2. Kenaf
- 3.9.8.8. Natural fiber thermoset bioresin composites
- 3.9.8.9. Aerospace
- 3.9.8.9.1. Market overview
- 3.9.8.10. Automotive
- 3.9.8.10.1. Market overview
- 3.9.8.10.2. Applications of natural fibers
- 3.9.8.11. Building/construction
- 3.9.8.11.1. Market overview
- 3.9.8.11.2. Applications of natural fibers
- 3.9.8.12. Sports and leisure
- 3.9.8.12.1. Market overview
- 3.9.8.13. Textiles
- 3.9.8.13.1. Market overview
- 3.9.8.13.2. Consumer apparel
- 3.9.8.13.3. Geotextiles
- 3.9.8.14. Packaging
- 3.9.8.14.1. Market overview
- 3.9.9. Global production of natural fibers
- 3.9.9.1. Overall global fibers market
- 3.9.9.2. Plant-based fiber production
- 3.9.9.3. Animal-based natural fiber production
- 3.10. LIGNIN
- 3.10.1. Introduction
- 3.10.1.1. What is lignin?
- 3.10.1.1.1. Lignin structure
- 3.10.1.2. Types of lignin
- 3.10.1.2.1. Sulfur containing lignin
- 3.10.1.2.2. Sulfur-free lignin from biorefinery process
- 3.10.1.3. Properties
- 3.10.1.4. The lignocellulose biorefinery
- 3.10.1.5. Markets and applications
- 3.10.1.6. Challenges for using lignin
- 3.10.1.1. What is lignin?
- 3.10.2. Lignin production processes
- 3.10.2.1. Lignosulphonates
- 3.10.2.2. Kraft Lignin
- 3.10.2.2.1. LignoBoost process
- 3.10.2.2.2. LignoForce method
- 3.10.2.2.3. Sequential Liquid Lignin Recovery and Purification
- 3.10.2.2.4. A-Recovery+
- 3.10.2.3. Soda lignin
- 3.10.2.4. Biorefinery lignin
- 3.10.2.4.1. Commercial and pre-commercial biorefinery lignin production facilities and processes
- 3.10.2.5. Organosolv lignins
- 3.10.2.6. Hydrolytic lignin
- 3.10.3. Markets for lignin
- 3.10.3.1. Market drivers and trends for lignin
- 3.10.3.2. Production capacities
- 3.10.3.2.1. Technical lignin availability (dry ton/y)
- 3.10.3.2.2. Biomass conversion (Biorefinery)
- 3.10.3.3. Estimated consumption of lignin
- 3.10.3.4. Prices
- 3.10.3.5. Heat and power energy
- 3.10.3.6. Pyrolysis and syngas
- 3.10.3.7. Aromatic compounds
- 3.10.3.7.1. Benzene, toluene and xylene
- 3.10.3.7.2. Phenol and phenolic resins
- 3.10.3.7.3. Vanillin
- 3.10.3.8. Plastics and polymers
- 3.10.3.9. Hydrogels
- 3.10.3.10. Carbon materials
- 3.10.3.10.1. Carbon black
- 3.10.3.10.2. Activated carbons
- 3.10.3.10.3. Carbon fiber
- 3.10.3.11. Concrete
- 3.10.3.12. Rubber
- 3.10.3.13. Biofuels
- 3.10.3.14. Bitumen and Asphalt
- 3.10.3.15. Oil and gas
- 3.10.3.16. Energy storage
- 3.10.3.16.1. Supercapacitors
- 3.10.3.16.2. Anodes for lithium-ion batteries
- 3.10.3.16.3. Gel electrolytes for lithium-ion batteries
- 3.10.3.16.4. Binders for lithium-ion batteries
- 3.10.3.16.5. Cathodes for lithium-ion batteries
- 3.10.3.16.6. Sodium-ion batteries
- 3.10.3.17. Binders, emulsifiers and dispersants
- 3.10.3.18. Chelating agents
- 3.10.3.19. Ceramics
- 3.10.3.20. Automotive interiors
- 3.10.3.21. Fire retardants
- 3.10.3.22. Antioxidants
- 3.10.3.23. Lubricants
- 3.10.3.24. Dust control
- 3.10.1. Introduction
- 3.11. BIOPLASTICS AND BIOPOLYMERS COMPANY PROFILES (503 company profiles)
4. BIO-BASED FUELS MARKET
- 4.1. Comparison to fossil fuels
- 4.2. Role in the circular economy
- 4.3. Market drivers
- 4.4. Market challenges
- 4.5. Liquid biofuels market
- 4.6. SWOT analysis: Biofuels market
- 4.7. Comparison of biofuel costs 2023, by type
- 4.8. Types
- 4.8.1. Solid Biofuels
- 4.8.2. Liquid Biofuels
- 4.8.3. Gaseous Biofuels
- 4.8.4. Conventional Biofuels
- 4.8.5. Advanced Biofuels
- 4.9. Feedstocks
- 4.9.1. First-generation (1-G)
- 4.9.2. Second-generation (2-G)
- 4.9.2.1. Lignocellulosic wastes and residues
- 4.9.2.2. Biorefinery lignin
- 4.9.3. Third-generation (3-G)
- 4.9.3.1. Algal biofuels
- 4.9.3.1.1. Properties
- 4.9.3.1.2. Advantages
- 4.9.3.1. Algal biofuels
- 4.9.4. Fourth-generation (4-G)
- 4.9.5. Advantages and disadvantages, by generation
- 4.9.6. Energy crops
- 4.9.6.1. Feedstocks
- 4.9.6.2. SWOT analysis
- 4.9.7. Agricultural residues
- 4.9.7.1. Feedstocks
- 4.9.7.2. SWOT analysis
- 4.9.8. Manure, sewage sludge and organic waste
- 4.9.8.1. Processing pathways
- 4.9.8.2. SWOT analysis
- 4.9.9. Forestry and wood waste
- 4.9.9.1. Feedstocks
- 4.9.9.2. SWOT analysis
- 4.9.10. Feedstock costs
- 4.10. HYDROCARBON BIOFUELS
- 4.10.1. Biodiesel
- 4.10.1.1. Biodiesel by generation
- 4.10.1.2. SWOT analysis
- 4.10.1.3. Production of biodiesel and other biofuels
- 4.10.1.3.1. Pyrolysis of biomass
- 4.10.1.3.2. Vegetable oil transesterification
- 4.10.1.3.3. Vegetable oil hydrogenation (HVO)
- 4.10.1.3.3.1. Production process
- 4.10.1.3.4. Biodiesel from tall oil
- 4.10.1.3.5. Fischer-Tropsch BioDiesel
- 4.10.1.3.6. Hydrothermal liquefaction of biomass
- 4.10.1.3.7. CO2 capture and Fischer-Tropsch (FT)
- 4.10.1.3.8. Dymethyl ether (DME)
- 4.10.1.4. Prices
- 4.10.1.5. Global production and consumption
- 4.10.2. Renewable diesel
- 4.10.2.1. Production
- 4.10.2.2. SWOT analysis
- 4.10.2.3. Global consumption
- 4.10.2.4. Prices
- 4.10.3. Bio-aviation fuel (bio-jet fuel, sustainable aviation fuel, renewable jet fuel or aviation biofuel)
- 4.10.3.1. Description
- 4.10.3.2. SWOT analysis
- 4.10.3.3. Global production and consumption
- 4.10.3.4. Production pathways
- 4.10.3.5. Prices
- 4.10.3.6. Bio-aviation fuel production capacities
- 4.10.3.7. Challenges
- 4.10.3.8. Global consumption
- 4.10.1. Biodiesel
- 4.11. Bio-naphtha
- 4.11.1. Overview
- 4.12. ALCOHOL FUELS
- 4.12.1. Biomethanol
- 4.12.1.1. SWOT analysis
- 4.12.1.2. Methanol-to gasoline technology
- 4.12.1.2.1. Production processes
- 4.12.1.2.1.1. Anaerobic digestion
- 4.12.1.2.1.2. Biomass gasification
- 4.12.1.2.1.3. Power to Methane
- 4.12.1.2.1. Production processes
- 4.12.2. Ethanol
- 4.12.2.1. Technology description
- 4.12.2.2. 1G Bio-Ethanol
- 4.12.2.3. SWOT analysis
- 4.12.2.4. Ethanol to jet fuel technology
- 4.12.2.5. Methanol from pulp & paper production
- 4.12.2.6. Sulfite spent liquor fermentation
- 4.12.2.7. Gasification
- 4.12.2.7.1. Biomass gasification and syngas fermentation
- 4.12.2.7.2. Biomass gasification and syngas thermochemical conversion
- 4.12.2.8. CO2 capture and alcohol synthesis
- 4.12.2.9. Biomass hydrolysis and fermentation
- 4.12.2.9.1. Separate hydrolysis and fermentation
- 4.12.2.9.2. Simultaneous saccharification and fermentation (SSF)
- 4.12.2.9.3. Pre-hydrolysis and simultaneous saccharification and fermentation (PSSF)
- 4.12.2.9.4. Simultaneous saccharification and co-fermentation (SSCF)
- 4.12.2.9.5. Direct conversion (consolidated bioprocessing) (CBP)
- 4.12.2.10. Global ethanol consumption
- 4.12.3. Biobutanol
- 4.12.3.1. Production
- 4.12.3.2. Prices
- 4.12.1. Biomethanol
- 4.13. BIOMASS-BASED GAS
- 4.13.1. Feedstocks
- 4.13.1.1. Biomethane
- 4.13.1.2. Production pathways
- 4.13.1.2.1. Landfill gas recovery
- 4.13.1.2.2. Anaerobic digestion
- 4.13.1.2.3. Thermal gasification
- 4.13.1.3. SWOT analysis
- 4.13.1.4. Global production
- 4.13.1.5. Prices
- 4.13.1.5.1. Raw Biogas
- 4.13.1.5.2. Upgraded Biomethane
- 4.13.1.6. Bio-LNG
- 4.13.1.6.1. Markets
- 4.13.1.6.1.1. Trucks
- 4.13.1.6.1.2. Marine
- 4.13.1.6.2. Production
- 4.13.1.6.3. Plants
- 4.13.1.6.1. Markets
- 4.13.1.7. bio-CNG (compressed natural gas derived from biogas)
- 4.13.1.8. Carbon capture from biogas
- 4.13.2. Biosyngas
- 4.13.2.1. Production
- 4.13.2.2. Prices
- 4.13.3. Biohydrogen
- 4.13.3.1. Description
- 4.13.3.2. SWOT analysis
- 4.13.3.3. Production of biohydrogen from biomass
- 4.13.3.3.1. Biological Conversion Routes
- 4.13.3.3.1.1. Bio-photochemical Reaction
- 4.13.3.3.1.2. Fermentation and Anaerobic Digestion
- 4.13.3.3.2. Thermochemical conversion routes
- 4.13.3.3.2.1. Biomass Gasification
- 4.13.3.3.2.2. Biomass Pyrolysis
- 4.13.3.3.2.3. Biomethane Reforming
- 4.13.3.3.1. Biological Conversion Routes
- 4.13.3.4. Applications
- 4.13.3.5. Prices
- 4.13.4. Biochar in biogas production
- 4.13.5. Bio-DME
- 4.13.1. Feedstocks
- 4.14. CHEMICAL RECYCLING FOR BIOFUELS
- 4.14.1. Plastic pyrolysis
- 4.14.1.1. Used tires pyrolysis
- 4.14.1.2. Conversion to biofuel
- 4.14.2. Co-pyrolysis of biomass and plastic wastes
- 4.14.3. Gasification
- 4.14.3.1. Syngas conversion to methanol
- 4.14.3.2. Biomass gasification and syngas fermentation
- 4.14.3.3. Biomass gasification and syngas thermochemical conversion
- 4.14.4. Hydrothermal cracking
- 4.14.5. SWOT analysis
- 4.14.1. Plastic pyrolysis
- 4.15. ELECTROFUELS (E-FUELS)
- 4.15.1. Introduction
- 4.15.1.1. Benefits of e-fuels
- 4.15.2. Feedstocks
- 4.15.2.1. Hydrogen electrolysis
- 4.15.2.2. CO2 capture
- 4.15.3. SWOT analysis
- 4.15.4. Production
- 4.15.4.1. eFuel production facilities, current and planned
- 4.15.5. Electrolysers
- 4.15.5.1. Commercial alkaline electrolyser cells (AECs)
- 4.15.5.2. PEM electrolysers (PEMEC)
- 4.15.5.3. High-temperature solid oxide electrolyser cells (SOECs)
- 4.15.6. Prices
- 4.15.7. Market challenges
- 4.15.8. Companies
- 4.15.1. Introduction
- 4.16. ALGAE-DERIVED BIOFUELS
- 4.16.1. Technology description
- 4.16.2. Conversion pathways
- 4.16.3. SWOT analysis
- 4.16.4. Production
- 4.16.5. Market challenges
- 4.16.6. Prices
- 4.16.7. Producers
- 4.17. GREEN AMMONIA
- 4.17.1. Production
- 4.17.2. Decarbonisation of ammonia production
- 4.17.3. Green ammonia projects
- 4.17.4. Green ammonia synthesis methods
- 4.17.4.1. Haber-Bosch process
- 4.17.4.2. Biological nitrogen fixation
- 4.17.4.3. Electrochemical production
- 4.17.4.4. Chemical looping processes
- 4.17.5. SWOT analysis
- 4.17.6. Blue ammonia
- 4.17.6.1. Blue ammonia projects
- 4.17.7. Markets and applications
- 4.17.7.1. Chemical energy storage
- 4.17.7.1.1. Ammonia fuel cells
- 4.17.7.2. Marine fuel
- 4.17.7.1. Chemical energy storage
- 4.17.8. Prices
- 4.17.9. Estimated market demand
- 4.17.10. Companies and projects
- 4.18. BIO-OILS (PYROLYSIS OIL)
- 4.18.1. Description
- 4.18.1.1. Advantages of bio-oils
- 4.18.2. Production
- 4.18.2.1. Fast Pyrolysis
- 4.18.2.2. Costs of production
- 4.18.2.3. Upgrading
- 4.18.3. SWOT analysis
- 4.18.4. Applications
- 4.18.5. Bio-oil producers
- 4.18.6. Prices
- 4.18.1. Description
- 4.19. REFUSE-DERIVED FUELS (RDF)
- 4.19.1. Overview
- 4.19.2. Production
- 4.19.2.1. Production process
- 4.19.2.2. Mechanical biological treatment
- 4.19.3. Markets
- 4.20. COMPANY PROFILES (164 company profiles)
5. BIO-BASED PAINTS AND COATINGS MARKET
- 5.1. The global paints and coatings market
- 5.2. Bio-based paints and coatings
- 5.3. Challenges using bio-based paints and coatings
- 5.4. Types of bio-based coatings and materials
- 5.4.1. Alkyd coatings
- 5.4.1.1. Alkyd resin properties
- 5.4.1.2. Biobased alkyd coatings
- 5.4.1.3. Products
- 5.4.2. Polyurethane coatings
- 5.4.2.1. Properties
- 5.4.2.2. Biobased polyurethane coatings
- 5.4.2.3. Products
- 5.4.3. Epoxy coatings
- 5.4.3.1. Properties
- 5.4.3.2. Biobased epoxy coatings
- 5.4.3.3. Products
- 5.4.4. Acrylate resins
- 5.4.4.1. Properties
- 5.4.4.2. Biobased acrylates
- 5.4.4.3. Products
- 5.4.5. Polylactic acid (Bio-PLA)
- 5.4.5.1. Properties
- 5.4.5.2. Bio-PLA coatings and films
- 5.4.6. Polyhydroxyalkanoates (PHA)
- 5.4.6.1. Properties
- 5.4.6.2. PHA coatings
- 5.4.7. Cellulose nanofibers
- 5.4.7.1. Bacterial Nanocellulose (BNC)
- 5.4.8. Rosins
- 5.4.9. Biobased carbon black
- 5.4.9.1. Lignin-based
- 5.4.9.2. Algae-based
- 5.4.10. Lignin
- 5.4.10.1. Application in coatings
- 5.4.11. Edible coatings
- 5.4.12. Protein-based biomaterials for coatings
- 5.4.12.1. Plant derived proteins
- 5.4.12.2. Animal origin proteins
- 5.4.13. Alginate
- 5.4.1. Alkyd coatings
- 5.5. Market for bio-based paints and coatings
- 5.5.1. Global market revenues to 2034, by market
- 5.6. BIO-BASED PAINTS AND COATINGS COMPANY PROFILES (130 company profiles)
6. CARBON CAPTURE, UTILIZATION AND STORAGE MARKET
- 6.1. Main sources of carbon dioxide emissions
- 6.2. CO2 as a commodity
- 6.3. Meeting climate targets
- 6.4. Market drivers and trends
- 6.5. The current market and future outlook
- 6.6. CCUS Industry developments 2020-2023
- 6.7. CCUS investments
- 6.7.1. Venture Capital Funding
- 6.8. Government CCUS initiatives
- 6.8.1. North America
- 6.8.2. Europe
- 6.8.3. China
- 6.9. Market map
- 6.10. Commercial CCUS facilities and projects
- 6.10.1. Facilities
- 6.10.1.1. Operational
- 6.10.1.2. Under development/construction
- 6.10.1. Facilities
- 6.11. CCUS Value Chain
- 6.12. Key market barriers for CCUS
- 6.13. What is CCUS?
- 6.13.1. Carbon Capture
- 6.13.1.1. Source Characterization
- 6.13.1.2. Purification
- 6.13.1.3. CO2 capture technologies
- 6.13.2. Carbon Utilization
- 6.13.2.1. CO2 utilization pathways
- 6.13.3. Carbon storage
- 6.13.3.1. Passive storage
- 6.13.3.2. Enhanced oil recovery
- 6.13.1. Carbon Capture
- 6.14. Transporting CO2
- 6.14.1. Methods of CO2 transport
- 6.14.1.1. Pipeline
- 6.14.1.2. Ship
- 6.14.1.3. Road
- 6.14.1.4. Rail
- 6.14.2. Safety
- 6.14.1. Methods of CO2 transport
- 6.15. Costs
- 6.15.1. Cost of CO2 transport
- 6.16. Carbon credits
- 6.17. CARBON CAPTURE
- 6.17.1. CO2 capture from point sources
- 6.17.1.1. Transportation
- 6.17.1.2. Global point source CO2 capture capacities
- 6.17.1.3. By source
- 6.17.1.4. By endpoint
- 6.17.2. Main carbon capture processes
- 6.17.2.1. Materials
- 6.17.2.2. Post-combustion
- 6.17.2.3. Oxy-fuel combustion
- 6.17.2.4. Liquid or supercritical CO2: Allam-Fetvedt Cycle
- 6.17.2.5. Pre-combustion
- 6.17.3. Carbon separation technologies
- 6.17.3.1. Absorption capture
- 6.17.3.2. Adsorption capture
- 6.17.3.3. Membranes
- 6.17.3.4. Liquid or supercritical CO2 (Cryogenic) capture
- 6.17.3.5. Chemical Looping-Based Capture
- 6.17.3.6. Calix Advanced Calciner
- 6.17.3.7. Other technologies
- 6.17.3.7.1. Solid Oxide Fuel Cells (SOFCs)
- 6.17.3.7.2. Microalgae Carbon Capture
- 6.17.3.8. Comparison of key separation technologies
- 6.17.3.9. Technology readiness level (TRL) of gas separtion technologies
- 6.17.4. Opportunities and barriers
- 6.17.5. Costs of CO2 capture
- 6.17.6. CO2 capture capacity
- 6.17.7. Bioenergy with carbon capture and storage (BECCS)
- 6.17.7.1. Overview of technology
- 6.17.7.2. Biomass conversion
- 6.17.7.3. BECCS facilities
- 6.17.7.4. Challenges
- 6.17.8. Direct air capture (DAC)
- 6.17.8.1. Description
- 6.17.8.2. Deployment
- 6.17.8.3. Point source carbon capture versus Direct Air Capture
- 6.17.8.4. Technologies
- 6.17.8.4.1. Solid sorbents
- 6.17.8.4.2. Liquid sorbents
- 6.17.8.4.3. Liquid solvents
- 6.17.8.4.4. Airflow equipment integration
- 6.17.8.4.5. Passive Direct Air Capture (PDAC)
- 6.17.8.4.6. Direct conversion
- 6.17.8.4.7. Co-product generation
- 6.17.8.4.8. Low Temperature DAC
- 6.17.8.4.9. Regeneration methods
- 6.17.8.5. Commercialization and plants
- 6.17.8.6. Metal-organic frameworks (MOFs) in DAC
- 6.17.8.7. DAC plants and projects-current and planned
- 6.17.8.8. Markets for DAC
- 6.17.8.9. Costs
- 6.17.8.10. Challenges
- 6.17.8.11. Players and production
- 6.17.9. Other technologies
- 6.17.9.1. Enhanced weathering
- 6.17.9.2. Afforestation and reforestation
- 6.17.9.3. Soil carbon sequestration (SCS)
- 6.17.9.4. Biochar
- 6.17.9.5. Ocean fertilisation
- 6.17.9.6. Ocean alkalinisation
- 6.17.1. CO2 capture from point sources
- 6.18. CARBON UTILIZATION
- 6.18.1. Overview
- 6.18.1.1. Current market status
- 6.18.1.2. Benefits of carbon utilization
- 6.18.1.3. Market challenges
- 6.18.2. Co2. utilization pathways
- 6.18.3. Conversion processes
- 6.18.3.1. Thermochemical
- 6.18.3.1.1. Process overview
- 6.18.3.1.2. Plasma-assisted CO2 conversion
- 6.18.3.2. Electrochemical conversion of CO2
- 6.18.3.2.1. Process overview
- 6.18.3.3. Photocatalytic and photothermal catalytic conversion of CO2
- 6.18.3.4. Catalytic conversion of CO2
- 6.18.3.5. Biological conversion of CO2
- 6.18.3.6. Copolymerization of CO2
- 6.18.3.7. Mineral carbonation
- 6.18.3.1. Thermochemical
- 6.18.4. CO2-derived products
- 6.18.4.1. Fuels
- 6.18.4.1.1. Overview
- 6.18.4.1.2. Production routes
- 6.18.4.1.3. Methanol
- 6.18.4.1.4. Algae based biofuels
- 6.18.4.1.5. CO2-fuels from solar
- 6.18.4.1.6. Companies
- 6.18.4.1.7. Challenges
- 6.18.4.2. Chemicals
- 6.18.4.2.1. Overview
- 6.18.4.2.2. Scalability
- 6.18.4.2.3. Applications
- 6.18.4.2.3.1. Urea production
- 6.18.4.2.3.2. CO2-derived polymers
- 6.18.4.2.3.3. Inert gas in semiconductor manufacturing
- 6.18.4.2.3.4. Carbon nanotubes
- 6.18.4.2.4. Companies
- 6.18.4.3. Construction materials
- 6.18.4.3.1. Overview
- 6.18.4.3.2. CCUS technologies
- 6.18.4.3.3. Carbonated aggregates
- 6.18.4.3.4. Additives during mixing
- 6.18.4.3.5. Concrete curing
- 6.18.4.3.6. Costs
- 6.18.4.3.7. Companies
- 6.18.4.3.8. Challenges
- 6.18.4.4. CO2 Utilization in Biological Yield-Boosting
- 6.18.4.4.1. Overview
- 6.18.4.4.2. Applications
- 6.18.4.4.2.1. Greenhouses
- 6.18.4.4.2.2. Algae cultivation
- 6.18.4.4.2.3. Microbial conversion
- 6.18.4.4.2.4. Food and feed production
- 6.18.4.4.3. Companies
- 6.18.4.1. Fuels
- 6.18.5. CO2 Utilization in Enhanced Oil Recovery
- 6.18.5.1. Overview
- 6.18.5.1.1. Process
- 6.18.5.1.2. CO2 sources
- 6.18.5.2. CO2-EOR facilities and projects
- 6.18.5.3. Challenges
- 6.18.5.1. Overview
- 6.18.6. Enhanced mineralization
- 6.18.6.1. Advantages
- 6.18.6.2. In situ and ex-situ mineralization
- 6.18.6.3. Enhanced mineralization pathways
- 6.18.6.4. Challenges
- 6.18.1. Overview
- 6.19. CARBON STORAGE
- 6.19.1. CO2 storage sites
- 6.19.1.1. Storage types for geologic CO2 storage
- 6.19.1.2. Oil and gas fields
- 6.19.1.3. Saline formations
- 6.19.2. Global CO2 storage capacity
- 6.19.3. Costs
- 6.19.4. Challenges
- 6.19.1. CO2 storage sites
- 6.20. COMPANY PROFILES (243 company profiles)
7. ADVANCED CHEMICAL RECYCLING
- 7.1. Classification of recycling technologies
- 7.2. Introduction
- 7.3. Plastic recycling
- 7.3.1. Mechanical recycling
- 7.3.1.1. Closed-loop mechanical recycling
- 7.3.1.2. Open-loop mechanical recycling
- 7.3.1.3. Polymer types, use, and recovery
- 7.3.2. Advanced chemical recycling
- 7.3.2.1. Main streams of plastic waste
- 7.3.2.2. Comparison of mechanical and advanced chemical recycling
- 7.3.1. Mechanical recycling
- 7.4. The advanced recycling market
- 7.4.1. Market drivers and trends
- 7.4.2. Industry developments 2020-2023
- 7.4.3. Capacities
- 7.4.4. Global polymer demand 2022-2040, segmented by recycling technology
- 7.4.4.1. Resin types
- 7.4.4.1.1. PE
- 7.4.4.1.2. PP
- 7.4.4.1.3. PET
- 7.4.4.1.4. PS
- 7.4.4.1.5. Nylon
- 7.4.4.1.6. Others
- 7.4.4.1. Resin types
- 7.4.5. Global polymer demand 2022-2040, segmented by recycling technology, by region
- 7.4.5.1. Europe
- 7.4.5.2. North America
- 7.4.5.3. South America
- 7.4.5.4. Asia
- 7.4.5.5. Oceania
- 7.4.5.6. Africa
- 7.4.6. Global polymer demand 2022-2040, segmented by region
- 7.4.6.1. PE
- 7.4.6.2. PP
- 7.4.6.3. PET
- 7.4.6.4. PS
- 7.4.6.5. NY
- 7.4.6.6. Others
- 7.4.7. Treatment capacity 2023-2026, segmented by chemical recycling technology
- 7.4.7.1. PE
- 7.4.7.2. PP
- 7.4.7.3. PET
- 7.4.7.4. PS
- 7.4.7.5. Ny
- 7.4.7.6. Others
- 7.4.8. Treatment capacity 2023-2026, segmented by region
- 7.4.8.1. PE
- 7.4.8.2. PP
- 7.4.8.3. PET
- 7.4.8.4. PS
- 7.4.8.5. Ny
- 7.4.8.6. Others
- 7.4.9. Life cycle assessment for each chemical recycling technologies
- 7.4.9.1. Virgin plastic production, mechanical recycling and chemical recycling
- 7.4.9.2. Chemical recycling technologies (pyrolysis, gasification, depolymerization and dissolution)
- 7.4.9.2.1. PE
- 7.4.9.2.2. PP
- 7.4.9.2.3. PET
- 7.4.10. Recycled plastic yield and cost
- 7.4.10.1. Plastic yield of each chemical recycling technologies (,and)
- 7.4.10.2. Prices
- 7.4.11. Chemically recycled plastic products
- 7.4.12. Market map
- 7.4.13. Value chain
- 7.4.14. Life Cycle Assessments (LCA) of advanced chemical recycling processes
- 7.4.15. Market challenges
- 7.5. Advanced recycling technologies
- 7.5.1. Applications
- 7.5.1.1. Pyrolysis
- 7.5.1.2. Non-catalytic
- 7.5.1.3. Catalytic
- 7.5.1.3.1. Polystyrene pyrolysis
- 7.5.1.3.2. Pyrolysis for production of bio fuel
- 7.5.1.3.3. Used tires pyrolysis
- 7.5.1.3.4. Conversion to biofuel
- 7.5.1.3.5. Co-pyrolysis of biomass and plastic wastes
- 7.5.1.4. SWOT analysis
- 7.5.1.4.1. Companies and capacities
- 7.5.2. Gasification
- 7.5.2.1. Technology overview
- 7.5.2.1.1. Syngas conversion to methanol
- 7.5.2.1.2. Biomass gasification and syngas fermentation
- 7.5.2.1.3. Biomass gasification and syngas thermochemical conversion
- 7.5.2.2. SWOT analysis
- 7.5.2.3. Companies and capacities (current and planned)
- 7.5.2.1. Technology overview
- 7.5.3. Dissolution
- 7.5.3.1. Technology overview
- 7.5.3.2. SWOT analysis
- 7.5.3.3. Companies and capacities (current and planned)
- 7.5.4. Depolymerisation
- 7.5.4.1. Hydrolysis
- 7.5.4.1.1. Technology overview
- 7.5.4.1.2. SWOT analysis
- 7.5.4.2. Enzymolysis
- 7.5.4.2.1. Technology overview
- 7.5.4.2.2. SWOT analysis
- 7.5.4.3. Methanolysis
- 7.5.4.3.1. Technology overview
- 7.5.4.3.2. SWOT analysis
- 7.5.4.4. Glycolysis
- 7.5.4.4.1. Technology overview
- 7.5.4.4.2. SWOT analysis
- 7.5.4.5. Aminolysis
- 7.5.4.5.1. Technology overview
- 7.5.4.5.2. SWOT analysis
- 7.5.4.6. Companies and capacities (current and planned)
- 7.5.4.1. Hydrolysis
- 7.5.5. Other advanced chemical recycling technologies
- 7.5.5.1. Hydrothermal cracking
- 7.5.5.2. Pyrolysis with in-line reforming
- 7.5.5.3. Microwave-assisted pyrolysis
- 7.5.5.4. Plasma pyrolysis
- 7.5.5.5. Plasma gasification
- 7.5.5.6. Supercritical fluids
- 7.5.5.7. Carbon fiber recycling
- 7.5.5.7.1. Processes
- 7.5.5.7.2. Companies
- 7.5.1. Applications
- 7.6. COMPANY PROFILES(143 company profiles)

