|
|
市場調査レポート
商品コード
1285681
Cold Storage 2023~光ディスクストレージの COVID-19 による試練と回復~ |
||||||
|
|
|||||||

価格
| Cold Storage 2023~光ディスクストレージの COVID-19 による試練と回復~ |
|
出版日: 2023年04月01日
発行: Fujiwara-Rothchild Ltd.
ページ情報: 和文 123 Pages
納期: 即日から翌営業日
|
- 全表示
- 概要
概要
本報告書は下記の内容を詳細に分析し、エンタープライズ市場の殆どを占めるコールドストレージにおける、光ディスクストレージの役割、ポジション、重要性、今後の拡大動向を示すことを目的としている。
- SSD、HDD、光ディスクストレージ、LTO などのストレージ全体の市場供給動向
- エンタープライズ市場におけるコールドストレージ動向詳細分析
- 各ストレージの個別市場動向、技術動向分析と今後の市場への容量供給能力分析
上記には、それぞれの市場実稼働容量推移を同時に示す。
- エンタープライズ市場のストレージのTier シフトとストレージ選択
- エンタープライズコールドストレージ市場の空き領域容量と新規出荷容量の関係分析
- 光ディスクストレージの主市場である中国のエンタープライズストレージ市場に関する動向分析
コールドストレージ動向の分析結果概要
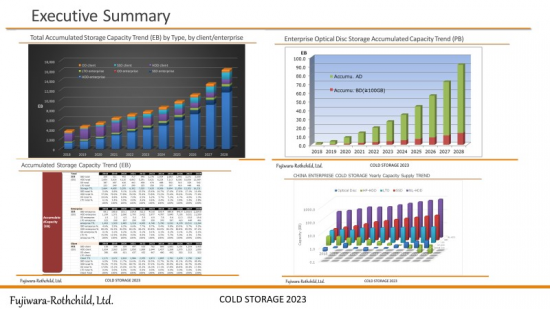
下図には、ポイントとなる主な資料をまとめた。
- 左上:Worldwide accumulated total storage capacity trend
- 左下:Yearly Shipping Capacity(EB) Data Table
- 右上:エンタープライズ光ディスクストレージ市場容量トレンド
- 右下:中国エンタープライズストレージ市場容量トレンドの予測
目次
1. はじめに
2. エグゼクティブサマリ
- 2.1. 本報告書が分析する主な内容
- 2.2. コールドストレージ動向の分析結果概要
3. ストレージ市場の定義と一般動向
- 3.1. 市場の定義(エンタープライズとクライアント)
4. ストレージ容量供給動向
- 4.1. ストレージ市場全体とストレージ構成
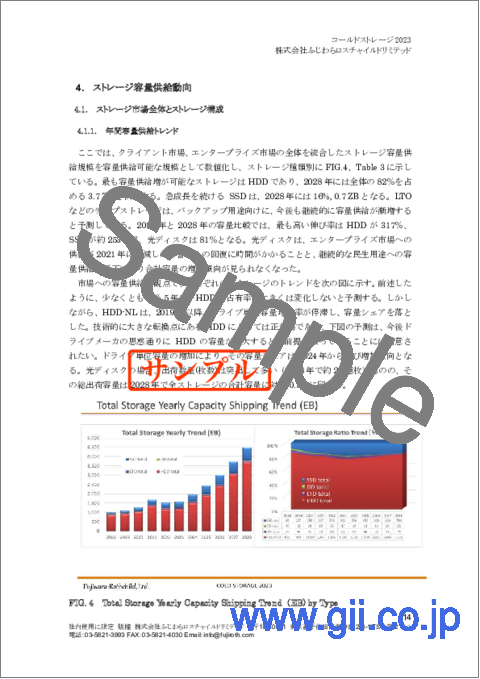
- 4.1.1. 年間容量供給トレンド
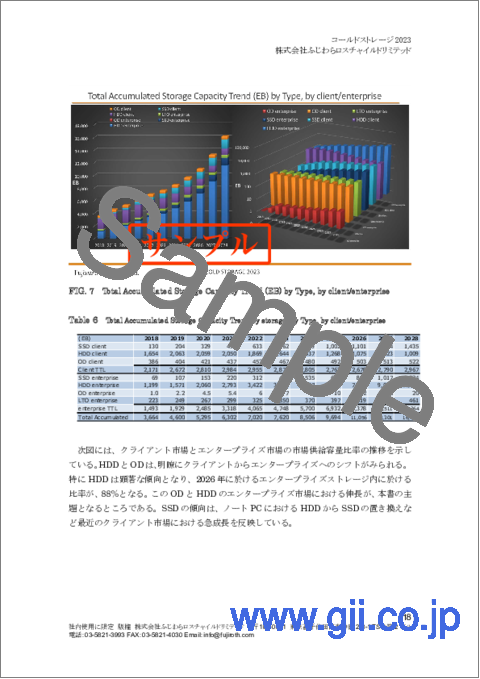
- 4.1.2. 実稼働ストレージ(累積出荷容量)推移
- 4.2. クライアント市場
- 4.3. エンタープライズ市場
- 4.3.1. エンタープライズ市場年間容量供給トレンド
- 4.3.2. エンタープライズストレージ累積容量トレンド
- 4.3.3. エンタープライズコールドストレージの累積容量トレンド
- 4.4. ストレージ出荷容量トレンドテーブル
5. 今後のストレージ容量供給の個別トレンド
- 5.1. HDD エンタープライズストレージの種別
- 5.2. LTO 容量供給動向(~LTO9)
- 5.1. 光ディスクストレージ容量供給動向
- 5.1.1. BD/AD for archive Trend
- 5.1.2. BD/AD 合計の累積容量トレンド
- 5.1.3. AD disc unit trend
- 5.1.4. AD ライブラリの動向分析
6. 各種ストレージの容量ロードマップと技術動向
- 6.1. 各ストレージの一般動向
- 6.1.1. エンタープライズ市場におけるストレージの動向
- 6.1.2. エンタープライズ市場向けストレージの平均出荷ユニット容量
- 6.1.3. 各ストレージの容量トレンド
- 6.1.4. 各ストレージの記録密度の向上トレンド
- 6.1.5. 各ストレージの GB コストトレンド
- 6.2. HDD 技術動向
- 6.2.1. HDD 関連 Terminology
- 6.2.2. HDD 技術ロードマップ
- 6.2.3. HDD new technologies
- 6.2.3.1. シーゲイト
- 50TB 以上の HDD に関する長期ロードマップ
- 6.2.3.2. Western Digital
- 2022 年に 22TB を目指す
- ePMR と OptiNAND で最大 30TB を実現
- 30TB 以上
- 6.2.3.1. シーゲイト
- 6.2.4. 複数の技術的ベクトルの革新
- 6.2.4.1. He-sealed
- 6.2.4.2. Triple Stage Actuator (TSA)
- 6.2.4.3. Shingled Magnetic Recording
- 6.2.4.4. EAMR technology: Enables more Bits per Inch (BPI)
- 6.2.4.5. 東芝デバイス&ストレージ株式会社(以下、東芝)
- 6.2.5. 3 社の現状と今後の方向性のまとめ
- 6.2.6. HAMR
- Materials for heat-assisted magnetic recording
- 6.2.7. MAMR
- Western Digital MAMR Tech Pushes Future HDDs Beyond 40TB
- WD Announces MAMR Breakthrough That Will Bring 40TB Hard Drives By 2025
- 6.3. LTO 技術動向
- 6.3.1. LTO ロードマップ
- 6.3.2. LTO の互換性
- 6.3.3. LTO 技術動向
- 6.4. 光ディスクストレージ(AD)ロードマップ
- 6.4.1. AD 500GB の主要メーカ
- パナソニック
- ソニー
- 6.4.2. AD 光ディスクストレージ 技術動向・課題
- 6.4.3. BD/AD 延長線の多層膜大容量ディスク Folio Photonics’ DataFilm Disc (“DFD”)
- 6.4.4. 将来の 100TB 超の光学メモリ
- 6.4.1. AD 500GB の主要メーカ
7. コールドデータとストレージ選択
- 7.1. 今後のストレージの構成変化
- 7.1.1. 現状のコールドストレージの実稼働容量の増加トレンドにおける課題
- 7.1.2. エンタープライズにおけるストレージシフトの動向
- 7.1.3. トータルデータ流通量に対するストレージ実稼働容量(空き容量考慮)
- 7.2. 光ディスクストレージの階層型ストレージに於ける役割
8. コールドストレージにおける光ディスクアーカイブ市場の拡大可能性
- 8.1. 光ディスクアーカイブがコールドストレージ拡大に寄与するアプリケーション
- 8.2. アプリケーションとビジネスモデル
- 8.3. 光ディスクアーカイブの主なアプリケーションの現状
- 8.3.1. Off-line archive
- Off-line Archive のストレージ構成
- 放送局用途
- 8.3.2. DC 用 コールドストレージ
- 8.3.3. Big data 用途における光ディスクストレージ
- 8.3.1. Off-line archive
9. 中国の光ストレージ関連動向
- 9.1. 中国におけるエンタープライズストレージのトレンド
- 9.2. 中国エンタープライズストレージ市場における光ディスクストレージの現状
- 9.2.1. 中国エンタープライズストレージ市場における光ディスクストレージの市場規模
- 9.2.2. 中国エンタープライズストレージ市場における光ディスクストレージの主なプレーヤ
- 9.2.2.1. Amethystum
- 9.2.2.2. NETZON
- 9.2.2.3. e-Hualu
- 9.3. 中国における光ディスクストレージアプリケーション
- 9.3.1. おもな政府系アーカイブデータの例
- 9.3.2. 档案館
- 9.3.3. 業務用光ディスクの供給体制
- 9.3.4. AD ストレージ関連企業動向
- 9.3.5. 中国の主な関連企業群例
- 9.4. 中国政府のストレージに関連する政策と動向
- 9.4.1. データストレージに関わる中国政府の政策
- 9.4.1.1. 2023 年の変更
- 9.4.1.2. 従来からの継続
- 9.4.2. グリーンデータセンタ
- 9.4.3. 中国政府のビッグデータに関する政策
- 9.4.4. 2021 年科学技術イノベーション 2030 ガイドライン
- 9.4.1. データストレージに関わる中国政府の政策
FIGURE
- FIG. 1 Operating Capacity (ZB) Estimsation by Cumulative capacity
- FIG. 2 Executive Summary
- FIG. 3 Enterprise / Client market
- FIG. 4 Total Storage Yearly Capacity Shipping Trend(EB) by Type
- FIG. 5 Total Storage Yearly Shipping Capacity Trend (EB) by Type, by client/enterprise
- FIG. 6 Total Accumulated Storage Capacity Trend (EB) by Type
- FIG. 7 Total Accumulated Storage Capacity Trend (EB) by Type, by client/enterprise
- FIG. 8 Yearly Capacity ratio trend between Client and Enterprise by Type(%)
- FIG. 9 Client storage yearly shipping capacity trend
- FIG. 10 Enterprise storage yearly shipping capacity trend
- FIG. 11 Enterprise yearly shipping capacity trend by Hot/Cold storage
- FIG. 12 Enterprise Storage Yearly units shipping trend (M units)
- FIG. 13 Enterprise Hot/Cold/Frozen:Yearly Capacity Shipping Ratio Trend(%)
- FIG. 14 Enterprise accumulated capacity trend
- FIG. 15 Accumulated Enterprise Cold Storage Capacity trend (EB)
- FIG. 16 HDD-NL : Gloss capacity & Average capacity per drive Trend (EB/GB)
- FIG. 17 HDD-NL : Impact of 2019 Ave.Cap./Drv. decline on future
- FIG. 18 LTO: non-compressed Capacity Yearly Shipment Trend(EB)
- FIG. 19 LTO: Units Shipping & Capacity Shippment Trend
- FIG. 20 Combination of Storage used for Backup
- FIG. 21 BD disc trend for archive
- FIG. 22 Long-Term Impact of COVID-19 on Optical Disc Slump
- FIG. 23 Enterprise Optical Disc Storage Accumulated Capacity Trend (EB)
- FIG. 24 AD Yearly Capacity Shipment Trend (PB)
- FIG. 25 Archival disc yearly UNITS shipment trend (M units)
- FIG. 26 PANASONIC freeze-ray specification
- FIG. 27 Freeze-ray Roadmap
- FIG. 28 SONY Optical Disc Archive: Roadmap & Cartridge Compatibility
- FIG. 29 SONY Optical Disc Archive
- FIG. 30 2022/2028 Enterprise yearly storage capacity supply ratio by cold storage device
- FIG. 31 2022/2028 Enterprise Accumulated Storage Capacity supply ratio by Cold device
- FIG. 32 Average Capacity Shipment Trend of HDD, LTO, Optical disc
- FIG. 33 Capacity Roadmap of each cold storage device
- FIG. 34 Areal density trend of HDD, LTO, AD
- FIG. 35 Storage bit cost $/GB
- FIG. 36 HDD Capacity Growth Outlook
- FIG. 37 Seagate 20TB HDD
- FIG. 38 HDD Mass Capacity Storage Innovation
- FIG. 39 Seagate HDD Capacity Trend
- FIG. 40 WD Ultrastar He-filled HDDs
- FIG. 41 WD Ultrastar 20TB/22TB
- FIG. 42 WD Triple Stage Actuator and Shingled Magnetic Recording
- FIG. 43 WD Energy Assisted Magnetic Recording (EAMR) technology
- FIG. 44 Toshiba 18TB HDD
- FIG. 45 Toshiba MAS-MAMR
- FIG. 46 High Capacity HDD Road map
- FIG. 47 HAMR technology-1
- FIG. 48 HAMR technology-2
- FIG. 49 HAMR technology: New material requirement
- FIG. 50 MAMR :Spin Torque Oscillator (STO)
- FIG. 51 Spin Torque Oscillator
- FIG. 52 Comparison between MAMR and HAMR
- FIG. 53 Energy assistedhead reliability MAMR/HAMR
- FIG. 54 Key values of MAMR technology
- FIG. 55 Cost : HDD vs SSD
- FIG. 56 LTO Previous Roadmap
- FIG. 57 LTO New RoadMap
- FIG. 58 LTO Compatibility
- FIG. 59 LTO of 580TB using SrFe magnetic particles
- FIG. 60 AD Roadmap & Future Technology of Archival disc
- FIG. 61 AD disc Technologies for capacity increasing (OCP Japan 2016)
- FIG. 62 DFD-1
- FIG. 63 DFD-2
- FIG. 64 DFD-3
- FIG. 65 An example of over 200TB capacity disc technology
- FIG. 66 Large Capacacity Optical disc :Roadmap
- FIG. 67 Enterprise Storage Accumulated Capacity Trend
- FIG. 68 Enterprise storage expansion to Cold storage (direction)
- FIG. 69 Enterprise storage expansion towards Cold storage(2017-2026)
- FIG. 70 Estimation of real operating capacity (2017~2028)
- FIG. 71 Estimation of Real operating Capacity (2021-2026)
- FIG. 72 HDD Shipping Units Trend (2017-2026)
- FIG. 73 Target of Optical disc cold archive
- FIG. 74 Business models of Optical storage
- FIG. 75 Examples of optical storage application
- FIG. 76 Example of archive system configuration 1
- FIG. 77 Example of archive system configuration 2
- FIG. 78 Example of SNS optical disc archive configuration
- FIG. 79 Example of a Archive system solution for Big data
- FIG. 80 China Enterprise Storage Yearly Capacity Supply Trend
- FIG. 81 China Enterprise Storage Yearly Capacity Supply Trend(Log scale)
- FIG. 82 China Enterprise Optical Storage Market Trend
- FIG. 83 Major Optical archive solution providers in China
- FIG. 84 Netzon product list
- FIG. 85 e-Hualu Optical Storage Business
- FIG. 86 e-Hualu の大手企業との連携-1
- FIG. 87 e-Hualu の大手企業との連携-2
- FIG. 88 データレイク動向
- FIG. 89 Optical Disc Storage Applications in China: Potential Market
- FIG. 90 Professional Optical Disc Suppler
- FIG. 91 Optical archive system companies in China
- FIG. 92 Major players of each categories
- FIG. 93 SNS related major companies
- FIG. 94 Major Telecom Companies
TABLE
- Table 1 Applications and Storages
- Table 2 Average shipping capacity/unit of each HDD types (GB)
- Table 3 Total Storage Yearly Capacity Shipping Trend(EB) by Type
- Table 4 Total Storage Yearly Shipping Capacity Trend (EB) by Type, by client/enterprise
- Table 5 Total Accumulated Storage Capacity Trend(EB) by Type
- Table 6 Total Accumulated Storage Capacity Trend by storage, by Type, by client/enterpris
- Table 7 Yearly Capacity ratio trend between Client and Enterprise by Type(%)
- Table 8 Client storage yearly shipping capacity trend
- Table 9 Enterprise storage yearly shipping capacity trend
- Table 10 Enterprise yearly shipping capacity trend by Hot/Cold storage
- Table 11 Enterprise Storage Yearly units shipping trend (M units)
- Table 12 Enterprise accumulated capacity trend
- Table 13 Accumulated Enterprise Cold Storage Capacity trend (EB)
- Table 14 Yearly Shipping Capacity (EB)
- Table 15 Accumulated Storage Capacity (EB)
- Table 16 HDD-NL : Gloss capacity & Average capacity per drive Trend (EB/GB)
- Table 17 LTO: non-compressed Capacity Yearly Shipment Trend(EB)
- Table 18 LTO Units Shipping Trend
- Table 19 BD disc trend for archive
- Table 20 Enterprise Optical Disc Storage Accumulated Capacity Trend (EB)
- Table 21 AD Yearly Capacity Shipment Trend (PB)
- Table 22 Archival disc yearly UNITS shipment trend (M units)
- Table 23 Average Capacity/units Trend of HDD, LTO, Optical disc
- Table 24 Capacity Roadmap of each cold storage device
- Table 25 Accumulated Enterprise Cold Storage Capacity Trend
- Table 26 China Enterprise Storage Yearly Capacity Supply Trend