|
|
市場調査レポート
商品コード
1542901
In Vitro毒性試験の世界市場:2024年~2031年Global In Vitro Toxicology Testing Market - 2024-2031 |
||||||
|
|
|||||||
カスタマイズ可能
適宜更新あり
|
|||||||


| In Vitro毒性試験の世界市場:2024年~2031年 |
|
出版日: 2024年08月26日
発行: DataM Intelligence
ページ情報: 英文 183 Pages
納期: 即日から翌営業日
|

- 全表示
- 概要
- 目次
概要
世界のIn Vitro毒性試験市場は、2023年に109億6,077万米ドルに達し、2031年には220億3,529万米ドルに達すると予測され、予測期間2024-2031年のCAGRは9.3%で成長する見込みです。
In Vitroモデルは、化粧品、医薬品、薬物療法の毒性試験において重要な役割を果たしています。In Vitro細胞培養の進歩により、研究者は生きた動物実験に代わる、あるいはそれを補完する実行可能な方法を手に入れました。
In Vitroモデルには、動物実験よりも倫理的・経済的に有利な点がいくつかあります。これらのアッセイは、毒性試験パイプラインの早い段階で使用され、多くの場合、リスクアセスメントを決定したり、最終的に動物の命を救うためのコントロールを設定するために使用されています。低コストでスループットの高いアッセイを組み合わせることで、製品をより早く市場に投入することができます。さらに、in vitroモデルは、生きた動物の目視検査に頼るよりも早く、毒性反応に関与する生物学的プロセスを理解する上で研究者に優位性をもたらします。
市場力学:
促進要因と抑制要因
In Vitro毒性試験の進歩の高まり
in-vitro毒性試験の技術的進歩により、動物試験よりも好ましい方法となっています。規制機関は、これらの方法を検証し受け入れるようになっており、市場を後押ししています。一部の国では、遺伝子組み換え食品、ワクチン、機器、医薬品、工業用化学物質、殺虫剤など、特定の消費者向け商品を販売する前に動物遺伝毒性試験を行うことが義務付けられています。
さらに、幹細胞由来の心筋細胞に関する最近の動向により、研究者はヒト細胞を用いたより正確で再現性の高いin vitroアッセイを開発できるようになった。将来的には、幹細胞由来の心筋細胞を三次元構造に組み込んで、薬物の安全性スクリーニングに利用することが期待されています。
さらに、体外毒物検査市場は、ヘルスケアサービスの需要増加、政府の取り組み増加など、予測期間中の市場成長を後押しする様々な要因によっても牽引されています。
抑制要因
In Vitro毒性試験は、いくつかの国で動物実験が禁止されているため、認知度が高まっています。しかし、in vivo試験と比較すると、依然として妥当性を実証する必要があります。In Vitro試験では、被験物質の作用機序を判定するだけで、代謝後の結果は判定できないです。ある化学物質が有害でなくても、その代謝物が有害である可能性はあります。
目次
第1章 調査手法と調査範囲
第2章 定義と概要
第3章 エグゼクティブサマリー
第4章 市場力学
- 影響要因
- 促進要因
- 体外毒性試験の進歩の高まり
- 政府のイニシアティブの高まり
- 抑制要因
- 規制上の課題
- 機会
- 影響分析
- 促進要因
第5章 産業分析
- ポーターのファイブフォース分析
- サプライチェーン分析
- 価格分析
- 規制分析
- アンメットニーズ
- DMIの見解
第6章 COVID-19分析
第7章 製品・サービスタイプ別
- アッセイ
- 消耗品
- 機器
- サービス
- ソフトウェア
第8章 毒性別
- 細胞毒性
- 遺伝子毒性
- 心毒性
- 肝毒性
- 眼毒性
- その他
第9章 技術別
- 細胞培養
- ハイスループットスクリーニング
- トキシコゲノミクス
第10章 エンドユーザー別
- 製薬・バイオ医薬品企業
- コンシューマーケア・食品業界
- その他
第11章 地域別
- 北米
- 米国
- カナダ
- メキシコ
- 欧州
- ドイツ
- 英国
- フランス
- イタリア
- スペイン
- その他欧州
- 南米
- ブラジル
- アルゼンチン
- その他南米
- アジア太平洋
- 中国
- インド
- 日本
- オーストラリア
- その他アジア太平洋地域
- 中東・アフリカ
第12章 競合情勢
- 競合シナリオ
- 市況/シェア分析
- M&A分析
第13章 企業プロファイル
- Charles River Laboratories International, Inc.
- 会社概要
- 製品ポートフォリオと説明
- 財務概要
- 主な発展
- SGS S.A.
- Eurofins Scientific
- Laboratory Corporation of America Holdings
- Evotec S.E.
- Agilent Technologies, Inc.
- Catalent, Inc.
- Bio-Rad Laboratories, Inc.
- BioIVT
- Gentronix(LIST NOT EXHAUSTIVE)
第14章 付録
Overview
The Global In-vitro Toxicology Testing Market reached US$ 10,960.77 million in 2023 and is expected to reach US$ 22,035.29 million by 2031, growing at a CAGR of 9.3% during the forecast period 2024-2031.
In vitro models play an important role in the toxicity testing of cosmetics, drugs and pharmaceutical therapies. Advancements in in vitro cell culture have given researchers a viable alternative and/or complement to live animal testing.
In vitro models offer several ethical and economic advantages over animal testing. These assays are being used earlier in toxicity testing pipelines, often to determine risk assessment and/or set up controls that will ultimately spare animal life. The combination of lower-cost and higher throughput assays can help bring products to market faster. Additionally, in vitro models give researchers an advantage in understanding the biological process involved in a toxic response sooner than if they were depending on the visual inspection of a live animal.
Market Dynamics: Drivers and Restraints
Rise in advancements in in-vitro toxicology testing
Technological advancements in in-vitro toxicology testing have made it a preferred method over animal testing. Regulatory agencies are increasingly validating and accepting these methods, boosting the market. In some countries, animal geno-toxicology testing is mandated before marketing certain consumer items, such as genetically modified foods, vaccines, devices, drugs, industrial chemicals, and pesticides.
Additionally, recent advancements in the understanding of stem cell-derived cardiomyocytes have allowed researchers to develop more accurate and reproducible in vitro assays that are based on human cells. Future work in this area hopes to use stem cell-derived cardiomyocytes that have been integrated into three-dimensional structures for an additional layer of drug safety screening.
Furthermore, the in-vitro toxicology testing market is also driven by various other factors like the rise in demand for healthcare services, rise in the government initiatives and others that help the market to grow during the forecast period.
Restraint
In vitro toxicity testing is gaining recognition due to animal testing bans in several countries. However, it still needs to demonstrate validity compared to in vivo tests. In vitro tests only determine the mechanism of action of test substances, not their outcomes after metabolism. Although a chemical substance may not be harmful, its metabolites can be detrimental.
Segment Analysis
The global in-vitro toxicology testing market is segmented based on product and service type, toxicity, technology, end-user and region.
The assays from the product and service type segment accounted for approximately 39.7% of the in-vitro toxicology testing market share
The assays from the product and service type segment accounted for approximately 39.7% and are expected to dominate during the forecast period. In vitro toxicity assays are some of the most useful preclinical methods of not only determining a drug's safety profile but also providing an opportunity for researchers to improve its properties before reaching clinical trials.
In vitro toxicology assays, in silico and chemical testing approaches, are crucial in identifying alternative methods to traditional animal-based toxicity testing. These services support metabolic, toxicokinetic, and bioanalytical investigations with qualitative and quantitative data, promoting the 3Rs (Replacement, Reduction, and Refinement) approach.
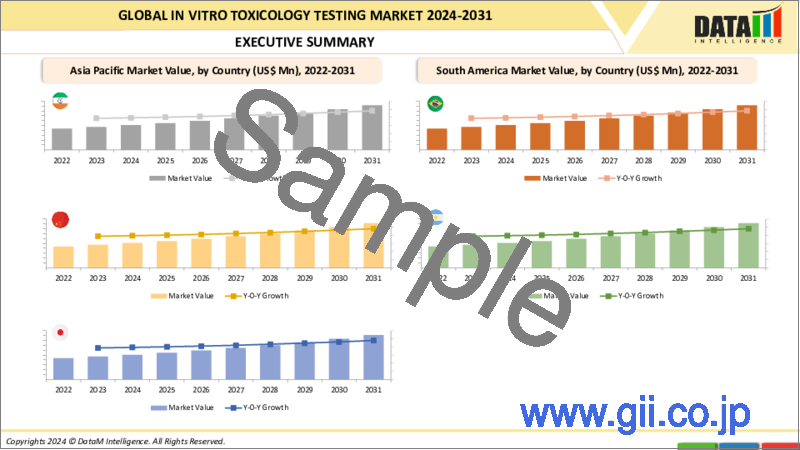
Geographical Share
North America accounted for approximately 38.4% of the market share in 2022
North America is estimated to hold about 38.4% of the total market share throughout the forecast period owing to the factors like acquisitions by companies, rising government funding for research of therapeutics, increased healthcare expenditure, advanced infrastructure & processes for drug discovery and strong regulatory framework for approval has increased the demand as well as adoption on in-vitro testing methods in this region's market.
For instance, in March 2023, Agilent Technologies, Inc. (US) acquired e-MSion (US). Through this acquisition, Agilent will integrate the e-MSion's ExD cell into its portfolio of advanced workflows, instruments, and analytical solutions for biotherapeutic characterization and development.
Moreover, in September 2022, ioIVT disclosed the successful acquisition of XenoTech, showcasing its dedication to offering extensive research models and services to biopharmaceutical customers for improved drug development and diagnostic research.
COVID-19 Impact Analysis
The COVID-19 pandemic had a substantial impact on the overall market resulting in limitations of movement and restrictions due to which the market observed a short-term decline in growth. However, as there were multiple drug discovery processes, various drug development programs & and high research activities, the market demand for in-vitro toxicology testing accelerated eventually.
Market Key Players
The major global players in the market include Charles River Laboratories International, Inc., SGS S.A., Eurofins Scientific, Laboratory Corporation of America Holdings, Evotec S.E., Agilent Technologies, Inc., Catalent, Inc., Bio-Rad Laboratories, Inc., BioIVT, Gentronix and among others.
Key Developments
In January 2023, Eurofins Scientific expanded its presence in India with the establishment of a new, fully equipped, state-of-the-art laboratory campus in Genome Valley, Hyderabad. The lab will support pharma and biotech companies in the areas of synthetic organic chemistry, analytical R&D, bioanalytical services, in vivo pharmacology, safety toxicology, and formulation R&D.
In January 2021, Charles River stated a partnership with Cypre, Inc., for the expansion of services of 3D in-vitro models for immunotherapy treatment of cancer as well as targeted therapy drug screening. This partnership enabled the company to access Cypre's patented 3D hydrogel technology or Falcon-X to expand Charles River's services.
Why Purchase the Report?
To visualize the global in-vitro toxicology testing market segmentation based on product and service type, toxicity, technology, end-user and region as well as understand key commercial assets and players.
Identify commercial opportunities by analyzing trends and co-development.
Excel data sheet with numerous data points of in-vitro toxicology testing market-level with all segments.
PDF report consists of a comprehensive analysis after exhaustive qualitative interviews and an in-depth study.
Product mapping available as excel consisting of key products of all the major players.
The global in-vitro toxicology testing market report would provide approximately 69 tables, 70 figures and 183 pages.
Target Audience 2024
Manufacturers/ Buyers
Industry Investors/Investment Bankers
Research Professionals
Emerging Companies
Table of Contents
1. Methodology and Scope
- 1.1. Research Methodology
- 1.2. Research Objective and Scope of the Report
2. Definition and Overview
3. Executive Summary
- 3.1. Snippet by Product and Service Type
- 3.2. Snippet by Toxicity
- 3.3. Snippet by Technology
- 3.4. Snippet by End User
- 3.5. Snippet by Region
4. Market Dynamics
- 4.1. Impacting Factors
- 4.1.1. Drivers
- 4.1.1.1. Rise in advancements in in-vitro toxicology testing
- 4.1.1.2. Rise in the government initiatives
- 4.1.2. Restraints
- 4.1.2.1. Regulatory Challenges
- 4.1.3. Opportunity
- 4.1.4. Impact Analysis
- 4.1.1. Drivers
5. Industry Analysis
- 5.1. Porter's Five Force Analysis
- 5.2. Supply Chain Analysis
- 5.3. Pricing Analysis
- 5.4. Regulatory Analysis
- 5.5. Unmet Needs
- 5.6. DMI Opinion
6. COVID-19 Analysis
- 6.1. Analysis of COVID-19
- 6.1.1. Scenario Before COVID
- 6.1.2. Scenario During COVID
- 6.1.3. Scenario Post COVID
- 6.2. Pricing Dynamics Amid COVID-19
- 6.3. Demand-Supply Spectrum
- 6.4. Government Initiatives Related to the Market During Pandemic
- 6.5. Manufacturers' Strategic Initiatives
- 6.6. Conclusion
7. By Product and Service Type
- 7.1. Introduction
- 7.1.1. Market Size Analysis and Y-o-Y Growth Analysis (%), By Product and Service Type
- 7.1.2. Market Attractiveness Index, By Product and Service Type
- 7.2. Assays *
- 7.2.1. Introduction
- 7.2.2. Market Size Analysis and Y-o-Y Growth Analysis (%)
- 7.3. Consumables
- 7.4. Equipment
- 7.5. Services
- 7.6. Software
8. By Toxicity
- 8.1. Introduction
- 8.1.1. Market Size Analysis and Y-o-Y Growth Analysis (%), By Toxicity
- 8.1.2. Market Attractiveness Index, By Toxicity
- 8.2. Cytotoxicity *
- 8.2.1. Introduction
- 8.2.2. Market Size Analysis and Y-o-Y Growth Analysis (%)
- 8.3. Gene Toxicity
- 8.4. Cardiotoxicity
- 8.5. Hepatotoxicity
- 8.6. Ophthalmic Toxicity
- 8.7. Others
9. By Technology
- 9.1. Introduction
- 9.1.1. Market Size Analysis and Y-o-Y Growth Analysis (%), By Technology
- 9.1.2. Market Attractiveness Index, By Technology
- 9.2. Cell Culture*
- 9.2.1. Introduction
- 9.2.2. Market Size Analysis and Y-o-Y Growth Analysis (%)
- 9.3. High Throughput Screening
- 9.4. Toxicogenomics
10. By End User
- 10.1. Introduction
- 10.1.1. Market Size Analysis and Y-o-Y Growth Analysis (%), By End User
- 10.1.2. Market Attractiveness Index, By End User
- 10.2. Pharmaceutical and Biopharmaceutical Companies*
- 10.2.1. Introduction
- 10.2.2. Market Size Analysis and Y-o-Y Growth Analysis (%)
- 10.3. Consumer Care and Food Industry
- 10.4. Others
11. By Region
- 11.1. Introduction
- 11.1.1. Market Size Analysis and Y-o-Y Growth Analysis (%), By Region
- 11.1.2. Market Attractiveness Index, By Region
- 11.2. North America
- 11.2.1. Introduction
- 11.2.2. Key Region-Specific Dynamics
- 11.2.3. Market Size Analysis and Y-o-Y Growth Analysis (%), By Product and Service Type
- 11.2.4. Market Size Analysis and Y-o-Y Growth Analysis (%), By Toxicity
- 11.2.5. Market Size Analysis and Y-o-Y Growth Analysis (%), By Technology
- 11.2.6. Market Size Analysis and Y-o-Y Growth Analysis (%), By End User
- 11.2.7. Market Size Analysis and Y-o-Y Growth Analysis (%), By Country
- 11.2.7.1. The U.S.
- 11.2.7.2. Canada
- 11.2.7.3. Mexico
- 11.3. Europe
- 11.3.1. Introduction
- 11.3.2. Key Region-Specific Dynamics
- 11.3.3. Market Size Analysis and Y-o-Y Growth Analysis (%), By Product and Service Type
- 11.3.4. Market Size Analysis and Y-o-Y Growth Analysis (%), By Toxicity
- 11.3.5. Market Size Analysis and Y-o-Y Growth Analysis (%), By Technology
- 11.3.6. Market Size Analysis and Y-o-Y Growth Analysis (%), By End User
- 11.3.7. Market Size Analysis and Y-o-Y Growth Analysis (%), By Country
- 11.3.7.1. Germany
- 11.3.7.2. UK
- 11.3.7.3. France
- 11.3.7.4. Italy
- 11.3.7.5. Spain
- 11.3.7.6. Rest of Europe
- 11.4. South America
- 11.4.1. Introduction
- 11.4.2. Key Region-Specific Dynamics
- 11.4.3. Market Size Analysis and Y-o-Y Growth Analysis (%), By Product and Service Type
- 11.4.4. Market Size Analysis and Y-o-Y Growth Analysis (%), By Toxicity
- 11.4.5. Market Size Analysis and Y-o-Y Growth Analysis (%), By Technology
- 11.4.6. Market Size Analysis and Y-o-Y Growth Analysis (%), By End User
- 11.4.7. Market Size Analysis and Y-o-Y Growth Analysis (%), By Country
- 11.4.7.1. Brazil
- 11.4.7.2. Argentina
- 11.4.7.3. Rest of South America
- 11.5. Asia-Pacific
- 11.5.1. Introduction
- 11.5.2. Market Size Analysis and Y-o-Y Growth Analysis (%), By Product and Service Type
- 11.5.3. Market Size Analysis and Y-o-Y Growth Analysis (%), By Toxicity
- 11.5.4. Market Size Analysis and Y-o-Y Growth Analysis (%), By Technology
- 11.5.5. Market Size Analysis and Y-o-Y Growth Analysis (%), By End User
- 11.5.6. Market Size Analysis and Y-o-Y Growth Analysis (%), By Country
- 11.5.6.1. China
- 11.5.6.2. India
- 11.5.6.3. Japan
- 11.5.6.4. Australia
- 11.5.6.5. Rest of Asia-Pacific
- 11.6. Middle East and Africa
- 11.6.1. Introduction
- 11.6.2. Key Region-Specific Dynamics
- 11.6.3. Market Size Analysis and Y-o-Y Growth Analysis (%), By Product and Service Type
- 11.6.4. Market Size Analysis and Y-o-Y Growth Analysis (%), By Toxicity
- 11.6.5. Market Size Analysis and Y-o-Y Growth Analysis (%), By Technology
- 11.6.6. Market Size Analysis and Y-o-Y Growth Analysis (%), By End User
12. Competitive Landscape
- 12.1. Competitive Scenario
- 12.2. Market Positioning/Share Analysis
- 12.3. Mergers and Acquisitions Analysis
13. Company Profiles
- 13.1. Charles River Laboratories International, Inc.*
- 13.1.1. Company Overview
- 13.1.2. Product Portfolio and Description
- 13.1.3. Financial Overview
- 13.1.4. Key Developments
- 13.2. SGS S.A.
- 13.3. Eurofins Scientific
- 13.4. Laboratory Corporation of America Holdings
- 13.5. Evotec S.E.
- 13.6. Agilent Technologies, Inc.
- 13.7. Catalent, Inc.
- 13.8. Bio-Rad Laboratories, Inc.
- 13.9. BioIVT
- 13.10. Gentronix (LIST NOT EXHAUSTIVE)
14. Appendix
- 14.1. About Us and Services
- 14.2. Contact Us
