|
|
市場調査レポート
商品コード
1423506
コンシューマーエレクトロニクスの世界市場:2024年~2031年Global Consumer Electronics Market - 2024-2031 |
||||||
カスタマイズ可能
適宜更新あり
|
|||||||


| コンシューマーエレクトロニクスの世界市場:2024年~2031年 |
|
出版日: 2024年02月09日
発行: DataM Intelligence
ページ情報: 英文 203 Pages
納期: 即日から翌営業日
|

- 全表示
- 概要
- 目次
概要
世界のコンシューマーエレクトロニクス市場は、2023年に69億米ドルに達し、2031年までに98億米ドルに達し、予測期間の2024年から2031年のCAGRは4.1%で成長すると予測されています。
COVID-19の大流行時には、世界各国の政府がロックダウンを実施し、個人が屋内にとどまるようになりました。ロックダウンの結果、人々は屋内の娯楽オプションに関心を持つようになりました。映画スタジオは、映画館の閉鎖と同時に、オーバー・ザ・トップ・プラットフォームで作品を公開しました。新作映画はストリーミングサービスでレンタルや購入ができ、視聴者はスマートテレビやスマートフォンで観ることができるようになり、消費者向けガジェットの需要が高まりました。
オンラインビデオストリーミングの大幅な増加につながり、スマートTVの需要も増加しました。さまざまな消費者のニーズを満たすため、市場のリーダーたちは競合価格と独自の機能を備えた新商品を発売しています。例えば、Samsung Electronics Co. Ltd. は、2022年4月にNeo QLED 8KスマートTVラインを発表しました。画面サイズが65インチと85インチのテレビが発売されました。
2023年には、北米が世界の家電市場の1/4以上を占める第2の支配地域になると予想されます。北米のコンシューマーエレクトロニクス部門は、その普及率の高さから、最も重要な地域産業に発展すると予想されます。アンドロイド・オペレーティング・システムと多くのリファレンス・デザイン・プラットフォームの人気に後押しされ、スマートフォンへの参入障壁は大幅に低下しています。
力学
高まる技術進歩
コンシューマーエレクトロニクス市場は、技術に精通した人口、高い可処分所得、最新機器への強い欲求によって牽引されています。コンピューター、スマートフォン、スマート家電の市場シェアは大きいです。スマート・スピーカー、ストリーミング・サービス、5G技術はいずれも人気を集めています。Microsoft、IBM、Googleといったコンピューター業界の巨人たちは、最先端のAIに多額の投資を行っています。予測期間中、革新的な感覚技術はおそらく家電製品にも変化をもたらすと思われます。
地域協会が博覧会や見本市を主催するのは、イノベーションが成功の重要な要素であると認識しているからです。例えば、毎年開催されるコンシューマーエレクトロニクス・イベントは、米国のコンシューマー・テクノロジー業界を代表する団体であるConsumer Technology Associationが主催する世界のトレード・イベントです。この見本市の目的は、顧客が電子機器を体験する方法を変革するために、技術革新を促進し、加速させることです。
家庭からの需要の増加とライフスタイルの変化
世界のコンシューマーエレクトロニクス市場の成長は、可処分所得の増加、資金調達のしやすさ、個人のライフスタイルの変化、家庭からの需要の増加など、さまざまな要因に起因しています。インドのコンシューマーエレクトロニクス産業は、世界市場の大手企業から多額の海外直接投資とM&A政策を引き寄せています。
Make in Indiaの推進に伴い、電子開発基金政策が採用され、転嫁された関税制度を合理化することを目的としています。さらに15%から20%のCAPEX補助金を提供するため、Modified Special Incentive Package Scheme(M-SIPS)が導入されました。今後数年間、家電メーカーは研究開発、生産、流通への支出を増やす計画であり、これが市場の成長を促進します。
模倣品の存在
模倣品は正規ブランドに対する消費者の信頼を損ないます。消費者はブランド名のある製品の正当性や品質に懐疑的になり、信頼性の低下を引き起こします。模倣品はブランドの信頼性を損なうだけでなく、収益も減少させます。さらに、ユーザーの安全やセキュリティも阻害することになります。
競合優位性を保ち、顧客の利益を守るために、企業は技術革新、品質管理、模倣品対策を優先しなければなりません。正規の生産者は、見かけの似た製品を安価で提供する模倣品業者との不公正な競争に直面しています。これは正規企業の市場シェアと収益性に悪影響を及ぼします。
目次
第1章 調査手法と調査範囲
第2章 定義と概要
第3章 エグゼクティブサマリー
第4章 市場力学
- 影響要因
- 促進要因
- 技術の進歩
- 家庭からの需要の増加とライフスタイルの変化
- 抑制要因
- 偽造品の存在
- 機会
- 影響分析
- 促進要因
第5章 産業分析
- ポーターのファイブフォース分析
- サプライチェーン分析
- 価格分析
- 規制分析
- ロシア・ウクライナ戦争の影響分析
- DMIの見解
第6章 COVID-19分析
第7章 タイプ別
- 電子機器
- デジタルビデオカメラ/DVR、カメラ
- スマートフォン/フィーチャーフォン&タブレット
- スマートテレビ
- プリンター/セットトップボックス
- パソコン&ゲーム機
- ウェアラブル端末
- スマートウォッチ
- スマートアクセサリー
- その他
- 家電製品
- 冷蔵庫
- エアコン
- 証券・空調システム
- スマートキッチン
- その他
- その他
第8章 流通チャネル別
- ハイパーマーケット/スーパーマーケット
- 専門店
- マルチブランドストア
- オンライン小売業者
- 卸売業者・流通業者
- その他
第9章 エンドユーザー別
- 住宅
- 商業
第10章 地域別
- 北米
- 米国
- カナダ
- メキシコ
- 欧州
- ドイツ
- 英国
- フランス
- イタリア
- ロシア
- その他欧州
- 南米
- ブラジル
- アルゼンチン
- その他南米
- アジア太平洋
- 中国
- インド
- 日本
- オーストラリア
- その他アジア太平洋
- 中東・アフリカ
第11章 競合情勢
- 競合シナリオ
- 市況/シェア分析
- M&A分析
第12章 企業プロファイル
- Samsung Electronics Co. Ltd.
- 会社概要
- 製品ポートフォリオと説明
- 財務概要
- 主な発展
- LG Electronics Co. Ltd.
- Apple, Inc.
- Hitachi Ltd.
- Koninklijke Philips N.V.
- Sony Corporation
- ThermaGreen Blocks
- Hewlett Packard Inc.
- Toshiba Corporation
- Panasonic Corporation
第13章 付録
Overview
Global Consumer Electronics Market reached US$ 6.9 billion in 2023 and is expected to reach US$ 9.8 billion by 2031, growing with a CAGR of 4.1% during the forecast period 2024-2031.
Governments globally imposed lockdowns during COVID-19 pandemic, leading individuals to remain indoors. People become more interested in indoor entertainment options as a result of the lockdowns. Film studios released their productions concurrently with the closure of theatres on over-the-top platforms. New films can be rented or bought on streaming services and viewers could watch them on smart TVs and smartphones, increasing demand for consumer gadgets.
It led to a significant increase in online video streaming, which in turn increased demand for smart TVs. To meet the needs of a variety of consumers, market leaders are launching new goods with competitive prices and unique features. For example, Samsung Electronics Co. Ltd. introduced its Neo QLED 8K smart TV line in April 2022. Televisions with screens measuring 65 and 85 inches were included in the launch.
In 2023, North America is expected to be the second-dominant region holding over 1/4th of the global consumer electronics market. The consumer electronics sector in North America is expected to develop into the most important regional industry due to its high penetration. Driven in large part to the popularity of the Android operating system and many reference design platforms, the entry barriers for smartphones have significantly decreased.
Dynamics
Growing Technological Advancements
The consumer electronics markets are driven by a tech-savvy population, high disposable incomes and a strong desire for the newest devices. The market share of computers, smartphones and smart home appliances is significant. Smart speakers, streaming services and 5G technology are all gaining popularity. Giants of the computer industry like Microsoft, IBM and Google are making significant investments in cutting edge AI. During the forecast period, innovative sensory technology is probably going to change consumer electronics as well.
Regional associations host expos and trade exhibitions because they recognise innovation as a critical component of success. For example, the annual consumer electronics event is a global trade event organised by the Consumer Technology Association, an association that represents U.S. consumer technology industry. The goal of the show is to promote and accelerate technological innovation in order to revolutionise the way customers experience electronic devices.
An Increase in Demand from Households and Changing Lifestyles
The rise in the global consumer electronics market is attributed to various factors such as growing disposable incomes, better access to financing, shifting lifestyles of individuals and increased demand from households. The consumer electronics industry in India has drawn significant foreign direct investment and merger and acquisition policies from major players in the global market.
The Electronic Development Fund Policy has been adopted in accordance with the Make in India drive, with the goal of rationalising a transposed duty system. To further offer a CAPEX subsidy of roughly 15-20%, the Modified Special Incentive Package Scheme (M-SIPS) has been introduced. In the upcoming years, consumer electronics manufacturers plan to increase their spending in R&D, production and distribution, which will propel the market's growth.
Presence of Counterfeit Products
Counterfeit products undermine consumer trust in legitimate brands. Consumers become sceptical of the legitimacy and quality of products with a brand name, causing a drop in confidence. Counterfeit products not only damage brand credibility, but also reduce revenue. Additionally, it will hamper user safety and security.
To preserve a competitive advantage and defend customer interests, businesses must prioritise innovation, quality control and anti-counterfeiting measures. Genuine producers face unfair competition from counterfeiters who provide similar-looking products at a lower cost. It has a negative influence on the market share and profitability of genuine enterprises.
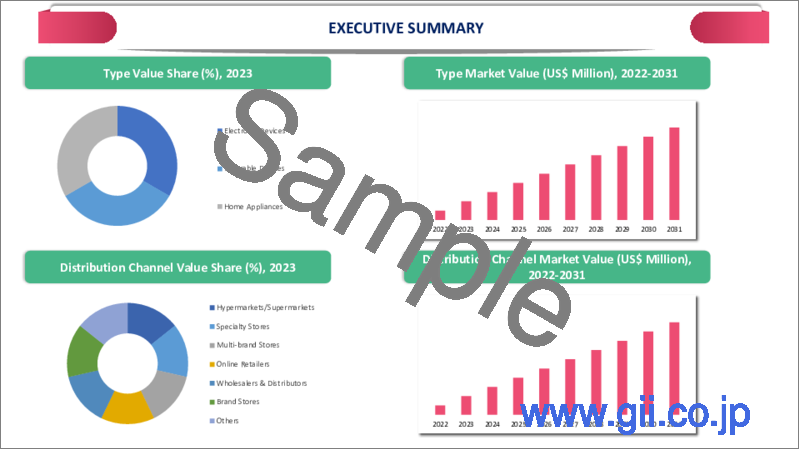
Segment Analysis
The global consumer electronics market is segmented based on type, distribution channel, end-user and region.
Rising Focus on Video and Music Streaming drives the Electronic Devices Growth
Electronic devices are expected to be the dominant segment with about 1/3rd of the market during the forecast period 2024-2031. The growing consumption of digital information, like video and music streaming, has driven up demand for large-screen televisions. Companies are launching their own operating systems for smart TVs to compete with mainstream operating systems. The product's increasing popularity has prompted market players to create new offerings employing QLED technology.
In October 2022, Samsung Electronics Co. Ltd announced new variants of The Frame TV in India. In Brazil, various firms, including TCL Electronics, sell televisions ranging in size from 32 to 85 inches. Over 20% of them are large-screen smart TVs using cutting-edge technologies like 4K and Quantum Dot. In 2021, smart TVs made up 86.6% of the company's globally sales volume, with an array of product options spanning from the X, C and P Series.
Geographical Penetration
Growing Spending on Residential Construction in Asia-Pacific
Asia-Pacific is the dominant region in the global consumer electronics market covering more than 30% of the market. Government initiatives and supporting regulations have helped to boost Asia-Pacific's consumer electronics industry. Governments in nations like China, India and South Korea have implemented initiatives to boost digital technology use, provide manufacturing subsidies and stimulate domestic production.
India's digital economy is predicted to reach US$ 1 trillion by 2026. Currently, the electronics market in India is about US$ 155 billion, with domestic manufacture accounting for 65%. Technology revolutions such as the introduction of 5G networks and IoT are hastening the uptake of electronics items. Initiatives like 'Digital India' and 'Smart City' projects have increased demand for IoT in the electronics device market and will bring in a new age for electronic items.
Competitive Landscape
The major global players in the market include Samsung Electronics Co. Ltd., LG Electronics Co. Ltd., Apple, Inc., Hitachi Ltd., Koninklijke Philips N.V., Sony Corporation, ThermaGreen Blocks, Hewlett Packard Inc., Toshiba Corporation and Panasonic Corporation.
COVID-19 Impact Analysis
Increased consumer demand for electronic devices led to the industry's expansion. According to 40% of globally electronics brands, COVID-19 was the most beneficial to the business. Computers and consumer electronics account for 22% of all e-commerce sales. American individuals spend 90 minutes per day online in 2018, 2.5 hours per day in 2019 and, due to COVID-19, 8 hours per day. The extraordinary increase also quickly raised the demand for technological equipment.
With consumers becoming accustomed to purchasing goods and services online, the electronics e-commerce industry has profited. As a result, the electronics e-commerce business is expected to generate over US$ 79 million in e-commerce sales in 2022, a 7% increase over 2021. Even though consumer trust in the electronics business has been fairly difficult, online stores that have won it have improved their revenues due to the huge demand for electronics.
AI Impact
AI in consumer electronics provides new opportunities for creativity and pleasure. AI-powered speakers may create music and podcasts based on the user's preferences and emotions. AI-enabled mobile devices can generate realistic and engaging virtual and augmented reality experiences. AI-powered generative computing will generate unique and diverse material, including art, tales and games.
The effect of AI in consumer electronics is reflected in societal and global AI trends and issues. One of the major trends is the growth of specialist AI applications in a variety of industries and areas, including insurance, media, education and healthcare. The applications use AI to deliver specialized and customized solutions for specific problems and demands, including fraud detection, content production, learning assessment and diagnostics.
Russia-Ukraine War Impact
Russia launched a massive invasion of Ukraine and the current conflict is affecting various technology areas. The electronics industry is one of them. The dispute is expected to have an influence on global semiconductor supply because raw materials shipped from both countries, such as neon gas, chemical C4F6 and palladium, are crucial for semiconductor manufacturing.
As Russian forces push further into neighboring Ukraine, prices of critical raw commodities such as copper, aluminum, steel and plastic, in addition to overall inflation, are threatening to drive up the cost of white goods. Companies including Godrej Appliances, Usha International and TV producer Superplastronics have urged consumers to plan their purchases ahead of time in order to save money.
By Type
- Electronic Devices
- Digital Camcorder/DVR and Camera
- Smart Phones/Feature Phones & Tablets
- Smart TV
- Printers/ Set Top Box
- Personal Computers & Gaming Consoles
- Wearable Devices
- Smart Watches
- Smart Accessories
- Others
- Home Appliances
- Refrigerators
- Air Conditioners
- Securities & HVAC Systems
- Smart Kitchen Appliances
- Others
- Others
By Distribution Channel
- Hypermarkets/Supermarkets
- Specialty Stores
- Multi-brand Stores
- Online Retailers
- Wholesalers & Distributors
- Others
By End-User
- Residential
- Commercial
By Region
- North America
- U.S.
- Canada
- Mexico
- Europe
- Germany
- UK
- France
- Italy
- Russia
- Rest of Europe
- South America
- Brazil
- Argentina
- Rest of South America
- Asia-Pacific
- China
- India
- Japan
- Australia
- Rest of Asia-Pacific
- Middle East and Africa
Key Developments
- In May 2023, Ekka Electronics has announced a huge investment of US$ 121.1 million to build a manufacturing facility in Noida, India. The company plans to manufacture a variety of consumer gadgets, such as washing machines, smartwatches, wearables and true wireless stereo devices.
- In April 2023, OnePlus unveiled their flagship tablet, the OnePlus Pad. The OnePlus Pad exemplifies the brand's trademark design aesthetics, which combine elegance and functionality.
- In March 2023, CUI Devices announced that it has struck a distribution deal with J.P. Electronic Devices Pvt. Ltd., a supplier of electronic components, services and solutions to a variety of industries.
Why Purchase the Report?
- To visualize the global consumer electronics market segmentation based on type, distribution channel, end-user and region, as well as understand key commercial assets and players.
- Identify commercial opportunities by analyzing trends and co-development.
- Excel data sheet with numerous data points of consumer electronics market-level with all segments.
- PDF report consists of a comprehensive analysis after exhaustive qualitative interviews and an in-depth study.
- Product mapping available as excel consisting of key products of all the major players.
The global consumer electronics market report would provide approximately 62 tables, 56 figures and 203 pages.
Target Audience 2024
- Manufacturers/ Buyers
- Industry Investors/Investment Bankers
- Research Professionals
- Emerging Companies
Table of Contents
1. Methodology and Scope
- 1.1. Research Methodology
- 1.2. Research Objective and Scope of the Report
2. Definition and Overview
3. Executive Summary
- 3.1. Snippet by Type
- 3.2. Snippet by Distribution Channel
- 3.3. Snippet by End-User
- 3.4. Snippet by Region
4. Dynamics
- 4.1. Impacting Factors
- 4.1.1. Drivers
- 4.1.1.1. Growing Technological Advancements
- 4.1.1.2. An Increase in Demand from Households and Changing Lifestyles
- 4.1.2. Restraints
- 4.1.2.1. Presence of Counterfeit Products
- 4.1.3. Opportunity
- 4.1.4. Impact Analysis
- 4.1.1. Drivers
5. Industry Analysis
- 5.1. Porter's Five Force Analysis
- 5.2. Supply Chain Analysis
- 5.3. Pricing Analysis
- 5.4. Regulatory Analysis
- 5.5. Russia-Ukraine War Impact Analysis
- 5.6. DMI Opinion
6. COVID-19 Analysis
- 6.1. Analysis of COVID-19
- 6.1.1. Scenario Before COVID
- 6.1.2. Scenario During COVID
- 6.1.3. Scenario Post COVID
- 6.2. Pricing Dynamics Amid COVID-19
- 6.3. Demand-Supply Spectrum
- 6.4. Consumer Electronics Initiatives Related to the Market During Pandemic
- 6.5. Manufacturers Strategic Initiatives
- 6.6. Conclusion
7. By Type
- 7.1. Introduction
- 7.1.1. Market Size Analysis and Y-o-Y Growth Analysis (%), By Type
- 7.1.2. Market Attractiveness Index, By Type
- 7.2. Electronic Devices*
- 7.2.1. Introduction
- 7.2.2. Market Size Analysis and Y-o-Y Growth Analysis (%)
- 7.2.3. Digital Camcorder/DVR and Camera
- 7.2.4. Smart Phones/Feature Phones & Tablets
- 7.2.5. Smart TV
- 7.2.6. Printers/ Set Top Box
- 7.2.7. Personal Computers & Gaming Consoles
- 7.3. Wearable Devices
- 7.3.1. Smart Watch
- 7.3.2. Smart Accessories
- 7.3.3. Others
- 7.4. Home Appliances
- 7.4.1. Refrigerators
- 7.4.2. Air Conditioners
- 7.4.3. Securities & HVAC Systems
- 7.4.4. Smart Kitchen Appliances
- 7.4.5. Others
- 7.5. Others
8. By Distribution Channel
- 8.1. Introduction
- 8.1.1. Market Size Analysis and Y-o-Y Growth Analysis (%), By Distribution Channel
- 8.1.2. Market Attractiveness Index, By Distribution Channel
- 8.2. Hypermarkets/Supermarkets*
- 8.2.1. Introduction
- 8.2.2. Market Size Analysis and Y-o-Y Growth Analysis (%)
- 8.3. Specialty Stores
- 8.4. Multi-brand Stores
- 8.5. Online Retailers
- 8.6. Wholesalers & Distributors
- 8.7. Others
9. By End-User
- 9.1. Introduction
- 9.1.1. Market Size Analysis and Y-o-Y Growth Analysis (%), By End-User
- 9.1.2. Market Attractiveness Index, By End-User
- 9.2. Residential*
- 9.2.1. Introduction
- 9.2.2. Market Size Analysis and Y-o-Y Growth Analysis (%)
- 9.3. Commercial
10. By Region
- 10.1. Introduction
- 10.1.1. Market Size Analysis and Y-o-Y Growth Analysis (%), By Region
- 10.1.2. Market Attractiveness Index, By Region
- 10.2. North America
- 10.2.1. Introduction
- 10.2.2. Key Region-Specific Dynamics
- 10.2.3. Market Size Analysis and Y-o-Y Growth Analysis (%), By Type
- 10.2.4. Market Size Analysis and Y-o-Y Growth Analysis (%), By Distribution Channel
- 10.2.5. Market Size Analysis and Y-o-Y Growth Analysis (%), By End-User
- 10.2.6. Market Size Analysis and Y-o-Y Growth Analysis (%), By Country
- 10.2.6.1. U.S.
- 10.2.6.2. Canada
- 10.2.6.3. Mexico
- 10.3. Europe
- 10.3.1. Introduction
- 10.3.2. Key Region-Specific Dynamics
- 10.3.3. Market Size Analysis and Y-o-Y Growth Analysis (%), By Type
- 10.3.4. Market Size Analysis and Y-o-Y Growth Analysis (%), By Distribution Channel
- 10.3.5. Market Size Analysis and Y-o-Y Growth Analysis (%), By End-User
- 10.3.6. Market Size Analysis and Y-o-Y Growth Analysis (%), By Country
- 10.3.6.1. Germany
- 10.3.6.2. UK
- 10.3.6.3. France
- 10.3.6.4. Italy
- 10.3.6.5. Russia
- 10.3.6.6. Rest of Europe
- 10.4. South America
- 10.4.1. Introduction
- 10.4.2. Key Region-Specific Dynamics
- 10.4.3. Market Size Analysis and Y-o-Y Growth Analysis (%), By Type
- 10.4.4. Market Size Analysis and Y-o-Y Growth Analysis (%), By Distribution Channel
- 10.4.5. Market Size Analysis and Y-o-Y Growth Analysis (%), By End-User
- 10.4.6. Market Size Analysis and Y-o-Y Growth Analysis (%), By Country
- 10.4.6.1. Brazil
- 10.4.6.2. Argentina
- 10.4.6.3. Rest of South America
- 10.5. Asia-Pacific
- 10.5.1. Introduction
- 10.5.2. Key Region-Specific Dynamics
- 10.5.3. Market Size Analysis and Y-o-Y Growth Analysis (%), By Type
- 10.5.4. Market Size Analysis and Y-o-Y Growth Analysis (%), By Distribution Channel
- 10.5.5. Market Size Analysis and Y-o-Y Growth Analysis (%), By End-User
- 10.5.6. Market Size Analysis and Y-o-Y Growth Analysis (%), By Country
- 10.5.6.1. China
- 10.5.6.2. India
- 10.5.6.3. Japan
- 10.5.6.4. Australia
- 10.5.6.5. Rest of Asia-Pacific
- 10.6. Middle East and Africa
- 10.6.1. Introduction
- 10.6.2. Key Region-Specific Dynamics
- 10.6.3. Market Size Analysis and Y-o-Y Growth Analysis (%), By Type
- 10.6.4. Market Size Analysis and Y-o-Y Growth Analysis (%), By Distribution Channel
- 10.6.5. Market Size Analysis and Y-o-Y Growth Analysis (%), By End-User
11. Competitive Landscape
- 11.1. Competitive Scenario
- 11.2. Market Positioning/Share Analysis
- 11.3. Mergers and Acquisitions Analysis
12. Company Profiles
- 12.1. Samsung Electronics Co. Ltd.*
- 12.1.1. Company Overview
- 12.1.2. Product Portfolio and Description
- 12.1.3. Financial Overview
- 12.1.4. Key Developments
- 12.2. LG Electronics Co. Ltd.
- 12.3. Apple, Inc.
- 12.4. Hitachi Ltd.
- 12.5. Koninklijke Philips N.V.
- 12.6. Sony Corporation
- 12.7. ThermaGreen Blocks
- 12.8. Hewlett Packard Inc.
- 12.9. Toshiba Corporation
- 12.10. Panasonic Corporation
LIST NOT EXHAUSTIVE
13. Appendix
- 13.1. About Us and Services
- 13.2. Contact Us
