|
|
市場調査レポート
商品コード
1373394
慢性腰痛治療薬の世界市場-2023年~2030年Global Chronic Lower Back Pain Drugs Market - 2023-2030 |
||||||
|
|
|||||||
カスタマイズ可能
適宜更新あり
|
|||||||


| 慢性腰痛治療薬の世界市場-2023年~2030年 |
|
出版日: 2023年10月18日
発行: DataM Intelligence
ページ情報: 英文 197 Pages
納期: 即日から翌営業日
|

- 全表示
- 概要
- 目次
概要
慢性腰痛治療薬は、持続的かつ長期的な腰痛を管理するために使用される薬剤です。このタイプの痛みは通常12週間以上続き、筋骨格系の問題、退行性疾患、怪我、脊椎の構造的異常など、様々な根本的原因から生じる可能性があります。慢性腰痛症治療薬は、痛みを和らげ、炎症を抑え、このような状態にある人の生活の質を改善することを目的としています。
慢性腰痛治療薬には、非ステロイド性抗炎症薬、鎮痛薬、抗うつ薬、オピオイドなど、さまざまな薬剤クラスが含まれます。さらに、慢性腰痛の有病率の増加、薬剤の臨床試験の増加は、予測期間中に市場を牽引すると予想される要因です。
市場力学
薬剤の臨床試験の増加が市場成長を促進する見込み
ClinicalTrials.Govによると、Vertanical GmbHが実施したVER-01の慢性非特異的腰痛患者を対象とした臨床試験は、2021年7月7日に開始され、2023年10月16日までに一次試験が終了し、試験全体の終了日は2024年5月27日と予測されています。
このタイムラインは、慢性非特異的腰痛症に対処するためにデザインされた潜在的な薬物であるVER-01の臨床試験の概要を示しています。VER-01が慢性腰痛の緩和に有効であり、安全性プロファイルも良好であることが確認されれば、この疾患に対する治療選択肢の幅が広がることになります。その結果、ヘルスケアプロバイダーや患者によるこの薬への需要が増加する可能性があります。
変形性関節症の有病率の増加が市場成長を牽引すると予想される
Arthritis &Rheumatology誌に掲載された研究によると、変形性関節症(OA)の有病率は世界的に公衆衛生上の大きな関心事となっています。この研究では、Global Burden of Disease Study 2019のデータによると、年齢標準化OA率が継続的に増加していることが明らかにされています。
約30年の間に、変形性関節症(OA)の症例数は2倍以上に増加しています。1990年の2億4,751万症例から2019年には5億2,781万症例となり、その動向は特に膝関節と股関節で顕著です。これはOAがもたらす大きな負担を浮き彫りにしており、特に大きな関節では重篤な障害をもたらし、人工関節置換術が必要になることさえあります。
その結果、ヘルスケアプロバイダーは、OA有病率の増加に対処するため、より包括的な疼痛管理戦略の実施を優先する可能性があります。また、OAだけでなく、慢性腰痛のような筋骨格系の問題を伴う疾患に対しても、効果的な鎮痛オプションに対する需要が高まるため、慢性腰痛治療薬市場にも利益をもたらす可能性があります。
薬剤の安全性への懸念が市場成長の妨げになる見込み
慢性腰痛治療薬の市場は、オピオイド危機の影響を大きく受けています。オキシコドンやヒドロコドンなどのオピオイドは、痛みを和らげるのに効果的であったため、以前は処方されていました。しかし、中毒や過剰摂取、その他の副作用のリスクがあるため、現在ではこれらの医薬品はより厳しい規制の対象となり、監視の目が厳しくなっています。
目次
第1章 調査手法と調査範囲
第2章 定義と概要
第3章 エグゼクティブサマリー
第4章 市場力学
- 影響要因
- 促進要因
- 医薬品の臨床試験の増加
- 変形性関節症の有病率の増加
- 抑制要因
- 薬剤の安全性への懸念
- 機会
- 影響分析
- 促進要因
第5章 産業分析
- ポーターのファイブフォース分析
- サプライチェーン分析
- 価格分析
- 規制分析
- パイプライン分析
- 特許分析
- ロシア・ウクライナ紛争分析
- DMI見解
第6章 COVID-19分析
第7章 薬剤クラス別
- 非ステロイド性抗炎症薬(NSAIDs)
- イブプロフェン(アドビル、モトリン)
- ナプロキセン(アリーブ)
- セレコキシブ(セレブレックス)
- その他
- 鎮痛薬
- アセトアミノフェン(タイレノール)
- トラマドール(ウルトラム)
- その他
- 抗うつ薬
- アミトリプチリン(エラビル)
- デュロキセチン(サインバルタ)
- ベンラファキシン(エフェクサー)
- その他
- オピオイド
- オキシコドン
- ヒドロコドン
- その他
- その他
第8章 投与経路別
- 経口
- 局所
- 筋肉内(IM)
- その他
第9章 流通チャネル別
- 病院薬局
- 小売薬局
- オンライン薬局
第10章 地域別
- 北米
- 米国
- カナダ
- メキシコ
- 欧州
- ドイツ
- 英国
- フランス
- イタリア
- スペイン
- その他欧州
- 南米
- ブラジル
- アルゼンチン
- その他南米
- アジア太平洋
- 中国
- インド
- 日本
- オーストラリア
- その他アジア太平洋地域
- 中東・アフリカ
第11章 競合情勢
- 競合シナリオ
- 市場ポジショニング/シェア分析
- M&A分析
第12章 企業プロファイル
- Johnson & Johnson Consumer Inc.
- 会社概要
- 製品ポートフォリオと説明
- 財務概要
- 主な発展
- GSK plc
- Bayer
- Pfizer Inc.
- Viatris Inc.
- Eli Lilly and Company
- Sanofi
- Novartis AG
- Dr. Reddy's Laboratories Ltd.
- Sun Pharmaceutical Industries Ltd.
第13章 付録
Overview
Chronic lower back pain drugs are medications used to manage persistent and long-term lower back pain. This type of pain typically lasts for more than 12 weeks and can result from various underlying causes, including musculoskeletal issues, degenerative conditions, injuries, or structural abnormalities in the spine. The drugs aim to alleviate pain, reduce inflammation, and improve the quality of life for individuals living with this condition.
Chronic lower back pain drugs encompass a range of medication classes, including nonsteroidal anti-inflammatory drugs, analgesics, antidepressants, opioids, among others. Furthermore, the increasing prevalence of chronic lower back pain, and increasing clinical trials of drugs are the factors expected to drive the market over the forecast period.
Market Dynamics
Increasing Clinical Trials of Drugs is Expected to Drive Market Growth
According to ClinicalTrials.Gov, the trial conducted by Vertanical GmbH, of VER-01 in the treatment of patients with chronic non-specific low back pain, commenced on July 7, 2021, and is estimated to reach primary completion by October 16, 2023, with an overall study completion date projected for May 27, 2024.
This timeline outlines a clinical trial for VER-01, a potential medication designed to address chronic non-specific low back pain. If VER-01 is found to be effective in relieving chronic low back pain and also has a favorable safety profile, it could become a valuable addition to the range of treatment options available for this condition. This could lead to an increase in demand for this medication by healthcare providers and patients.
Increasing Prevalence of Osteoarthritis is Expected to Drive the Market Growth
According to a study published in the journal Arthritis & Rheumatology, the prevalence of Osteoarthritis (OA) is a major public health concern worldwide. The study reveals that age-standardized OA rates are continuously increasing, as per the Global Burden of Disease Study 2019 data.
Over nearly three decades, the number of cases of osteoarthritis (OA) has increased by more than double. From 247.51 million cases in 1990 to 527.81 million cases in 2019, the trend is particularly noticeable in the knee and hip joints. This highlights the significant burden that OA poses, especially in larger joints where it can result in severe disability and even require joint replacements.
As a result, healthcare providers may prioritize implementing more comprehensive pain management strategies to address the increasing prevalence of OA. This could also potentially benefit the chronic lower back pain drugs market as the demand for effective pain relief options rises not only for OA but also for conditions such as chronic lower back pain that are associated with musculoskeletal issues.
Safety Concerns of Drugs are Expected to Hamper the Market Growth
The market for drugs that treat chronic lower back pain has been greatly impacted by the opioid crisis. Opioids like oxycodone and hydrocodone were previously prescribed as they were effective in relieving pain. However, due to the risks of addiction, overdose, and other side effects, these drugs are now subject to stricter regulations and increased scrutiny.
Segment Analysis
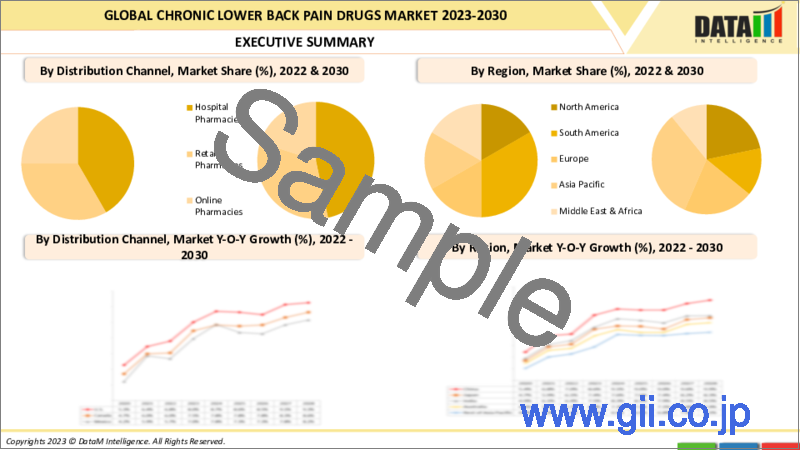
The global chronic lower back pain drugs market is segmented based on drug class, route of administration, distribution channel and region.
The Nonsteroidal Anti-Inflammatory Drugs (NSAIDs) from the Drug Class Segment Accounted for Approximately 37.6% of the Chronic Lower Back Pain Drugs Market Share
Nonsteroidal Anti-Inflammatory Drugs (NSAIDs) are a type of medication that is commonly used to manage pain and inflammation. They are often the first choice for treating chronic lower back pain.
NSAIDs are effective in reducing pain by targeting the body's inflammatory response. Inflammation frequently accompanies chronic lower back pain, and it can contribute to the discomfort and severity of the pain. NSAIDs work by inhibiting enzymes called cyclooxygenases (COX), specifically COX-1 and COX-2. These enzymes play a crucial role in the production of prostaglandins, which are chemical messengers that promote pain, fever, and inflammation. By blocking COX enzymes, NSAIDs reduce the production of prostaglandins, leading to pain relief.
NSAIDs are not only helpful in relieving pain but can also decrease inflammation in the affected area. Chronic lower back pain can be caused by a variety of factors such as muscle strain, injury, or degenerative conditions like osteoarthritis, all of which can lead to inflammation. NSAIDs can help to alleviate the inflammatory response, thereby reducing pain and improving mobility.
For instance, Ibuprofen (Advil, Motrin), Naproxen (Aleve), and Celecoxib (Celebrex) among others are the OTC drugs used for chronic lower back pain. Furthermore, owing to the proven effectiveness in managing pain and inflammation, easy accessibility, affordability, patient preference, and its role as a standard treatment option in addressing the chronic nature of the condition are the factors expected to drive the market over the forecast period.
Geographical Penetration
North America Accounted for Approximately 40.3% of the Market Share in 2022, Owing to the Increasing Prevalence of Chronic Lower Back Pain, and Increasing Clinical Trials
North America region is expected to hold the largest market share over the forecast period owing to the increasing prevalence of chronic lower back pain and increasing clinical trials. For instance, according to the Cleveland Clinic, low back pain is a common problem that affects 4 out of 5 individuals at some point in their lives. This susceptibility is mainly due to the continuous degeneration of the cushion-like discs between the vertebrae in the spine, which becomes more prevalent after the age of 30.
In addition to this, some factors can increase the risk of developing low back pain, such as being overweight. Excess weight puts added pressure on the joints and spinal discs, which can lead to pain. Furthermore, due to medical conditions such as herniated discs and spinal stenosis, lifestyle factors like smoking, excessive drinking, and a sedentary lifestyle can also increase the risk of low back pain.
Also, people who suffer from depression and anxiety are more likely to develop this condition. Further, the North American Spine Society states that individuals who have experienced acute low back pain in the past are at a higher risk of developing chronic symptoms. Therefore, there is an increase in the demand and adoption of chronic lower back pain drugs.
Competitive Landscape
The major global players in the chronic lower back pain drugs market include: Johnson & Johnson Consumer Inc., GSK plc, Bayer, Pfizer Inc., Viatris Inc., Eli Lilly and Company, Sanofi, Novartis AG, Dr. Reddy's Laboratories Ltd., and Sun Pharmaceutical Industries Ltd among others.
COVID-19 Impact Analysis:
The COVID-19 pandemic has brought about significant changes in people's daily routines due to lockdowns and social distancing measures. As a result, some individuals may have become more sedentary, worsening their chronic lower back pain.
With healthcare systems being overwhelmed by the demands of treating COVID-19 patients, non-urgent medical procedures and appointments, including those related to chronic pain management, were postponed or canceled. This delay in care has affected some patients' access to prescribed medications.
The pandemic has caused an acceleration in the adoption of telehealth and remote medical consultations. Although this has provided continuity of care for some chronic pain patients, it may not have been as effective as in-person visits in managing medications, dose adjustments, and monitoring potential side effects.
Furthermore, the psychological impact of the pandemic, such as anxiety, depression, and stress, can worsen chronic pain conditions. This may have prompted some patients to seek additional or alternative treatments for their chronic lower back pain. Despite the challenges that arise from the pandemic, there may also be opportunities for innovation and improved pain management strategies in the future.
Why Purchase the Report?
- To visualize the global chronic lower back pain drugs market segmentation based on drug class, route of administration, distribution channel and region as well as understand key commercial assets and players.
- Identify commercial opportunities by analyzing trends and co-development.
- Excel data sheet with numerous data points of chronic lower back pain drugs market-level with all segments.
- PDF report consists of a comprehensive analysis after exhaustive qualitative interviews and an in-depth study.
- Product mapping available as excel consisting of key products of all the major players.
The global chronic lower back pain drugs market report would provide approximately 61 tables, 60 figures, and 186 Pages.
Target Audience 2023
- Manufacturers/ Buyers
- Industry Investors/Investment Bankers
- Research Professionals
- Emerging Companies
Table of Contents
1. Methodology and Scope
- 1.1. Research Methodology
- 1.2. Research Objective and Scope of the Report
2. Definition and Overview
3. Executive Summary
- 3.1. Snippet by Drug Class
- 3.2. Snippet by Route of Administration
- 3.3. Snippet by Distribution Channel
- 3.4. Snippet by Region
4. Dynamics
- 4.1. Impacting Factors
- 4.1.1. Drivers
- 4.1.1.1. Increasing Clinical Trials of Drugs
- 4.1.1.2. Increasing Prevalence of Osteoarthritis
- 4.1.2. Restraints
- 4.1.2.1. Safety Concerns of Drugs
- 4.1.3. Opportunity
- 4.1.4. Impact Analysis
- 4.1.1. Drivers
5. Industry Analysis
- 5.1. Porter's Five Force Analysis
- 5.2. Supply Chain Analysis
- 5.3. Pricing Analysis
- 5.4. Regulatory Analysis
- 5.5. Pipeline Analysis
- 5.6. Patent Analysis
- 5.7. Russian-Ukraine Conflict Analysis
- 5.8. DMI Opinion
6. COVID-19 Analysis
- 6.1. Analysis of COVID-19
- 6.1.1. Scenario Before COVID
- 6.1.2. Scenario During COVID
- 6.1.3. Scenario Post COVID
- 6.2. Pricing Dynamics Amid COVID-19
- 6.3. Demand-Supply Spectrum
- 6.4. Government Initiatives Related to the Market During the Pandemic
- 6.5. Manufacturers Strategic Initiatives
- 6.6. Conclusion
7. By Drug Class
- 7.1. Introduction
- 7.1.1. Market Size Analysis and Y-o-Y Growth Analysis (%), By Drug Class
- 7.1.2. Market Attractiveness Index, By Drug Class
- 7.2. Nonsteroidal Anti-Inflammatory Drugs (NSAIDs)*
- 7.2.1. Introduction
- 7.2.2. Market Size Analysis and Y-o-Y Growth Analysis (%)
- 7.2.3. Ibuprofen (Advil, Motrin)
- 7.2.4. Naproxen (Aleve)
- 7.2.5. Celecoxib (Celebrex)
- 7.2.6. Others
- 7.3. Analgesics
- 7.3.1. Acetaminophen (Tylenol)
- 7.3.2. Tramadol (Ultram)
- 7.3.3. Others
- 7.4. Antidepressants
- 7.4.1. Amitriptyline (Elavil)
- 7.4.2. Duloxetine (Cymbalta)
- 7.4.3. Venlafaxine (Effexor)
- 7.4.4. Others
- 7.5. Opioids
- 7.5.1. Oxycodone
- 7.5.2. Hydrocodone
- 7.5.3. Others
- 7.6. Others
8. By Route of Administration
- 8.1. Introduction
- 8.1.1. Market Size Analysis and Y-o-Y Growth Analysis (%), By Route of Administration
- 8.1.2. Market Attractiveness Index, By Route of Administration
- 8.2. Oral*
- 8.2.1. Introduction
- 8.2.2. Market Size Analysis and Y-o-Y Growth Analysis (%)
- 8.3. Topical
- 8.4. Intramuscular (IM)
- 8.5. Others
9. By Distribution Channel
- 9.1. Introduction
- 9.1.1. Market Size Analysis and Y-o-Y Growth Analysis (%), By Distribution Channel
- 9.1.2. Market Attractiveness Index, By Distribution Channel
- 9.2. Hospital Pharmacies*
- 9.2.1. Introduction
- 9.2.2. Market Size Analysis and Y-o-Y Growth Analysis (%)
- 9.3. Retail Pharmacies
- 9.4. Online Pharmacies
10. By Region
- 10.1. Introduction
- 10.1.1. Market Size Analysis and Y-o-Y Growth Analysis (%), By Region
- 10.1.2. Market Attractiveness Index, By Region
- 10.2. North America
- 10.2.1. Introduction
- 10.2.2. Key Region-Specific Dynamics
- 10.2.3. Market Size Analysis and Y-o-Y Growth Analysis (%), By Drug Class
- 10.2.4. Market Size Analysis and Y-o-Y Growth Analysis (%), By Route of Administration
- 10.2.5. Market Size Analysis and Y-o-Y Growth Analysis (%), By Distribution Channel
- 10.2.6. Market Size Analysis and Y-o-Y Growth Analysis (%), By Country
- 10.2.6.1. U.S.
- 10.2.6.2. Canada
- 10.2.6.3. Mexico
- 10.3. Europe
- 10.3.1. Introduction
- 10.3.2. Key Region-Specific Dynamics
- 10.3.3. Market Size Analysis and Y-o-Y Growth Analysis (%), By Drug Class
- 10.3.4. Market Size Analysis and Y-o-Y Growth Analysis (%), By Route of Administration
- 10.3.5. Market Size Analysis and Y-o-Y Growth Analysis (%), By Distribution Channel
- 10.3.6. Market Size Analysis and Y-o-Y Growth Analysis (%), By Country
- 10.3.6.1. Germany
- 10.3.6.2. UK
- 10.3.6.3. France
- 10.3.6.4. Italy
- 10.3.6.5. Spain
- 10.3.6.6. Rest of Europe
- 10.4. South America
- 10.4.1. Introduction
- 10.4.2. Key Region-Specific Dynamics
- 10.4.3. Market Size Analysis and Y-o-Y Growth Analysis (%), By Drug Class
- 10.4.4. Market Size Analysis and Y-o-Y Growth Analysis (%), By Route of Administration
- 10.4.5. Market Size Analysis and Y-o-Y Growth Analysis (%), By Distribution Channel
- 10.4.6. Market Size Analysis and Y-o-Y Growth Analysis (%), By Country
- 10.4.6.1. Brazil
- 10.4.6.2. Argentina
- 10.4.6.3. Rest of South America
- 10.5. Asia-Pacific
- 10.5.1. Introduction
- 10.5.2. Key Region-Specific Dynamics
- 10.5.3. Market Size Analysis and Y-o-Y Growth Analysis (%), By Drug Class
- 10.5.4. Market Size Analysis and Y-o-Y Growth Analysis (%), By Route of Administration
- 10.5.5. Market Size Analysis and Y-o-Y Growth Analysis (%), By Distribution Channel
- 10.5.6. Market Size Analysis and Y-o-Y Growth Analysis (%), By Country
- 10.5.6.1. China
- 10.5.6.2. India
- 10.5.6.3. Japan
- 10.5.6.4. Australia
- 10.5.6.5. Rest of Asia-Pacific
- 10.6. Middle East and Africa
- 10.6.1. Introduction
- 10.6.2. Key Region-Specific Dynamics
- 10.6.3. Market Size Analysis and Y-o-Y Growth Analysis (%), By Drug Class
- 10.6.4. Market Size Analysis and Y-o-Y Growth Analysis (%), By Route of Administration
- 10.6.5. Market Size Analysis and Y-o-Y Growth Analysis (%), By Distribution Channel
11. Competitive Landscape
- 11.1. Competitive Scenario
- 11.2. Market Positioning/Share Analysis
- 11.3. Mergers and Acquisitions Analysis
12. Company Profiles
- 12.1. Johnson & Johnson Consumer Inc.*
- 12.1.1. Company Overview
- 12.1.2. Product Portfolio and Description
- 12.1.3. Financial Overview
- 12.1.4. Key Developments
- 12.2. GSK plc
- 12.3. Bayer
- 12.4. Pfizer Inc.
- 12.5. Viatris Inc.
- 12.6. Eli Lilly and Company
- 12.7. Sanofi
- 12.8. Novartis AG
- 12.9. Dr. Reddy's Laboratories Ltd.
- 12.10. Sun Pharmaceutical Industries Ltd.
LIST NOT EXHAUSTIVE
13. Appendix
- 13.1. About Us and Services
- 13.2. Contact Us
