|
|
市場調査レポート
商品コード
1325353
EVワイヤレス給電の世界市場-2023年~2030年Global EV Wireless Power Transfer Market - 2023-2030 |
||||||
|
|
|||||||
カスタマイズ可能
適宜更新あり
|
|||||||


| EVワイヤレス給電の世界市場-2023年~2030年 |
|
出版日: 2023年08月04日
発行: DataM Intelligence
ページ情報: 英文 181 Pages
納期: 即日から翌営業日
|

- 全表示
- 概要
- 目次
市場概要
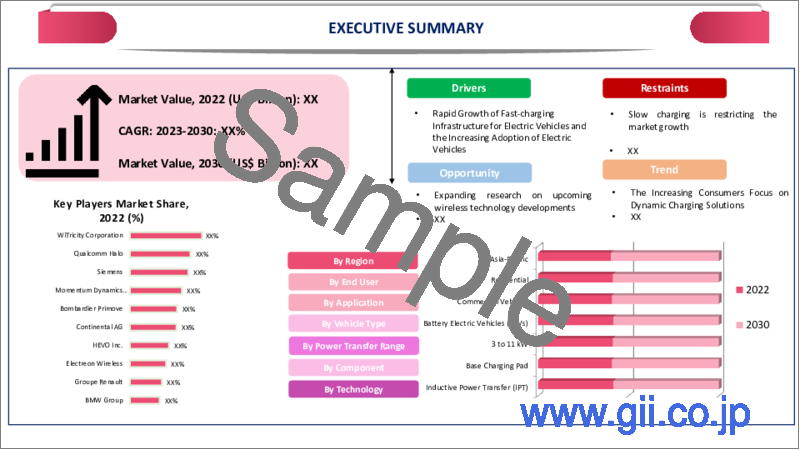
EVワイヤレス給電の世界市場は、2022年に1,630万米ドルに達し、2023-2030年の予測期間中に97.1%のCAGRで成長し、2030年には37億1,870万米ドルに達すると予測されています。
スマートグリッドシステムは、グリッドとEVの間で双方向のエネルギーフローを可能にするために、ワイヤレス給電技術を利用する可能性があります。この統合により、EVはワイヤレスで充電できるだけでなく、需要が最も高いときに余分なエネルギーをグリッドに放電することもできます。ワイヤレス充電は、双方向のエネルギーフローを促進し、エネルギー効率とシステムの安定性を高めるため、電力会社や系統運用者にとって望ましい選択肢です。
商用分野は市場の2/3以上のシェアを占めており、車両を管理したり物流を行う商用エンドユーザーは、業務効率の改善に頻繁に関心を寄せています。充電コードを手動で抜き差しする代わりにワイヤレス充電を使えば、時間と労力を節約できます。商業エンドユーザーは、この簡素化された充電手順の支援により、生産性を向上させ、ダウンタイムを減らすことができるかもしれないです。
市場力学
エネルギーを効率的に使用する代替燃料へのニーズの高まり
ディーゼルやガソリンを製造するための重油の採掘と加工は、自動車の主な点火源となっています。過去30年間にわたる原油価格の高騰の結果、中低所得者層にとっては、旅行費用が法外に高くなっています。原油価格の上昇に伴い、個人がエネルギー効率の良い代替手段を選択した結果、1マイルあたりの全体的なコストは低下しました。燃料自動車とは対照的に、これは電気自動車の需要を刺激し、電気自動車充電システムの市場成長を増加させると予想されます。
フランス外務・国際開拓省によると、米国、欧州、日本は電気自動車のトップ3市場です。欧州では2012年同期に15,503台の電気自動車が販売されたのに比べ、2013年上半期には18,939台の電気自動車が販売されました。同年、米国では30,000台の電気自動車が販売されたのに対し、日本ではわずか6,000台となっています。オランダ政府は、2015年までに2万基の普通充電器と100基の急速充電器を設置し、需要充電や大型バッテリーの必要性など、充電に関する課題を解決する方針です。その結果、これらの地域で電気自動車の需要が増加するにつれて、電気自動車充電システム市場は成長すると予測されます。
最新技術の開発促進と急速な普及
商用用途におけるEVワイヤレス充電の成長は、効率の向上、電力転送速度の改善、安全機能の改善など、ワイヤレス給電技術の継続的な開発によって後押しされています。効率的で効果的な充電ソリューションを求めている業務用エンドユーザーは、充電時間の短縮、航続距離の拡大、信頼性の向上など、より新しい技術に興味を持つでしょう。
EVワイヤレス給電が迅速に採用されるためには、効果的な充電インフラが構築されなければなりません。企業やインフラ事業者は、駐車場、バス停、配送拠点などの公共スペースにワイヤレス充電プレートやパッドを設置することに投資しています。商用エンドユーザーは、強力で信頼できる充電インフラがあることで、この技術の利用を促されます。発展と最新技術の急速な採用が、EVワイヤレス給電市場の機会を押し上げます。
市場拡大を阻むインフラの不足
インフラの不足は、ワイヤレス給電対応の充電ステーションの不足につながります。その結果、電気自動車は充電の選択肢が限られ、ワイヤレス充電が実用的でなく、利用しにくくなります。充電インフラの制約により、購入希望者がワイヤレス充電対応電気自動車の購入を躊躇し、市場の成長が制限される可能性があります。
標準化されたインフラがないため、市場の分裂や互換性の問題が生じる可能性があります。異なるメーカーが独自の技術を使用したり、互換性のない充電方式を採用したりすることで、混乱や相互運用性が妨げられます。標準化が進んでいないため、顧客は最適なワイヤレス充電オプションを選択することが難しく、充電インフラ・プロバイダーの投資意欲をそぎ、市場開拓を阻害する可能性もあります。
COVID-19影響分析
EV用ワイヤレス給電装置とコンポーネントの製造と入手可能性は、COVID-19が世界のサプライチェーンに与えた影響によって影響を受けました。製造施設の閉鎖や操業縮小の結果、ワイヤレス充電システムの生産と納入が遅れました。そのため、ワイヤレス充電インフラの開拓が遅れ、市場拡大に悪影響を及ぼしました。
パンデミックは、電気自動車販売を含む自動車産業にも影響を与えました。旅行制限、ロックダウン、景気後退の結果、電気自動車の需要が減少しました。EVの走行が減少したため、EVワイヤレス給電を含むワイヤレス充電インフラのニーズが減少しました。
目次
第1章 調査手法と調査範囲
第2章 定義と概要
第3章 エグゼクティブサマリー
第4章 市場力学
- 影響要因
- 促進要因
- 電気自動車の需要拡大
- 抑制要因
- 低速充電が市場の成長を制限している
- 機会
- 今後の無線技術開発に関する研究の拡大
- 影響分析
- 促進要因
第5章 産業分析
- ポーターのファイブフォース分析
- サプライチェーン分析
- 価格分析
- 規制分析
第6章 COVID-19分析
第7章 技術別
- 誘導給電(IPT)
- 共振誘導給電(RIPT)
- 容量性給電(CPT)
第8章 送電範囲別
- 3~11 kW
- 11~50 kW
- 50kW以上
第9章 エンドユーザー別
- 住宅用
- 商業用
第10章 用途別
- 商用車
- 乗用車
第11章 地域別
- 北米
- 米国
- カナダ
- メキシコ
- 欧州
- ドイツ
- 英国
- フランス
- イタリア
- ロシア
- その他欧州
- 南米
- ブラジル
- アルゼンチン
- その他南米
- アジア太平洋
- 中国
- インド
- 日本
- オーストラリア
- その他アジア太平洋
- 中東・アフリカ
第12章 競合情勢
- 競合シナリオ
- 市況/シェア分析
- M&A分析
第13章 企業プロファイル
- WiTricity Corporation
- 会社概要
- 技術ポートフォリオと説明
- 財務概要
- 最近の動向
- Qualcomm Halo
- Plugless(Evatran Group)
- Momentum Dynamics Corporation
- Bombardier Primove
- Hella Aglaia Mobile Vision GmbH
- HEVO Inc.
- Electreon Wireless
- Groupe Renault
- BMW Group
第14章 付録
Market Overview
Global EV Wireless Power Transfer Market reached US$ 16.3 million in 2022 and is expected to reach US$ 3,718.7 million by 2030, growing with a CAGR of 97.1% during the forecast period 2023-2030.
Smart grid systems may utilize wireless power transfer technologies to enable two-way energy flow between the grid and EVs. Because of this integration, EVs could not only charge wirelessly but can also discharge extra energy back into the grid when demand is at its highest. Wireless charging is a desirable alternative for utilities and grid operators because of the bidirectional energy flow that it facilitates, which increases energy efficiency and system stability.
The commercial segment holds more than 2/3rd share in the market and commercial End-User who manage vehicles or operate in logistics are frequently concerned with improving operational effectiveness. It saves time and effort to use wireless charging instead of manually plugging and unplugging charging cords. Commercial End-Users may be able to increase productivity and decrease downtime with the aid of this simplified charging procedure.
Market Dynamics
An Increase In The Need For Fuel Alternatives That Use Energy Efficiently
The mining and processing of fuel oil to create diesel and petrol serve as the main ignition source for vehicles. Travel has become prohibitively expensive for low- and middle-class customers as a result of the worrisome rise in oil prices over the past three decades. The overall cost per mile has decreased as a result of individuals choosing energy-efficient alternatives as a result of rising oil prices. In contrast to fuel-powered cars, this is expected to stimulate demand for electric vehicles, increasing the market growth for electric vehicle charging systems.
U.S., Europe, and Japan are the top three markets for electric vehicles, according to the French Ministry of Foreign Affairs and International Development. In comparison to the same period in 2012, when 15,503 electric vehicles were sold in Europe, 18,939 electric vehicles were sold in the first half of 2013. In the same year, 30,000 electric vehicles were sold in the U.S. as opposed to only 6,000 in Japan. By 2015, the Dutch government intends to create 20,000 regular chargers and 100 rapid chargers to solve charging-related challenges such as demand charging and the need for bigger batteries. As a consequence, as the demand for electric vehicles increases in these regions, the market for electric vehicle charging systems is predicted to grow.
Increased Development And Rapid Adoption Of The Most Recent Technology
The growth of EV wireless charging in commercial applications is being fueled by ongoing developments in wireless power transfer technology, such as increased efficiency, better power transfer rates, and improved safety features. Commercial end customers looking for efficient and effective charging solutions will find newer technologies interesting since they provide faster charge times, greater range possibilities, and increased dependability.
For EV wireless power transfer to be quickly adopted, an effective charging infrastructure must be created. Businesses and infrastructure providers are investing in the installation of wireless charging plates and pads in public spaces including parking lots, bus stops, and delivery hubs. Commercial end customers are encouraged to use the technology by the presence of a strong and dependable charging infrastructure. The Increased development and rapid adoption of the most recent technology boost the opportunities for the EV wireless power transfer market.
Insufficient Infrastructure To Impede Market Expansion
Lack of infrastructure contributes to a shortage of wireless power transfer-enabled charging stations. As a result of this, electric vehicles have limited options for charging, which makes wireless charging less practical and less accessible. The constrained charging infrastructure may deter prospective buyers from purchasing wireless charging-capable electric vehicles, restricting the market growth.
The absence of standardized infrastructure may lead to market division and compatibility problems. Confusion and interoperability are hampered by different manufacturers' use of proprietary technology or incompatible charging schemes. Customers find it difficult to select the best wireless charging option owing to the lack of standardization, which may also discourage investment from charging infrastructure providers and impede market development.
COVID-19 Impact Analysis
The manufacture and accessibility of EV wireless power transfer equipment and components were impacted by the COVID-19 effects on the world's supply chains. Wireless charging system production and delivery were delayed as a result of the closure or curtailed operations of manufacturing facilities. The development of wireless charging infrastructure was thus delayed, which had an adverse effect on market expansion.
The pandemic had an impact on the automotive industry, which included the sales of electric vehicles. The demand for electric vehicles decreased as a result of travel restrictions, lockdowns, and economic downturns. With fewer EVs on the road, there was a reduction in the need for wireless charging infrastructure, including EV wireless power transfer.
Segment Analysis
The global EV wireless power transfer market is segmented based on technology, power transfer range, end-user, application and region.
Rising Demand For Inductive Power Transfer (IPT) Option For Both Commercial and Residential
The Inductive Power Transfer (IPT) segment holds more than 49.9% share of the global EV wireless power transfer market. For charging electric vehicles, inductive power transfer (IPT) offers a high level of ease. Physical connections and manual plugging are no longer required, making charging simple and convenient. Users of IPT may simply position their vehicles on a charging plate or pad to start charging immediately. This element of ease improves the entire user experience and promotes the usage of wireless charging technologies.
Furthermore, IPT systems were developed with safety in consideration. To ensure secure and dependable charging, they have features like foreign object identification, temperature monitoring, and fault prevention systems. By doing away with physical connectors and wires, inductive power transfer increases the charging system's reliability and lowers the chance of damage. Both industrial and residential end-users are drawn to these safety and durability qualities.
Geographical Analysis
Europe's Growing Developing Technologies In The Automotive Industry
Europe is primarily driven by the technology advancements in the automotive and, particularly, the EV industries, that are being seen in Germany, the UK, Italy, and France. Growing investment rates in the construction of new research facilities and businesses that use finished goods may contribute to regional market expansion. The areas are also seeing strong demand for fuel-efficient vehicles, both for personal use and in the business sector. This might help to enhance demand for EVs and spur additional research into wireless technology.
Furthermore, the extensive adoption of wireless EV charging systems in Europe is primarily owing to the rising popularity of electric vehicles in the continent, the implementation of numerous wireless EV charging technology pilot projects across the continent, and government initiatives to evaluate the viability of wireless EV charging technology. In an effort to lessen range anxiety related to electric vehicles, electric mobility players in Europe are starting new projects to develop a sustainable road transport infrastructure that can charge electric vehicles while they are in motion.
Additionally, The European Alternative Fuels Observatory (EAFO) is excited to announce an important step in the European Union's journey towards a more sustainable future, according to the organization. Across all 27 member states, the EU nowadays proudly has more than 500,000 free electric vehicle charging stations. The Alternative Fuel Infrastructure Regulation (AFIR), which serves as a guide, helps the European Union fulfill its ongoing commitment to comply with government and business demands. It encourages the widespread use of battery electric vehicles (BEVs) and other alternative propulsion technologies.
Competitive Landscape
The major global players include WiTricity Corporation, Qualcomm Halo, Plugless (Evatran Group), Momentum Dynamics Corporation, Bombardier Primove, Hella Aglaia Mobile Vision GmbH, HEVO Inc., Electreon Wireless, Groupe Renault and BMW GROUP.
Why Purchase the Report?
- To visualize the global EV wireless power transfer market segmentation based on technology, power transfer range, end-user, application and region, as well as understand key commercial assets and players.
- Identify commercial opportunities by analyzing trends and co-development.
- Excel data sheet with numerous data points of EV wireless power transfer market-level with all segments.
- PDF report consists of a comprehensive analysis after exhaustive qualitative interviews and an in-depth study.
- Technology mapping available as excel consisting of key technologies of all the major players.
The global EV wireless power transfer market report would provide approximately 69 tables, 65 figures and 181 Pages.
Target Audience 2023
- Manufacturers/ Buyers
- Industry Investors/Investment Bankers
- Research Professionals
- Emerging Companies
Table of Contents
1. Methodology and Scope
- 1.1. Research Methodology
- 1.2. Research Objective and Scope of the Report
2. Definition and Overview
3. Executive Summary
- 3.1. Snippet by Technology
- 3.2. Snippet by Power Transfer Range
- 3.3. Snippet by End-User
- 3.4. Snippet by Application
- 3.5. Snippet by Region
4. Dynamics
- 4.1. Impacting Factors
- 4.1.1. Drivers
- 4.1.1.1. Growing Demand for Electric Vehicles
- 4.1.2. Restraints
- 4.1.2.1. Slow charging is restricting the market growth
- 4.1.3. Opportunity
- 4.1.3.1. Expanding research on upcoming wireless technology developments
- 4.1.4. Impact Analysis
- 4.1.1. Drivers
5. Industry Analysis
- 5.1. Porter's Five Force Analysis
- 5.2. Supply Chain Analysis
- 5.3. Pricing Analysis
- 5.4. Regulatory Analysis
6. COVID-19 Analysis
- 6.1. Analysis of COVID-19
- 6.1.1. Scenario Before COVID
- 6.1.2. Scenario During COVID
- 6.1.3. Scenario Post COVID
- 6.2. Pricing Dynamics Amid COVID-19
- 6.3. Demand-Supply Spectrum
- 6.4. Government Initiatives Related to the Market During Pandemic
- 6.5. Manufacturers Strategic Initiatives
- 6.6. Conclusion
7. By Technology
- 7.1. Introduction
- 7.1.1. Market Size Analysis and Y-o-Y Growth Analysis (%), By Technology
- 7.1.2. Market Attractiveness Index, By Technology
- 7.2. Inductive Power Transfer (IPT)*
- 7.2.1. Introduction
- 7.2.2. Market Size Analysis and Y-o-Y Growth Analysis (%)
- 7.3. Resonant Inductive Power Transfer (RIPT)
- 7.4. Capacitive Power Transfer (CPT)
8. By Power Transfer Range
- 8.1. Introduction
- 8.1.1. Market Size Analysis and Y-o-Y Growth Analysis (%), By Power Transfer Range
- 8.1.2. Market Attractiveness Index, By Power Transfer Range
- 8.2. 3 to 11 kW*
- 8.2.1. Introduction
- 8.2.2. Market Size Analysis and Y-o-Y Growth Analysis (%)
- 8.3. 11 kW to 50 kW
- 8.4. Above 50 kW
9. By End-User
- 9.1. Introduction
- 9.1.1. Market Size Analysis and Y-o-Y Growth Analysis (%), By End-User
- 9.1.2. Market Attractiveness Index, By End-User
- 9.2. Residential*
- 9.2.1. Introduction
- 9.2.2. Market Size Analysis and Y-o-Y Growth Analysis (%)
- 9.3. Commercial
10. By Application
- 10.1. Introduction
- 10.1.1. Market Size Analysis and Y-o-Y Growth Analysis (%), By Application
- 10.1.2. Market Attractiveness Index, By Application
- 10.2. Commercial Vehicles*
- 10.2.1. Introduction
- 10.2.2. Market Size Analysis and Y-o-Y Growth Analysis (%)
- 10.3. Passenger Vehicles
11. By Region
- 11.1. Introduction
- 11.1.1. Market Size Analysis and Y-o-Y Growth Analysis (%), By Region
- 11.1.2. Market Attractiveness Index, By Region
- 11.2. North America
- 11.2.1. Introduction
- 11.2.2. Key Region-Specific Dynamics
- 11.2.3. Market Size Analysis and Y-o-Y Growth Analysis (%), By Technology
- 11.2.4. Market Size Analysis and Y-o-Y Growth Analysis (%), By Power Transfer Range
- 11.2.5. Market Size Analysis and Y-o-Y Growth Analysis (%), By End-User
- 11.2.6. Market Size Analysis and Y-o-Y Growth Analysis (%), By Application
- 11.2.7. Market Size Analysis and Y-o-Y Growth Analysis (%), By Country
- 11.2.7.1. U.S.
- 11.2.7.2. Canada
- 11.2.7.3. Mexico
- 11.3. Europe
- 11.3.1. Introduction
- 11.3.2. Key Region-Specific Dynamics
- 11.3.3. Market Size Analysis and Y-o-Y Growth Analysis (%), By Technology
- 11.3.4. Market Size Analysis and Y-o-Y Growth Analysis (%), By Power Transfer Range
- 11.3.5. Market Size Analysis and Y-o-Y Growth Analysis (%), By End-User
- 11.3.6. Market Size Analysis and Y-o-Y Growth Analysis (%), By Application
- 11.3.7. Market Size Analysis and Y-o-Y Growth Analysis (%), By Country
- 11.3.7.1. Germany
- 11.3.7.2. UK
- 11.3.7.3. France
- 11.3.7.4. Italy
- 11.3.7.5. Russia
- 11.3.7.6. Rest of Europe
- 11.4. South America
- 11.4.1. Introduction
- 11.4.2. Key Region-Specific Dynamics
- 11.4.3. Market Size Analysis and Y-o-Y Growth Analysis (%), By Technology
- 11.4.4. Market Size Analysis and Y-o-Y Growth Analysis (%), By Power Transfer Range
- 11.4.5. Market Size Analysis and Y-o-Y Growth Analysis (%), By End-User
- 11.4.6. Market Size Analysis and Y-o-Y Growth Analysis (%), By Application
- 11.4.7. Market Size Analysis and Y-o-Y Growth Analysis (%), By Country
- 11.4.7.1. Brazil
- 11.4.7.2. Argentina
- 11.4.7.3. Rest of South America
- 11.5. Asia-Pacific
- 11.5.1. Introduction
- 11.5.2. Key Region-Specific Dynamics
- 11.5.3. Market Size Analysis and Y-o-Y Growth Analysis (%), By Technology
- 11.5.4. Market Size Analysis and Y-o-Y Growth Analysis (%), By Power Transfer Range
- 11.5.5. Market Size Analysis and Y-o-Y Growth Analysis (%), By End-User
- 11.5.6. Market Size Analysis and Y-o-Y Growth Analysis (%), By Application
- 11.5.7. Market Size Analysis and Y-o-Y Growth Analysis (%), By Country
- 11.5.7.1. China
- 11.5.7.2. India
- 11.5.7.3. Japan
- 11.5.7.4. Australia
- 11.5.7.5. Rest of Asia-Pacific
- 11.6. Middle East and Africa
- 11.6.1. Introduction
- 11.6.2. Key Region-Specific Dynamics
- 11.6.3. Market Size Analysis and Y-o-Y Growth Analysis (%), By Technology
- 11.6.4. Market Size Analysis and Y-o-Y Growth Analysis (%), By Power Transfer Range
- 11.6.5. Market Size Analysis and Y-o-Y Growth Analysis (%), By End-User
- 11.6.6. Market Size Analysis and Y-o-Y Growth Analysis (%), By Application
12. Competitive Landscape
- 12.1. Competitive Scenario
- 12.2. Market Positioning/Share Analysis
- 12.3. Mergers and Acquisitions Analysis
13. Company Profiles
- 13.1. WiTricity Corporation*
- 13.1.1. Company Overview
- 13.1.2. Technology Portfolio and Description
- 13.1.3. Financial Overview
- 13.1.4. Recent Developments
- 13.2. Qualcomm Halo
- 13.3. Plugless (Evatran Group)
- 13.4. Momentum Dynamics Corporation
- 13.5. Bombardier Primove
- 13.6. Hella Aglaia Mobile Vision GmbH
- 13.7. HEVO Inc.
- 13.8. Electreon Wireless
- 13.9. Groupe Renault
- 13.10. BMW Group
LIST NOT EXHAUSTIVE
14. Appendix
- 14.1. About Us and Services
- 14.2. Contact Us
