|
|
市場調査レポート
商品コード
1285057
商用車テレマティクスの世界市場- 2023-2030年Global Commercial Vehicle Telematics Market - 2023-2030 |
||||||
カスタマイズ可能
適宜更新あり
|
|||||||
| 商用車テレマティクスの世界市場- 2023-2030年 |
|
出版日: 2023年06月05日
発行: DataM Intelligence
ページ情報: 英文 170 Pages
納期: 即日から翌営業日
|
- 全表示
- 概要
- 目次
市場概要
商用車テレマティクスの世界市場規模は2022年に188億5,130万米ドルに達し、2030年には最大617億2,100万米ドルに達することで有利な成長が予測されます。予測期間2023-2030年のCAGRは12.1%で成長しています。
世界の商用車テレマティクス市場は、過去10年間に力強い成長を遂げており、今後も拡大が予想されます。商用車テレマティクスソリューションは、リアルタイムの追跡、モニタリング、診断を提供し、フリート管理者は車両性能の最適化、燃料消費の削減、全体的な業務効率の向上を実現することができます。
北米は、2022年の世界市場全体の約25%のシェアを獲得しており、予測期間中も世界市場で大きなシェアを占めると予想されます。北米の商用車テレマティクス市場では、米国が地域全体の市場シェアの75~80%以上を占めており、主要市場となっています。
市場力学
フリートマネジメントの効率化が市場成長を促進
フリートマネージャーは、テレマティクスデータを活用して、ルート計画、燃料消費、車両メンテナンス、 促進要因の行動など、フリートオペレーションのさまざまな側面を監視し最適化することができます。このデータを分析することで、フリートマネージャーは非効率な部分を特定し、全体的な業務効率を向上させるための事前対策を講じることができます。これにより、コスト削減、生産性の向上、リソースの有効活用が可能となり、テレマティクスソリューションはフリートオペレーターにとって非常に魅力的なものとなっています。
認識と理解の不足
認知度の低さは、テレマティクス技術に関する誤解や神話につながる可能性があります。例えば、一部のフリートオペレーターは、テレマティクス・システムが 促進要因のプライバシーを侵害したり、管理上の負担を増やしたりすると考えているかもしれません。このような誤解は、採用意欲を削ぎ、市場成長の妨げになる可能性があります。
フリートオペレーターは、市場で入手可能な幅広いテレマティクス・ソリューションについて知らない可能性があります。また、独自の業務上の課題を解決するための具体的な機能や性能についてもよく知らない可能性があります。このような知識の欠如は、効率性の向上やコスト削減の機会を逃すことになりかねません。
COVID-19影響分析
COVID-19分析では、COVID前シナリオ、COVIDシナリオ、COVID後シナリオに加え、価格力学(COVID前シナリオと比較したパンデミック中・後の価格変動を含む)、需要-供給スペクトラム(取引制限、ロックダウン、その後の問題による需要と供給のシフト)、政府の取り組み(政府機関による市場、セクター、産業の活性化に関する取り組み)、メーカー戦略的取り組み(COVID問題を軽減するためのメーカーの取り組み)についても解説しています。
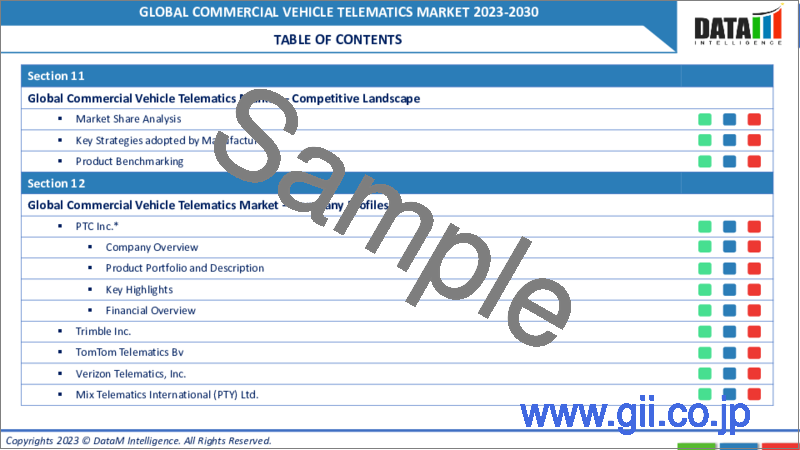
目次
第1章 調査手法と範囲
- 調査手法
- 調査目的および調査範囲
第2章 定義と概要
第3章 エグゼクティブサマリー
- タイプ別スニペット
- スニペット:流通チャネル別
- スニペット:エンドユーザー別
- 地域別スニペット
第4章 市場力学
- 影響要因
- 促進要因
- フリートマネジメントの効率化が市場成長の原動力
- 抑制要因
- 認知度や理解度が低い
- 機会
- コネクテッドカーへの需要の高まり
- 影響分析
- 促進要因
第5章 産業分析
- ポーターのファイブフォース分析
- サプライチェーン分析
- 価格分析
- 法規制の分析
第6章 COVID-19の分析
- COVID-19の分析
- COVID-19の前のシナリオ
- COVID-19期間中のシナリオ
- COVID-19後のシナリオ、または将来のシナリオ
- COVID-19の中での価格・ダイナミクス
- 需給スペクトル
- パンデミック時の市場に関連する政府の取り組み
- メーカー各社の戦略的取り組み
- サマリー
第7章 タイプ別
- ソリューション
- サービス
第8章 販売チャネル別
- OEM
- アフターマーケット
第9章 エンドユーザー別
- 輸送・ロジスティクス
- メディア・エンターテインメント
- 政府・公益事業
- 旅行・観光
- 建設業
- ヘルスケア
- 教育
第10章 地域別
- 北米
- 米国
- カナダ
- メキシコ
- 欧州
- ドイツ
- 英国
- フランス
- イタリア
- ロシア
- その他欧州
- 南米
- ブラジル
- アルゼンチン
- その他南米地域
- アジア太平洋地域
- 中国
- インド
- 日本
- オーストラリア
- その他アジア太平洋地域
- 中東・アフリカ地域
第11章 競合情勢
- 競合シナリオ
- 市況/シェア分析
- M&A(合併・買収)分析
第12章 企業プロファイル
- PTC Inc.
- 会社概要
- 流通経路のポートフォリオと説明
- 財務概要
- 主な発展状況
- Trimble Inc.
- TomTom Telematics Bv
- Verizon Telematics, Inc.
- Mix Telematics International(PTY)Ltd.
- Zonar Systems, Inc.
- OCTO Telematics Ltd.
- Omnitracs, LLC
- Masternaut Limited
- Microlise Group Ltd.
第13章 付録
Market Overview
The Global Commercial Vehicle Telematics Market size reached US$ 18,851.3 million in 2022 and is projected to witness lucrative growth by reaching up to US$ 61721 million by 2030. The market is growing at a CAGR of 12.1% during the forecast period 2023-2030.
The global commercial vehicle telematics market has experienced robust growth over the past decade and is expected to continue expanding. Commercial vehicle telematics solutions provide real-time tracking, monitoring and diagnostics, allowing fleet managers to optimize vehicle performance, reduce fuel consumption and improve overall operational efficiency.
North America is capturing approximately 25% of the total global market share in the year 2022 and is expected to hold a significant market share in the global market during the forecasted period. The U.S. is the leading market in the North American commercial vehicles telematics market, which is accounting for more than 75-80% of the total regional market share.
Market Dynamics
Fleet Management Efficiency Drives the Market Growth
Fleet managers can utilize telematics data to monitor and optimize various aspects of fleet operations, such as route planning, fuel consumption, vehicle maintenance and driver behavior. By analyzing this data, fleet managers can identify inefficiencies and take proactive measures to improve overall operational efficiency. This leads to cost savings, increased productivity and better resource utilization, making telematics solutions highly attractive to fleet operators.
Limited Awareness and Understanding
Lack of awareness can lead to misconceptions and myths about telematics technology. For example, some fleet operators may believe that telematics systems invade driver privacy or create additional administrative burdens. Such misconceptions can discourage adoption and hinder market growth.
Fleet operators may be unaware of the wide range of telematics solutions available in the market. They may not be familiar with the specific features and capabilities that can address their unique operational challenges. This lack of knowledge can result in missed opportunities to improve efficiency and reduce costs.
COVID-19 Impact Analysis
The COVID-19 Analysis includes Pre-COVID Scenario, COVID Scenario and Post-COVID Scenario along with Pricing Dynamics (Including pricing change during and post-pandemic comparing it with pre-COVID scenarios), Demand-Supply Spectrum (Shift in demand and supply owing to trading restrictions, lockdown and subsequent issues), Government Initiatives (Initiatives to revive market, sector or Industry by Government Bodies) and Manufacturers Strategic Initiatives (What manufacturers did to mitigate the COVID issues will be covered here).
Segment Analysis
The global commercial vehicle telematics market is segmented based on type, distribution channel, end-user and region.
The Rapidly Growing Manufacturing Process Drives the Transportation and Logistics Sector
As the manufacturing process expands, there is a higher demand for commercial vehicles to transport goods and materials. This growth in the number of commercial vehicles on the road creates a greater need for efficient fleet management, which can be achieved through the implementation of telematics solutions. Telematics systems provide real-time data and insights that enable manufacturers to optimize their fleets, improve operational efficiency and meet the increased transportation demands.
Geographical Analysis
Increased Awareness About Drivers' Safety in Asia-Pacific
Due to untapped market strength, increasing awareness about driver safety and accident prevention, upcoming regulations to improve road safety, the presence of leading OEM players, growing transportation & logistics industries and the introduction of 4G LTE technology and smartphones, Asia-Pacific is expected to witness significant growth in the commercial vehicle telematics market in the projected period.
Regional economic integration, free trade agreements, e-commerce and digitalization, are just a few of the primary drivers predicted to reshape the region. International firms are moving into the region to capitalize on this trend and the associated growth possibilities. India is the second fastest-growing region in the Asia-Pacific market, which approximately accounts for 25% of the regional market share.
Competitive Landscape
The major global players include: PTC Inc., Trimble Inc., TomTom Telematics Bv, Verizon Telematics, Inc., Mix Telematics International (PTY) Ltd., Zonar Systems, Inc., OCTO Telematics Ltd., Omnitracs, LLC, Masternaut Limited and Microlise Group Ltd.
Why Purchase the Report?
- To visualize the global commercial vehicle telematics market segmentation based on type, distribution channel, end-user and region, as well as understand key commercial assets and players.
- Identify commercial opportunities by analyzing trends and co-development.
- Excel data sheet with numerous data points of commercial vehicle telematics market level with all segments.
- PDF report consists of a comprehensive analysis after exhaustive qualitative interviews and an in-depth study.
- Distribution Channel mapping available as Excel consisting of key products of all the major players.
The Global Commercial Vehicle Telematics Market Report Would Provide Approximately 61 Tables, 59 Figures and 170 Pages.
Target Audience 2023
- Manufacturers / Buyers
- Industry Investors/Investment Bankers
- Research Professionals
- Emerging Companies
Table of Contents
1. Methodology and Scope
- 1.1. Research Methodology
- 1.2. Research Objective and Scope of the Report
2. Definition and Overview
3. Executive Summary
- 3.1. Snippet by Type
- 3.2. Snippet by Distribution Channel
- 3.3. Snippet by End-User
- 3.4. Snippet by Region
4. Dynamics
- 4.1. Impacting Factors
- 4.1.1. Drivers
- 4.1.1.1. Fleet management efficiency drives the market growth
- 4.1.2. Restraints
- 4.1.2.1. Limited awareness and understanding
- 4.1.3. Opportunity
- 4.1.3.1. Rising demand for connected vehicles
- 4.1.4. Impact Analysis
- 4.1.1. Drivers
5. Industry Analysis
- 5.1. Porter's Five Forces Analysis
- 5.2. Supply Chain Analysis
- 5.3. Pricing Analysis
- 5.4. Regulatory Analysis
6. COVID-19 Analysis
- 6.1. Analysis of COVID-19
- 6.1.1. Scenario Before COVID-19
- 6.1.2. Scenario During COVID-19
- 6.1.3. Post COVID-19 or Future Scenario
- 6.2. Pricing Dynamics Amid COVID-19
- 6.3. Demand-Supply Spectrum
- 6.4. Government Initiatives Related to the Market During the Pandemic
- 6.5. Manufacturers' Strategic Initiatives
- 6.6. Conclusion
7. By Type
- 7.1. Introduction
- 7.1.1. Market Size Analysis and Y-o-Y Growth Analysis (%), By Type
- 7.1.2. Market Attractiveness Index, By Type
- 7.2. Solution*
- 7.2.1. Introduction
- 7.2.2. Market Size Analysis and Y-o-Y Growth Analysis (%)
- 7.3. Service
8. By Distribution Channel
- 8.1. Introduction
- 8.1.1. Market Size Analysis and Y-o-Y Growth Analysis (%), By Distribution Channel
- 8.1.2. Market Attractiveness Index, By Distribution Channel
- 8.2. OEM*
- 8.2.1. Introduction
- 8.2.2. Market Size Analysis and Y-o-Y Growth Analysis (%)
- 8.3. Aftermarket
9. By End-User
- 9.1. Introduction
- 9.1.1. Market Size Analysis and Y-o-Y Growth Analysis (%), By End-User
- 9.1.2. Market Attractiveness Index, By End-User
- 9.2. Transportation and Logistics*
- 9.2.1. Introduction
- 9.2.2. Market Size Analysis and Y-o-Y Growth Analysis (%)
- 9.3. Media and Entertainment
- 9.4. Government and Utilities
- 9.5. Travel and Tourism
- 9.6. Construction
- 9.7. Healthcare
- 9.8. Education
10. By Region
- 10.1. Introduction
- 10.1.1. Market Size Analysis and Y-o-Y Growth Analysis (%), By Region
- 10.1.2. Market Attractiveness Index, By Region
- 10.2. North America
- 10.2.1. Introduction
- 10.2.2. Key Region-Specific Dynamics
- 10.2.3. Market Size Analysis and Y-o-Y Growth Analysis (%), By Type
- 10.2.4. Market Size Analysis and Y-o-Y Growth Analysis (%), By Distribution Channel
- 10.2.5. Market Size Analysis and Y-o-Y Growth Analysis (%), By End-User
- 10.2.6. Market Size Analysis and Y-o-Y Growth Analysis (%), By Country
- 10.2.6.1. The U.S.
- 10.2.6.2. Canada
- 10.2.6.3. Mexico
- 10.3. Europe
- 10.3.1. Introduction
- 10.3.2. Key Region-Specific Dynamics
- 10.3.3. Market Size Analysis and Y-o-Y Growth Analysis (%), By Type
- 10.3.4. Market Size Analysis and Y-o-Y Growth Analysis (%), By Distribution Channel
- 10.3.5. Market Size Analysis and Y-o-Y Growth Analysis (%), By End-User
- 10.3.6. Market Size Analysis and Y-o-Y Growth Analysis (%), By Country
- 10.3.6.1. Germany
- 10.3.6.2. The UK
- 10.3.6.3. France
- 10.3.6.4. Italy
- 10.3.6.5. Russia
- 10.3.6.6. Rest of Europe
- 10.4. South America
- 10.4.1. Introduction
- 10.4.2. Key Region-Specific Dynamics
- 10.4.3. Market Size Analysis and Y-o-Y Growth Analysis (%), By Type
- 10.4.4. Market Size Analysis and Y-o-Y Growth Analysis (%), By Distribution Channel
- 10.4.5. Market Size Analysis and Y-o-Y Growth Analysis (%), By End-User
- 10.4.6. Market Size Analysis and Y-o-Y Growth Analysis (%), By Country
- 10.4.6.1. Brazil
- 10.4.6.2. Argentina
- 10.4.6.3. Rest of South America
- 10.5. Asia-Pacific
- 10.5.1. Introduction
- 10.5.2. Key Region-Specific Dynamics
- 10.5.3. Market Size Analysis and Y-o-Y Growth Analysis (%), By Type
- 10.5.4. Market Size Analysis and Y-o-Y Growth Analysis (%), By Distribution Channel
- 10.5.5. Market Size Analysis and Y-o-Y Growth Analysis (%), By End-User
- 10.5.6. Market Size Analysis and Y-o-Y Growth Analysis (%), By Country
- 10.5.6.1. China
- 10.5.6.2. India
- 10.5.6.3. Japan
- 10.5.6.4. Australia
- 10.5.6.5. Rest of Asia-Pacific
- 10.6. Middle East and Africa
- 10.6.1. Introduction
- 10.6.2. Key Region-Specific Dynamics
- 10.6.3. Market Size Analysis and Y-o-Y Growth Analysis (%), By Type
- 10.6.4. Market Size Analysis and Y-o-Y Growth Analysis (%), By Distribution Channel
- 10.6.5. Market Size Analysis and Y-o-Y Growth Analysis (%), By End-User
11. Competitive Landscape
- 11.1. Competitive Scenario
- 11.2. Market Positioning/Share Analysis
- 11.3. Mergers and Acquisitions Analysis
12. Company Profiles
- 12.1. PTC Inc.*
- 12.1.1. Company Overview
- 12.1.2. Distribution Channel Portfolio and Description
- 12.1.3. Financial Overview
- 12.1.4. Key Developments
- 12.2. Trimble Inc.
- 12.3. TomTom Telematics Bv
- 12.4. Verizon Telematics, Inc.
- 12.5. Mix Telematics International (PTY) Ltd.
- 12.6. Zonar Systems, Inc.
- 12.7. OCTO Telematics Ltd.
- 12.8. Omnitracs, LLC
- 12.9. Masternaut Limited
- 12.10. Microlise Group Ltd.
LIST NOT EXHAUSTIVE
13. Appendix
- 13.1. About Us and Services
- 13.2. Contact Us


