|
|
市場調査レポート
商品コード
1279702
パワー半導体の世界市場- 2023-2030年Global Power Semiconductor Market - 2023-2030 |
||||||
|
|
|||||||
カスタマイズ可能
適宜更新あり
|
|||||||


| パワー半導体の世界市場- 2023-2030年 |
|
出版日: 2023年05月26日
発行: DataM Intelligence
ページ情報: 英文 195 Pages
納期: 即日から翌営業日
|

- 全表示
- 概要
- 目次
市場の概要
パワー半導体の世界市場は、2022年に561億5,500万米ドルに達し、2030年には最大1,717億900万米ドルに達することで有利な成長が予測されます。同市場は、予測期間中(2023年~2030年)に15.0%のCAGRで成長する見通しです。
パワー半導体は、大電力と高電圧レベルを扱うように設計された電子部品です。パワー半導体は、電源、モーター制御、照明、再生可能エネルギーシステムなど様々な用途で広く使用されており、一般的にシリコン、窒化ガリウム(GaN)、炭化ケイ素(SiC)などの材料でできています。自動車や家電など様々な産業の成長により、パワー半導体の需要が増加しています。
市場力学
パワー半導体に使用される材料技術の進歩
新しいパワー半導体は、GaN、SiC、シリコンなど、さまざまな競合技術を用いた特殊なトランジスタです。GaNとSiCはいずれもワイドバンドギャップ技術であり、シリコンベースのデバイスよりも効率的で高速であることを意味します。現在、シリコンベースのデバイスはパワー半導体市場全体の90%以上を占めています。GaNとSiCデバイスの採用率は低いもの、今後数年でシリコンを駆逐すると予想されています。材料技術の発展により、より高速、高効率、長寿命のチップが開発され、パワー半導体の世界市場の成長を促進する主な要因になると考えられます。
電気自動車(EV)の普及拡大
地球温暖化を抑制するために、政府の政策が交通機関の脱炭素化にシフトしているため、電気自動車(EV)の採用が世界的に急速に増加しています。パワー半導体は、EVのパワートレイン開発において重要な役割を担っています。パワー半導体は、電気モーターやバッテリー管理システムなど、EVの構成部品に使用されており、EV市場の成長には欠かせないものとなっています。
COVID-19の影響分析
COVID-19の分析には、Pre-COVIDシナリオ、COVIDシナリオ、Post-COVIDシナリオがあり、価格ダイナミクス(COVID前のシナリオと比較したパンデミック中と後の価格変化など)、需要-供給スペクトラム(取引制限、ロックダウン、その後の問題による需要と供給のシフト)、政府の取り組み(政府機関による市場、セクター、産業の再生への取り組み)、メーカー戦略イニシアチブ(COVID問題を軽減するためのメーカーの取り組み)についても解説しています。
目次
第1章 調査手法と範囲
- 調査手法
- 調査目的および調査範囲
第2章 定義と概要
第3章 エグゼクティブサマリー
- コンポーネント別スニペット
- 素材別スニペット
- スニペット:用途別
- 地域別スニペット
第4章 市場力学
- 影響要因
- 促進要因
- パワー半導体に使用される材料技術の高度化
- 抑制要因
- パワー半導体の製造に伴う環境汚染
- 機会
- 電気自動車(EV)の普及拡大
- 影響分析
- 促進要因
第5章 産業分析
- ポーターのファイブフォース分析
- サプライチェーン分析
- 価格分析
- 法規制の分析
第6章 COVID-19の分析
- COVID-19の分析
- COVID-19の前のシナリオ
- COVID-19期間中のシナリオ
- COVID-19後のシナリオ、または将来のシナリオ
- COVID-19の中での価格・ダイナミクス
- 需給スペクトル
- パンデミック時の市場に関連する政府の取り組み
- メーカーの戦略的な取り組み
- サマリー
第7章 コンポーネント別
- ディスクリート
- シリコン(Si)
- 炭化ケイ素(SiC)
- 窒化ガリウム(GaN)
- IGBT
- MOSFET
- モジュール
- シリコン(Si)
- 炭化ケイ素(SiC)
- 窒化ガリウム(GaN)
- IGBT
- MOSFET
- 電力集積回路
- シリコン(Si)
- 炭化ケイ素(SiC)
- 窒化ガリウム(GaN)
- IGBT
- MOSFET
第8章 材料別
- シリコン(Si)
- 炭化ケイ素(SiC)
- 窒化ガリウム(GaN)
- IGBT
- MOSFET
第9章 用途別
- 自動車用
- シリコン(Si)
- 炭化ケイ素(SiC)
- 窒化ガリウム(GaN)
- IGBT
- MOSFET
- 民生用電子機器
- シリコン(Si)
- 炭化ケイ素(SiC)
- 窒化ガリウム(GaN)
- IGBT
- MOSFET
- 軍事・航空宇宙
- シリコン(Si)
- 炭化ケイ素(SiC)
- 窒化ガリウム(GaN)
- IGBT
- MOSFET
- 産業用
- シリコン(Si)
- 炭化ケイ素(SiC)
- 窒化ガリウム(GaN)
- IGBT
- MOSFET
第10章 地域別
- 北米
- 米国
- カナダ
- メキシコ
- 欧州
- ドイツ
- 英国
- フランス
- その他欧州
- 南米
- ブラジル
- アルゼンチン
- その他南米地域
- アジア太平洋地域
- 中国
- インド
- 日本
- オーストラリア
- その他アジア太平洋地域
- 中東・アフリカ地域
第11章 競合情勢
- 競合シナリオ
- 市況ポジショニング/シェア分析
- M&A(合併・買収)分析
第12章 企業プロファイル
- Infineon Technologies AG
- 会社概要
- 製品ポートフォリオと説明
- 財務概要
- 主な発展状況
- STMicroelectronics
- NXP Semiconductor
- Renesas Electronics Corporation
- Robert Bosch GmbH
- Mitsubishi Electric Corporation
- Semiconductor Components Industries, LLC
- Toshiba Corporation
- Fuji Electric Co., Ltd.
- Semikron Elektronik GmbH & Co. KG
- ROHM Semiconductor
- Littelfuse
- Texas Instruments
- Analog Devices
- Qualcomm
第13章 付録
Market Overview
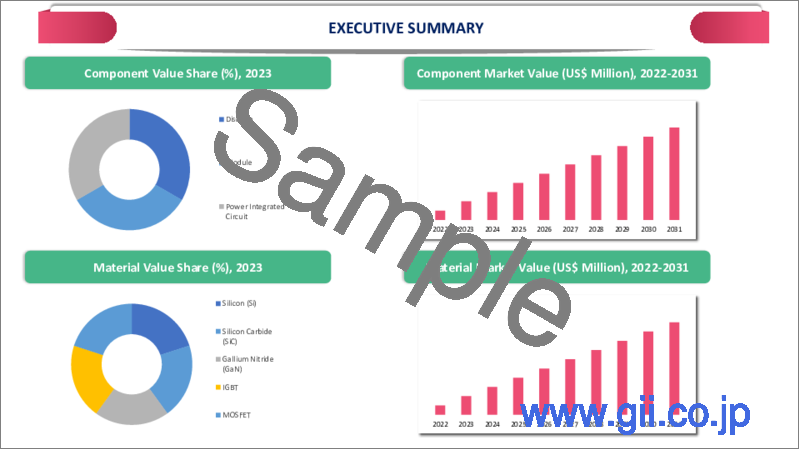
The global power semiconductor market reached US$ 56,155 million in 2022 and is projected to witness lucrative growth by reaching up to US$ 171,709 million by 2030. The market is growing at a CAGR of 15.0% during the forecast period (2023-2030).
Power semiconductors are electronic components that are designed to handle high power and high voltage levels. Power semiconductors are widely used in a variety of applications such as power supplies, motor control, lighting, and renewable energy systems and are typically made of materials such as silicon, gallium nitride (GaN), and silicon carbide (SiC). The growth in various industries such as automotive and consumer electronics is driving increasing demand for power semiconductors.
Market Dynamics
Advancements in Material Technologies Used In Power Semiconductors
New power semiconductors are specialized transistors using various competitive technologies such as GaN, SiC, and silicon. GaN and SiC are both wide-bandgap technologies, which means they are more efficient and faster than silicon-based devices. Today, silicon-based devices account for over 90% of the total power semiconductor market. Although GaN and SiC devices have low adoption rates, they are expected to displace silicon in the coming years. Advancements in material technologies could develop faster, more efficient, and long-lasting chips and make them a key factor in driving the global power semiconductor market growth.
Growing Adoption Of Electric Vehicles (EVs)
The adoption of electric vehicles (EVs) is rapidly increasing globally as government policies shift towards decarbonization of transportation to limit global warming. Power semiconductors play a crucial role in the development of EV powertrains. Power semiconductors are used in electric motors, battery management systems, and other components of EVs, making them essential for the growth of the EV market.
COVID-19 Impact Analysis
The COVID-19 analysis includes Pre-COVID Scenario, COVID Scenario and Post-COVID Scenario along with pricing dynamics (including pricing change during and post-pandemic comparing it with pre-COVID scenarios), demand-supply spectrum (shift in demand and supply owing to trading restrictions, lockdown and subsequent issues), government initiatives (initiatives to revive market, sector or industry by government bodies) and manufacturers strategic initiatives (what manufacturers did to mitigate the COVID issues will be covered here).
Segment Analysis
The global power semiconductors market is segmented based on component, material, application and region.
Due to High Volume Demand, Automotive Dominates The Application Segment
The automotive segment dominates the application segment with a market share of 35%. The rising expansion of the automotive sector in emerging nations, such as India and China is positively impacting the market's growth in upcoming years. Additionally, growth in the power semiconductor is also driven by the increasing sales of advanced driver assistance systems (ADAS) and electrified powertrains used in various automotive vehicles, bolstering the global market growth.
Geographical Analysis
Increase in Government Support Helps North America Retain A Strong Position In The Global Market
North America comes in second with a share of nearly 22%, only behind Asia-Pacific, which has a share of 56% in the global power semiconductor market. The U.S. proclaimed its goal to maintain its attractiveness as a manufacturing destination and to reduce the country's reliance on imports from Asia. Among other things, U.S. President Joe Biden aims to introduce legislation providing US$ 50 billion for the chip industry to avoid future bottlenecks in chip production. The industry group SEMI (Semiconductor Equipment and Materials International) had previously urged increased government funding for the U.S. semiconductor industry.
Competitive Landscape
The major global players include: Infineon Technologies AG, STMicroelectronics, NXP Semiconductors, Renesas Electronics Corporation, Robert Bosch GmbH, Mitsubishi Electric Corporation, Semiconductor Components Industries, LLC, LittelFuse, Texas Instruments, Analog Devices, Qualcomm, Semikron Elektronik GmbH & Co. KG, Toshiba Corporation and Fuji Electric Co., Ltd.
Why Purchase the Report?
- To visualize the global power semiconductors market segmentation based on product, application and region, as well as understand key commercial assets and players.
- Identify commercial opportunities by analyzing trends and co-development.
- Excel data sheet with numerous data points of power semiconductors market-level with all segments.
- PDF report consists of a comprehensive analysis after exhaustive qualitative interviews and an in-depth study.
- Product mapping available as Excel consisting of key products of all the major players.
The global power semiconductors market report would provide approximately 79 tables, 60 figures and 195 Pages.
Target Audience 2023
- Manufacturers/ Buyers
- Industry Investors/Investment Bankers
- Research Professionals
- Emerging Companies
Table of Contents
1. Methodology and Scope
- 1.1. Research Methodology
- 1.2. Research Objective and Scope of the Report
2. Definition and Overview
3. Executive Summary
- 3.1. Snippet by Component
- 3.2. Snippet by Material
- 3.3. Snippet by Application
- 3.4. Snippet by Region
4. Dynamics
- 4.1. Impacting Factors
- 4.1.1. Drivers
- 4.1.1.1. Advancement in material technologies used in power semiconductors
- 4.1.2. Restraints
- 4.1.2.1. Environmental pollution associated with power semiconductor manufacturing
- 4.1.3. Opportunity
- 4.1.3.1. Growing adoption of electric vehicles (EVs)
- 4.1.4. Impact Analysis
- 4.1.1. Drivers
5. Industry Analysis
- 5.1. Porter's Five Forces Analysis
- 5.2. Supply Chain Analysis
- 5.3. Pricing Analysis
- 5.4. Regulatory Analysis
6. COVID-19 Analysis
- 6.1. Analysis of COVID-19
- 6.1.1. Scenario Before COVID-19
- 6.1.2. Scenario During COVID-19
- 6.1.3. Post COVID-19 or Future Scenario
- 6.2. Pricing Dynamics Amid COVID-19
- 6.3. Demand-Supply Spectrum
- 6.4. Government Initiatives Related to the Market During Pandemic
- 6.5. Manufacturers Strategic Initiatives
- 6.6. Conclusion
7. By Component
- 7.1. Introduction
- 7.1.1. Market Size Analysis and Y-o-Y Growth Analysis (%), By Component
- 7.1.2. Market Attractiveness Index, By Component
- 7.2. Discrete*
- 7.2.1. Introduction
- 7.2.2. Market Size Analysis and Y-o-Y Growth Analysis (%)
- 7.2.3. Silicon (Si)
- 7.2.4. Silicon Carbide (SiC)
- 7.2.5. Gallium Nitride (GaN)
- 7.2.6. IGBT
- 7.2.7. MOSFET
- 7.3. Module
- 7.3.1. Silicon (Si)
- 7.3.2. Silicon Carbide (SiC)
- 7.3.3. Gallium Nitride (GaN)
- 7.3.4. IGBT
- 7.3.5. MOSFET
- 7.4. Power Integrated Circuit
- 7.4.1. Silicon (Si)
- 7.4.2. Silicon Carbide (SiC)
- 7.4.3. Gallium Nitride (GaN)
- 7.4.4. IGBT
- 7.4.5. MOSFET
8. By Material
- 8.1. Introduction
- 8.1.1. Market Size Analysis and Y-o-Y Growth Analysis (%), By Material
- 8.1.2. Market Attractiveness Index, By Material
- 8.2. Silicon (Si)*
- 8.2.1. Introduction
- 8.2.2. Market Size Analysis and Y-o-Y Growth Analysis (%)
- 8.3. Silicon Carbide (SiC)
- 8.4. Gallium Nitride (GaN)
- 8.5. IGBT
- 8.6. MOSFET
9. By Application
- 9.1. Introduction
- 9.1.1. Market Size Analysis and Y-o-Y Growth Analysis (%), By Application
- 9.1.2. Market Attractiveness Index, By Application
- 9.2. Automotive*
- 9.2.1. Introduction
- 9.2.2. Market Size Analysis and Y-o-Y Growth Analysis (%)
- 9.2.3. Silicon (Si)
- 9.2.4. Silicon Carbide (SiC)
- 9.2.5. Gallium Nitride (GaN)
- 9.2.6. IGBT
- 9.2.7. MOSFET
- 9.3. Consumer Electronics
- 9.3.1. Silicon (Si)
- 9.3.2. Silicon Carbide (SiC)
- 9.3.3. Gallium Nitride (GaN)
- 9.3.4. IGBT
- 9.3.5. MOSFET
- 9.4. Military & Aerospace
- 9.4.1. Silicon (Si)
- 9.4.2. Silicon Carbide (SiC)
- 9.4.3. Gallium Nitride (GaN)
- 9.4.4. IGBT
- 9.4.5. MOSFET
- 9.5. Industrial
- 9.5.1. Silicon (Si)
- 9.5.2. Silicon Carbide (SiC)
- 9.5.3. Gallium Nitride (GaN)
- 9.5.4. IGBT
- 9.5.5. MOSFET
10. By Region
- 10.1. Introduction
- 10.1.1. Market Size Analysis and Y-o-Y Growth Analysis (%), By Region
- 10.1.2. Market Attractiveness Index, By Region
- 10.2. North America
- 10.2.1. Introduction
- 10.2.2. Key Region-Specific Dynamics
- 10.2.3. Market Size Analysis and Y-o-Y Growth Analysis (%), By Product
- 10.2.4. Market Size Analysis and Y-o-Y Growth Analysis (%), By Application
- 10.2.5. Market Size Analysis and Y-o-Y Growth Analysis (%), By Country
- 10.2.5.1. The U.S.
- 10.2.5.2. Canada
- 10.2.5.3. Mexico
- 10.3. Europe
- 10.3.1. Introduction
- 10.3.2. Key Region-Specific Dynamics
- 10.3.3. Market Size Analysis and Y-o-Y Growth Analysis (%), By Product
- 10.3.4. Market Size Analysis and Y-o-Y Growth Analysis (%), By Application
- 10.3.5. Market Size Analysis and Y-o-Y Growth Analysis (%), By Country
- 10.3.5.1. Germany
- 10.3.5.2. The U.K.
- 10.3.5.3. France
- 10.3.5.4. Rest of Europe
- 10.4. South America
- 10.4.1. Introduction
- 10.4.2. Key Region-Specific Dynamics
- 10.4.3. Market Size Analysis and Y-o-Y Growth Analysis (%), By Product
- 10.4.4. Market Size Analysis and Y-o-Y Growth Analysis (%), By Application
- 10.4.5. Market Size Analysis and Y-o-Y Growth Analysis (%), By Country
- 10.4.5.1. Brazil
- 10.4.5.2. Argentina
- 10.4.5.3. Rest of South America
- 10.5. Asia-Pacific
- 10.5.1. Introduction
- 10.5.2. Key Region-Specific Dynamics
- 10.5.3. Market Size Analysis and Y-o-Y Growth Analysis (%), By Product
- 10.5.4. Market Size Analysis and Y-o-Y Growth Analysis (%), By Application
- 10.5.5. Market Size Analysis and Y-o-Y Growth Analysis (%), By Country
- 10.5.5.1. China
- 10.5.5.2. India
- 10.5.5.3. Japan
- 10.5.5.4. Australia
- 10.5.5.5. Rest of Asia-Pacific
- 10.6. Middle East and Africa
- 10.6.1. Introduction
- 10.6.2. Key Region-Specific Dynamics
- 10.6.3. Market Size Analysis and Y-o-Y Growth Analysis (%), By Product
- 10.6.4. Market Size Analysis and Y-o-Y Growth Analysis (%), By Application
11. Competitive Landscape
- 11.1. Competitive Scenario
- 11.2. Market Positioning/Share Analysis
- 11.3. Mergers and Acquisitions Analysis
12. Company Profiles
- 12.1. Infineon Technologies AG *
- 12.1.1. Company Overview
- 12.1.2. Product Portfolio and Description
- 12.1.3. Financial Overview
- 12.1.4. Key Developments
- 12.2. STMicroelectronics
- 12.3. NXP Semiconductor
- 12.4. Renesas Electronics Corporation
- 12.5. Robert Bosch GmbH
- 12.6. Mitsubishi Electric Corporation
- 12.7. Semiconductor Components Industries, LLC
- 12.8. Toshiba Corporation
- 12.9. Fuji Electric Co., Ltd.
- 12.10. Semikron Elektronik GmbH & Co. KG
- 12.11. ROHM Semiconductor
- 12.12. Littelfuse
- 12.13. Texas Instruments
- 12.14. Analog Devices
- 12.15. Qualcomm
LIST NOT EXHAUSTIVE
13. Appendix
- 13.1. About Us and Services
- 13.2. Contact Us