|
|
市場調査レポート
商品コード
1268917
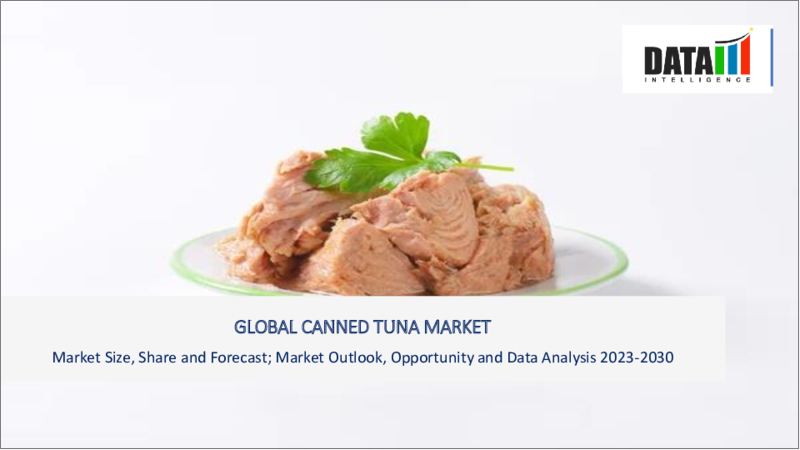
ツナ缶の世界市場- 2023-2030年Global Canned Tuna Market - 2023-2030 |
||||||
カスタマイズ可能
適宜更新あり
|
|||||||
| ツナ缶の世界市場- 2023-2030年 |
|
出版日: 2023年05月02日
発行: DataM Intelligence
ページ情報: 英文 120 Pages
納期: 即日から翌営業日
|
- 全表示
- 概要
- 目次
市場概要
ツナ缶の世界市場規模は、予測期間(2023-2030年)にCAGR 4.5%で成長する見通しです。
ツナ缶は、身体の発育、健康な心臓、機能する脳のために重要な食事成分です。オメガ3脂肪酸、優れたタンパク質、ビタミン、セレンなど、すべてツナ缶に含まれています。賞味期限が長く、多くの栄養素を含む製品がツナ缶です。
水や油などの液体が含まれています。また、ナトリウムやコレステロールを最小限に抑えています。
市場力学
消費者のすぐに調理でき、すぐに食べられる食品への依存度の高まりが市場の発展を支える
消費者は、調理の手軽さからすぐに調理でき、すぐに食べられる食品への依存度が非常に高いです。ツナ缶の普及は、社会人の増加や調理時間の減少に起因しています。短時間で簡単に調理でき、栄養価が高く、調理時間を短縮できるため、ミレニアル世代はこうしたコンビニエンス・フードに強く惹かれています。
多くのメーカーが、消費者に高品質の製品を提供し、より良いサービスを提供するために、新製品の導入や認証取得に注力しており、これが市場成長を促進する要因になると予想されます。
シーフード需要の高まりがツナ缶の需要を牽引する
気候変動や環境破壊、それらが人類に及ぼす深刻な影響に対する認識の高まりから、環境に配慮した開発モデルの導入が急務となっています。シーフードは肉類に比べて二酸化炭素排出量が少ないため、消費者は主なタンパク源としてシーフードにシフトしています。マグロは非常に健康的な食品です。
マグロに含まれるオメガ3、必須脂肪酸、ビタミン、ミネラルは、栄養面で人体の必要性を満たしています。マグロは海に豊富にあるため、加工することは持続可能な行為なのです。また、魚介類は旨味が強いので、お客様には独特の味を楽しんでいただけます。マグロはコンビニエンス・フードとして、世界で最も普及している魚介類の一つです。すぐに食べられ、すぐに調理できる形態で提供されるため、時間に制約のある世界中のミレニアル世代に非常に好まれています。
COVID-19の影響度分析
COVID-19分析では、COVID前シナリオ、COVIDシナリオ、COVID後シナリオに加えて、価格力学(COVID前シナリオと比較したパンデミック中・後の価格変動を含む)、需要-供給スペクトラム(取引制限、ロックダウン、その後の問題による需要と供給のシフト)、政府の取り組み(政府機関による市場、セクター、産業の活性化に関する取り組み)、メーカーの戦略的取り組み(COVID問題を軽減するためのメーカーの取り組み)についても解説しています。
目次
第1章 調査手法とスコープ
- 調査手法
- 調査目的および調査範囲について
第2章 定義と概要
第3章 エグゼクティブサマリー
- タイプ別スニペット
- マグロの種類別スニペット
- 流通チャネル別スニペット
- 地域別スニペット
第4章 ダイナミックス
- 影響要因
- 促進要因
- パッケージ食品に対する消費者の需要の高まりが、市場の成長を後押しする
- 抑制要因
- 植物性食品に対する消費者の需要の高まりが、市場成長の妨げになる
- 機会
- 水産物に含まれる高栄養素に対する消費者の需要の高まりが、市場の成長を後押しする
- 影響度分析
- 促進要因
第5章 産業分析
- ポーターのファイブフォース分析
- サプライチェーン分析
- 価格分析
- 規制分析
第6章 COVID-19の分析
- COVID-19の解析について
- COVID-19シナリオ前
- 現在のCOVID-19シナリオ
- ポストCOVID-19または将来シナリオ
- COVID-19 の中での価格ダイナミクス
- 需給スペクトル
- パンデミック時の市場に関連する政府の取り組み
- メーカーの戦略的な取り組み
- 結論
第7章 タイプ別
- ホワイトツナ缶
- ライトツナ缶
第8章 マグロの種類別
- キハダ
- カツオ
- その他
第9章 流通チャネル別
- スーパーマーケット/ハイパーマーケット
- コンビニエンスストア
- オンライン販売
- その他
第10章 地域別
- 北米
- 米国
- カナダ
- メキシコ
- 欧州
- ドイツ
- 英国
- フランス
- イタリア
- スペイン
- その他欧州
- 南米
- ブラジル
- アルゼンチン
- その他南米地域
- アジア太平洋地域
- 中国
- インド
- 日本
- オーストラリア
- その他アジア太平洋地域
- 中東・アフリカ地域
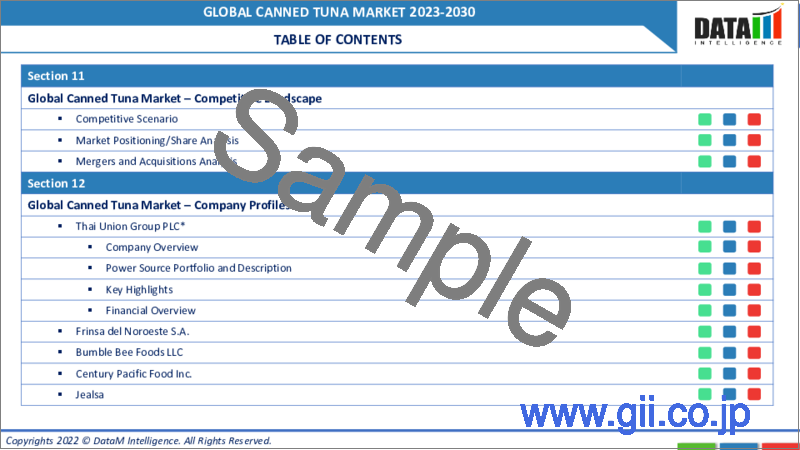
第11章 競合情勢について
- 競合シナリオ
- 市況分析・シェア分析
- M&A分析
第12章 企業プロファイル
- Frinsa del Noroeste S.A.
- 会社概要
- 製品ポートフォリオと説明
- 財務概要
- 主な展開
- Thai Union Group PLC
- Bumble Bee Foods LLC
- Century Pacific Food Inc.
- Jealsa
- Grupo Calvo
- Wild Planet Foods Inc.
- PT. Aneka Tuna Indonesia
- American Tuna Inc.
- Ocean Brands
第13章 付録
Market Overview
The Global Canned Tuna Market size reached US$ XX million in 2022 and is projected to witness lucrative growth by reaching up to US$ XX million by 2030. The market is growing at a CAGR of 4.5% during the forecast period (2023-2030).
Canned tuna is a crucial dietary component for the development of the body, a healthy heart, and a functioning brain. Omega-3 fatty acids, superior protein, vitamins and selenium can all be found in canned tuna. A product with a long shelf life and many nutrients is canned tuna.
Some liquid, such as water or oil, is contained within it. Additionally, it has minimal sodium and cholesterol.
Market Dynamics
Growing Consumer Dependence on Ready-to-cook and Ready-to-eat Food to Support Development of the Market
Consumers are very dependent on ready-to-cook and ready-to-eat food products due to the ease with which they make cooking. The prevalence of canned tuna is due to the increase in the number of working people and the decrease in time spent cooking. Since they are quick and simple to prepare, nutritious and save time on food preparation, the millennial population is highly attracted to these convenience foods.
A lot of manufacturers are concentrating on the introduction of new products and certifications in order to offer consumers high-quality products and to better serve them, which are factors expected to drive market growth.
Rising Demand for Seafood Drives Canned Tuna Demand
The pressing need for implementing environmentally friendly development models was prompted by the growing awareness of climate change, environmental degradation and their serious effects on humanity. As seafood has a lower carbon footprint compared to meat, consumers are shifting to it as their main source of protein. Tuna is a very healthy food.
Omega 3, essential fatty acids, vitamins and minerals found in tuna fish satisfy the needs of the human body in terms of nutrition. Since there is an abundance of tuna in the ocean, processing it is a sustainable practice. Customers can take advantage of a unique taste palette thanks to seafood's strong flavor. Given its status as a convenience food, tuna is among the most prevalent seafood in the world. Due to their availability in ready-to-eat and ready-to-cook forms, they are very well-liked by time-constrained millennials worldwide.
COVID-19 Impact Analysis
The COVID-19 Analysis includes Pre-COVID Scenario, COVID Scenario, and Post-COVID Scenario along with Pricing Dynamics (Including pricing change during and post-pandemic comparing it to pre-COVID scenarios), Demand-Supply Spectrum (Shift in demand and supply owing to trading restrictions, lockdown, and subsequent issues), Government Initiatives (Initiatives to revive market, sector or Industry by Government Bodies) and Manufacturers Strategic Initiatives (What manufacturers did to mitigate the COVID issues will be covered here).
Segment Analysis
The global canned tuna market is segmented based on type, tuna species, distribution channel, and region.
Increasing Demand for Nutrient-Rich Seafood Products
In 2022, the skipjack canned tuna segment accounted for the largest global market share. This species has a rich and nutrient-rich seafood experience and is easily accessible on the market.
According to data from Fish20.org, the majority of the skipjack tuna caught, or about 58.0% of the total capture, is canned. The Center for the Promotion of Imports' statistics shows that skipjack species make up 75.0% of the canned tuna imported into Europe.
Geographical Analysis
The Strong Presence of Vendors and Increased Consumption in North America
The widespread consumption of processed food items and beverages is driving the regional market's rising trend. North America has a developed economy and a sizable population. The number of working professionals in the region has increased significantly. Convenience demand for food is on the rise, an this will support market expansion.
The growth of many global companies' production facilities, especially in the region's major markets like the United States, Canada, and Mexico, has resulted in partnerships with numerous local players, which are factors expected to drive market growth.
Competitive Landscape
The major global players include: Frinsa del Noroeste S.A., Thai Union Group PLC, Bumble Bee Foods LLC, Century Pacific Food Inc., Jealsa, Grupo Calvo, Wild Planet Foods Inc., PT. Aneka Tuna Indonesia, American Tuna Inc., and Ocean Brands.
Why Purchase the Report?
- To visualize the global canned tuna market segmentation based on type, tuna species, distribution channel, and region, as well as understand key commercial assets and players.
- Identify commercial opportunities by analyzing trends and co-development.
- Excel data sheet with numerous data points of canned tuna market-level with all segments.
- PDF report consists of a comprehensive analysis after exhaustive qualitative interviews and an in-depth study.
- Product mapping available as Excel consisting of key products of all the major players.
The Global Canned Tuna Market Report Would Provide Approximately 61 Tables, 59 Figures and 120 pages.
Target Audience 2023
- Manufacturers/Buyers
- Industry Investors/Investment Bankers
- Research Professionals
- Emerging Companies
Table of Contents
1. Methodology and Scope
- 1.1. Research Methodology
- 1.2. Research Objective and Scope of the Report
2. Definition and Overview
3. Executive Summary
- 3.1. Snippet by Type
- 3.2. Snippet by Tuna Species
- 3.3. Snippet by Distribution Channel
- 3.4. Snippet by Region
4. Dynamics
- 4.1. Impacting Factors
- 4.1.1. Drivers
- 4.1.1.1. Growing consumer demand for packaged food products drives the market growth
- 4.1.2. Restraints
- 4.1.2.1. Growing demand from consumers for plant-based foods hampers the market growth
- 4.1.3. Opportunity
- 4.1.3.1. Increasing consumer demand for high-in nutrients in seafood products drives the market growth
- 4.1.4. Impact Analysis
- 4.1.1. Drivers
5. Industry Analysis
- 5.1. Porter's Five Forces Analysis
- 5.2. Supply Chain Analysis
- 5.3. Pricing Analysis
- 5.4. Regulatory Analysis
6. COVID-19 Analysis
- 6.1. Analysis of COVID-19
- 6.1.1. Before COVID-19 Scenario
- 6.1.2. Present COVID-19 Scenario
- 6.1.3. Post COVID-19 or Future Scenario
- 6.2. Pricing Dynamics Amid COVID-19
- 6.3. Demand-Supply Spectrum
- 6.4. Government Initiatives Related to the Market During Pandemic
- 6.5. Manufacturers Strategic Initiatives
- 6.6. Conclusion
7. By Type
- 7.1. Introduction
- 7.1.1. Market Size Analysis and Y-o-Y Growth Analysis (%), By Type
- 7.1.2. Market Attractiveness Index, By Type
- 7.2. Canned White Tuna*
- 7.2.1. Introduction
- 7.2.2. Market Size Analysis and Y-o-Y Growth Analysis (%)
- 7.3. Canned Light Tuna
8. By Tuna Species
- 8.1. Introduction
- 8.1.1. Market Size Analysis and Y-o-Y Growth Analysis (%), By Tuna Species
- 8.1.2. Market Attractiveness Index, By Tuna Species
- 8.2. Yellowfin*
- 8.2.1. Introduction
- 8.2.2. Market Size Analysis and Y-o-Y Growth Analysis (%)
- 8.3. Skipjack
- 8.4. Others
9. By Distribution Channel
- 9.1. Introduction
- 9.1.1. Market Size Analysis and Y-o-Y Growth Analysis (%), By Distribution Channel
- 9.1.2. Market Attractiveness Index, By Distribution Channel
- 9.2. Supermarkets/Hypermarkets*
- 9.2.1. Introduction
- 9.2.2. Market Size Analysis and Y-o-Y Growth Analysis (%)
- 9.3. Convenience Stores
- 9.4. Online Sales
- 9.5. Others
10. By Region
- 10.1. Introduction
- 10.1.1. Market Size Analysis and Y-o-Y Growth Analysis (%), By Region
- 10.1.2. Market Attractiveness Index, By Region
- 10.2. North America
- 10.2.1. Introduction
- 10.2.2. Key Region-Specific Dynamics
- 10.2.3. Market Size Analysis and Y-o-Y Growth Analysis (%), By Type
- 10.2.4. Market Size Analysis and Y-o-Y Growth Analysis (%), By Tuna Species
- 10.2.5. Market Size Analysis and Y-o-Y Growth Analysis (%), By Distribution Channel
- 10.2.6. Market Size Analysis and Y-o-Y Growth Analysis (%), By Country
- 10.2.6.1. U.S.
- 10.2.6.2. Canada
- 10.2.6.3. Mexico
- 10.3. Europe
- 10.3.1. Introduction
- 10.3.2. Key Region-Specific Dynamics
- 10.3.3. Market Size Analysis and Y-o-Y Growth Analysis (%), By Type
- 10.3.4. Market Size Analysis and Y-o-Y Growth Analysis (%), By Tuna Species
- 10.3.5. Market Size Analysis and Y-o-Y Growth Analysis (%), By Distribution Channel
- 10.3.6. Market Size Analysis and Y-o-Y Growth Analysis (%), By Country
- 10.3.6.1. Germany
- 10.3.6.2. UK
- 10.3.6.3. France
- 10.3.6.4. Italy
- 10.3.6.5. Spain
- 10.3.6.6. Rest of Europe
- 10.4. South America
- 10.4.1. Introduction
- 10.4.2. Key Region-Specific Dynamics
- 10.4.3. Market Size Analysis and Y-o-Y Growth Analysis (%), By Type
- 10.4.4. Market Size Analysis and Y-o-Y Growth Analysis (%), By Tuna Species
- 10.4.5. Market Size Analysis and Y-o-Y Growth Analysis (%), By Distribution Channel
- 10.4.6. Market Size Analysis and Y-o-Y Growth Analysis (%), By Country
- 10.4.6.1. Brazil
- 10.4.6.2. Argentina
- 10.4.6.3. Rest of South America
- 10.5. Asia-Pacific
- 10.5.1. Introduction
- 10.5.2. Key Region-Specific Dynamics
- 10.5.3. Market Size Analysis and Y-o-Y Growth Analysis (%), By Type
- 10.5.4. Market Size Analysis and Y-o-Y Growth Analysis (%), By Tuna Species
- 10.5.5. Market Size Analysis and Y-o-Y Growth Analysis (%), By Distribution Channel
- 10.5.6. Market Size Analysis and Y-o-Y Growth Analysis (%), By Country
- 10.5.6.1. China
- 10.5.6.2. India
- 10.5.6.3. Japan
- 10.5.6.4. Australia
- 10.5.6.5. Rest of Asia-Pacific
- 10.6. Middle East and Africa
- 10.6.1. Introduction
- 10.6.2. Key Region-Specific Dynamics
- 10.6.3. Market Size Analysis and Y-o-Y Growth Analysis (%), By Type
- 10.6.4. Market Size Analysis and Y-o-Y Growth Analysis (%), By Tuna Species
- 10.6.5. Market Size Analysis and Y-o-Y Growth Analysis (%), By Distribution Channel
11. Competitive Landscape
- 11.1. Competitive Scenario
- 11.2. Market Positioning/Share Analysis
- 11.3. Mergers and Acquisitions Analysis
12. Company Profiles
- 12.1. Frinsa del Noroeste S.A.*
- 12.1.1. Company Overview
- 12.1.2. Product Portfolio and Description
- 12.1.3. Financial Overview
- 12.1.4. Key Developments
- 12.2. Thai Union Group PLC
- 12.3. Bumble Bee Foods LLC
- 12.4. Century Pacific Food Inc.
- 12.5. Jealsa
- 12.6. Grupo Calvo
- 12.7. Wild Planet Foods Inc.
- 12.8. PT. Aneka Tuna Indonesia
- 12.9. American Tuna Inc.
- 12.10. Ocean Brands
LIST NOT EXHAUSTIVE
13. Appendix
- 13.1. About Us and Services
- 13.2. Contact Us


