
|
市場調査レポート
商品コード
1587924
船橋シミュレータ市場:ソリューションタイプ別、最終用途産業別、地域別Ship Bridge Simulator Market, By Solution Type, By End-use Industry, By Geography |
||||||
カスタマイズ可能
|
|||||||

| 船橋シミュレータ市場:ソリューションタイプ別、最終用途産業別、地域別 |
|
出版日: 2024年10月15日
発行: Coherent Market Insights
ページ情報: 英文 159 Pages
納期: 2~3営業日
|

- 全表示
- 概要
- 目次
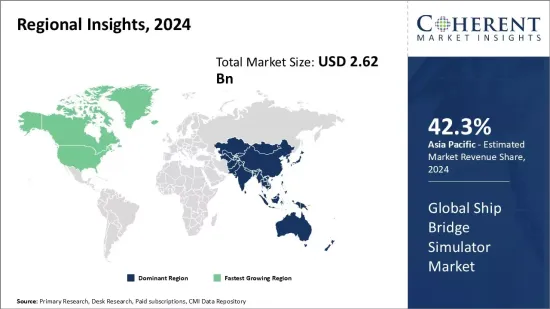
世界の船橋シミュレータ市場は、2024年には26億2,000万米ドルとなり、2031年までには43億米ドルに達すると予測され、2024年から2031年までのCAGRは7.3%を示しています。
| レポート範囲 | レポート詳細 | ||
|---|---|---|---|
| 基準年 | 2023年 | 2024年の市場規模 | 26億2,000万米ドル |
| 実績データ | 2019年~2023年 | 予測期間 | 2024年~2031年 |
| 予測期間(2024年~2031年)CAGR: | 7.30% | 2031年の金額予測 | 43億米ドル |
世界の船橋シミュレータ市場は、海洋専門家の訓練需要の増加により、ここ数年で勢いを増しています。船橋シミュレータとは、訓練や評価を目的として船橋の仮想環境を作り出すシステムを指します。これにより、訓練生は実際のリスクを負うことなく、さまざまな条件やシナリオで船舶を操作する実地経験を積むことができます。安全基準が重視され、実際の船舶に配備する前に船員を認証する必要性が高まっていることから、船橋シミュレーターの需要は世界的に大きく高まっています。シミュレーション技術の進歩により、最新の船橋シミュレータは、効果的な学習を支援する非常に現実的なシミュレーションを提供します。その使用により、船上での通常業務を中断することなく、船舶の専門家を訓練することができます。
市場力学
世界の船橋シミュレータ市場に影響を与える主要な促進要因としては、船員に対するシミュレータを用いた訓練の義務付けを定めた厳格な安全規制、有資格船員の需要を高める海上貿易活動の拡大、海事訓練機関や企業による高度なシミュレーションシステムの採用増加などが挙げられます。しかし、高度なブリッジシミュレータに関連する高い開発・保守コストが市場成長の妨げになる可能性があります。さらに、景気の不透明感から海運業界への投資が減少していることも課題となっています。しかし、低コストのシミュレータの開発と、既存のシミュレータのアップグレードへの関心の高まりは、今後数年間に大きな機会を提示します。シミュレータメーカーは、シミュレータベースのトレーニングの認知度向上に伴い、有利な展望を遂げると予想されます。
この調査の主要な特徴
この調査レポートは、世界の船橋シミュレータ市場を詳細に分析し、2023年を基準年とした予測期間(2024年~2031年)の市場規模および複合年間成長率(CAGR%)を掲載しています。
また、さまざまなセグメントにわたる潜在的な収益機会を解明し、この市場の魅力的な投資提案マトリックスについて解説しています。
また市場促進要因、抑制要因、機会、新製品の上市や承認、市場動向、地域別の展望、主要企業が採用する競争戦略などに関する主要考察も提供しています。
企業ハイライト、製品ポートフォリオ、主要なハイライト、業績、戦略などのパラメータに基づいて、世界の船橋シミュレータ市場の主要企業をプロファイルしています。
主要企業には、Kongsberg Maritime、Transas(Wartsila)、VSTEP、KONGSBERG Digital、Wartsila SAM Electronics、ARI Simulation、Buffalo Computer Graphics(BCG)、Force Technology、HR Wallingford、Indra Sistemasなどがあります。
このレポートからの洞察により、マーケティング担当者や企業の経営陣は、将来の製品発売、タイプアップ、市場拡大、マーケティング戦術に関する情報に基づいた意思決定を行うことができます。
この調査レポートは、投資家、サプライヤー、製品メーカー、流通業者、新規参入者、財務アナリストなど、この業界のさまざまな利害関係者を対象としています。
利害関係者は、世界の船橋シミュレータ市場の分析に使用される様々な戦略マトリックスを通じて、意思決定を容易にすることができます。
目次
第1章 調査目的と前提条件
- 調査目的
- 前提条件
- 略語
第2章 市場の展望
- レポートの説明
- 市場の定義と範囲
- エグゼクティブサマリー
- Coherent Opportunity Map(COM)
第3章 市場力学、規制、動向分析
- 市場力学
- 促進要因
- 抑制要因
- PEST分析
- PORTERのファイブフォース分析
- 市場機会
- 規制シナリオ
- 最近の動向/更新
- 業界動向
第4章 世界の船橋シミュレータ市場 - コロナウイルス(COVID-19)パンデミックの影響
- 世界の船橋シミュレータ市場に影響を与える要因 - COVID-19
- 影響分析
第5章 世界の船橋シミュレータ市場、ソリューションタイプ別、2024年~2031年(10億米ドル)
- インタラクティブな船橋シミュレーター
- 非インタラクティブな船橋シミュレータ
第6章 世界の船橋シミュレータ市場、最終用途産業別、2024年~2031年(10億米ドル)
- 海洋
- 教育
第7章 世界の船橋シミュレータ市場、地域別、2019年~2031年、金額(10億米ドル)
- 北米
- ラテンアメリカ
- 欧州
- アジア太平洋
- 中東
- アフリカ
第8章 競合情勢
- Kongsberg Maritime
- Transas(Wartsila)
- VSTEP
- KONGSBERG Digital
- Wartsila SAM Electronics
- ARI Simulation
- Buffalo Computer Graphics(BCG)
- Force Technology
- HR Wallingford
- Indra Sistemas
第9章 アナリストの推奨事項
- 運命の輪
- アナリストの見解
- Coherent Opportunity Map
第10章 参考文献と調査手法
- 参考文献
- 調査手法
Global ship bridge simulator market is estimated to be valued at USD 2.62 Billion in 2024 and is expected to reach USD 4.30 Billion by 2031, exhibiting a compound annual growth rate (CAGR) of 7.3% from 2024 to 2031.
| Report Coverage | Report Details | ||
|---|---|---|---|
| Base Year: | 2023 | Market Size in 2024: | US$ 2.62 Bn |
| Historical Data for: | 2019 To 2023 | Forecast Period: | 2024 To 2031 |
| Forecast Period 2024 to 2031 CAGR: | 7.30% | 2031 Value Projection: | US$ 4.30 Bn |
Global ship bridge simulator market has been gaining momentum over the past few years owing to the increasing demand for training marine professionals. A ship bridge simulator refers to a system that creates a virtual environment of a ship's bridge for training and assessment purposes. It enables trainees to gain hands-on experience of operating a vessel in different conditions and scenarios without any real risks. The growing emphasis on safety standards and need for certifying seafarers before deploying them on actual vessels has significantly propelled the demand for ship bridge simulators globally. With advances in simulation technologies, modern bridge simulators provide highly realistic simulations that aid in effective learning. Their usage allows training marine professionals without disrupting regular operations on-board.
Market Dynamics
The primary drivers influencing the global ship bridge simulator market include stringent safety regulations mandating simulator-based training for seafarers, growing seaborne trade activities raising the demand for qualified crews, and increasing adoption of advanced simulation systems by maritime training institutes and companies. However, high development and maintenance costs associated with sophisticated bridge simulators could hinder the market growth. Moreover, declining investments in the shipping industry due to economic uncertainties poses a challenge. But development of low-cost simulators and rising focus on upgrading existing simulators present significant opportunities in the coming years. The simulator manufacturers are anticipated to witness lucrative prospects with the growing recognition of simulator-based training.
Key Features of the Study
This report provides in-depth analysis of the global ship bridge simulator market, and provides market size (US$ Bn) and compound annual growth rate (CAGR%) for the forecast period (2024-2031), considering 2023 as the base year
It elucidates potential revenue opportunities across different segments and explains attractive investment proposition matrices for this market
This study also provides key insights about market drivers, restraints, opportunities, new product launches or approval, market trends, regional outlook, and competitive strategies adopted by key players
It profiles key players in the global ship bridge simulator market based on the following parameters - company highlights, products portfolio, key highlights, financial performance, and strategies
Key companies covered as a part of this study include Kongsberg Maritime, Transas (Wartsila), VSTEP, KONGSBERG Digital, Wartsila SAM Electronics, ARI Simulation, Buffalo Computer Graphics (BCG), Force Technology, HR Wallingford, and Indra Sistemas
Insights from this report would allow marketers and the management authorities of the companies to make informed decisions regarding their future product launches, type up-gradation, market expansion, and marketing tactics
The global ship bridge simulator market report caters to various stakeholders in this industry including investors, suppliers, product manufacturers, distributors, new entrants, and financial analysts
Stakeholders would have ease in decision-making through various strategy matrices used in analyzing the global ship bridge simulator market.
Market Segmentation
- Solution Type Insights (Revenue, USD, 2019 - 2031)
- Interactive Ship Bridge Simulators
- Non-interactive Ship Bridge Simulators
- End-use Industry Insights (Revenue, USD, 2019 - 2031)
- Marine
- Educational
- Regional Insights (Revenue, USD, 2019 - 2031)
- North America
- U.S.
- Canada
- Latin America
- Brazil
- Argentina
- Mexico
- Rest of Latin America
- Europe
- Germany
- U.K.
- Spain
- France
- Italy
- Russia
- Rest of Europe
- Asia Pacific
- China
- India
- Japan
- Australia
- South Korea
- ASEAN
- Rest of Asia Pacific
- Middle East
- GCC Countries
- Israel
- Rest of Middle East
- Africa
- South Africa
- North Africa
- Central Africa
- Key Players Insights
- Kongsberg Maritime
- Transas (Wartsila)
- VSTEP
- KONGSBERG Digital
- Wartsila SAM Electronics
- ARI Simulation
- Buffalo Computer Graphics (BCG)
- Force Technology
- HR Wallingford
- Indra Sistemas
Table of Contents
1. Research Objectives and Assumptions
- Research Objectives
- Assumptions
- Abbreviations
2. Market Purview
- Report Description
- Market Definition and Scope
- Executive Summary
- Market Snippet, By Solution Type
- Market Snippet, By End-use Industry
- Market Snippet, By Region
- Coherent Opportunity Map (COM)
3. Market Dynamics, Regulations, and Trends Analysis
- Market Dynamics
- Drivers
- Restraints
- PEST Analysis
- PORTER's Five Forces Analysis
- Market Opportunities
- Regulatory Scenario
- Recent Developments/ Updates
- Industry Trend
4. Global Ship Bridge Simulator Market - Impact of Coronavirus (COVID-19) Pandemic
- Overview
- Factors Affecting the Global Ship Bridge Simulator Market - COVID-19
- Impact Analysis
5. Global Ship Bridge Simulator Market, By Solution Type, 2024-2031, (USD BN )
- Introduction
- Market Share Analysis, 2024, 2027, and 2031 (%)
- Y-o-Y Growth Analysis, 2020 - 2031
- Segment Trends
- Interactive Ship Bridge Simulators
- Market Share Analysis, 2024, 2027, and 2031 (%)
- Y-o-Y Growth Analysis, 2020 - 2031
- Segment Trends
- Non-interactive Ship Bridge Simulators
- Market Share Analysis, 2024, 2027, and 2031 (%)
- Y-o-Y Growth Analysis, 2020 - 2031
- Segment Trends
6. Global Ship Bridge Simulator Market, By End-Use Industry, 2024-2031, (USD BN)
- Introduction
- Market Share Analysis, 2024, 2027, and 2031 (%)
- Y-o-Y Growth Analysis, 2020 - 2031
- Segment Trends
- Marine
- Market Share Analysis, 2024, 2027, and 2031 (%)
- Y-o-Y Growth Analysis, 2020 - 2031
- Segment Trends
- Educational
- Market Share Analysis, 2024, 2027, and 2031 (%)
- Y-o-Y Growth Analysis, 2020 - 2031
- Segment Trends
7. Global Ship Bridge Simulator Market, By Region, 2019 - 2031, Value (USD BN)
- Introduction
- Market Share Analysis, By Region, 2024, 2027, and 2031 (%)
- Y-o-Y Growth Analysis, For Region, 2020 - 2031
- North America
- Market Share Analysis, By Country, 2024, 2027 and 2031 (%)
- Y-o-Y Growth Analysis, For Region, 2020 - 2031
- Market Size and Forecast, By Solution Type, 2019- 2031, (US$ Bn)
- Market Size and Forecast, By End Use Industry, 2019- 2031, (US$ Bn)
- Market Size and Forecast, By Distribution Channel, 2019- 2031, (US$ Bn)
- Market Size and Forecast, By Country, 2019- 2031, (US$ Bn)
- U.S.
- Canada
- Latin America
- Market Share Analysis, By Country, 2024, 2027 and 2031 (%)
- Y-o-Y Growth Analysis, For Region, 2020 - 2031
- Market Size and Forecast, By Solution Type, 2019- 2031, (US$ Bn)
- Market Size and Forecast, By End Use Industry, 2019- 2031, (US$ Bn)
- Market Size and Forecast, By Distribution Channel, 2019- 2031, (US$ Bn)
- Market Size and Forecast, By Country, 2019- 2031, (US$ Bn)
- Brazil
- Argentina
- Mexico
- Rest of Latin America
- Europe
- Market Share Analysis, By Country, 2024, 2027 and 2031 (%)
- Y-o-Y Growth Analysis, For Region, 2020 - 2031
- Market Size and Forecast, By Solution Type, 2019- 2031, (US$ Bn)
- Market Size and Forecast, By End Use Industry, 2019- 2031, (US$ Bn)
- Market Size and Forecast, By Country, 2019- 2031, (US$ Bn)
- U.K.
- Germany
- Italy
- France
- Spain
- Russia
- Rest of Europe
- Asia Pacific
- Market Share Analysis, By Country, 2024, 2027 and 2031 (%)
- Y-o-Y Growth Analysis, For Region, 2020 - 2031
- Market Size and Forecast, By Solution Type, 2019- 2031, (US$ Bn)
- Market Size and Forecast, By End Use Industry, 2019- 2031, (US$ Bn)
- Market Size and Forecast, By Country, 2019- 2031, (US$ Bn)
- China
- India
- Japan
- ASEAN
- Australia
- South Korea
- Rest of Asia Pacific
- Middle East
- Market Share Analysis, By Country, 2024, 2027 and 2031 (%)
- Y-o-Y Growth Analysis, For Region, 2020 - 2031
- Market Size and Forecast, By Solution Type, 2019- 2031, (US$ Bn)
- Market Size and Forecast, By End Use Industry, 2019- 2031, (US$ Bn)
- Market Size and Forecast, By Country, 2019- 2031, (US$ Bn)
- GCC Countries
- Israel
- Rest of Middle East
- Africa
- Market Share Analysis, By Country, 2024, 2027 and 2031 (%)
- Y-o-Y Growth Analysis, For Region, 2020 - 2031
- Market Size and Forecast, By Solution Type, 2019- 2031, (US$ Bn)
- Market Size and Forecast, By End Use Industry, 2019- 2031, (US$ Bn)
- Market Size and Forecast, By Country/Region, 2019- 2031, (US$ Bn)
- South Africa
- North Africa
- Central Africa
8. Competitive Landscape
- Kongsberg Maritime
- Company Overview
- Product Portfolio
- Recent Developments/ Updates
- Transas (Wartsila)
- Company Overview
- Product Portfolio
- Recent Developments/ Updates
- VSTEP
- Company Overview
- Product Portfolio
- Recent Developments/ Updates
- KONGSBERG Digital
- Company Overview
- Product Portfolio
- Recent Developments/ Updates
- Wartsila SAM Electronics
- Company Overview
- Product Portfolio
- Recent Developments/ Updates
- ARI Simulation
- Company Overview
- Product Portfolio
- Recent Developments/ Updates
- Buffalo Computer Graphics (BCG)
- Company Overview
- Product Portfolio
- Recent Developments/ Updates
- Force Technology
- Company Overview
- Product Portfolio
- Recent Developments/ Updates
- HR Wallingford
- Company Overview
- Product Portfolio
- Recent Developments/ Updates
- Indra Sistemas
- Company Overview
- Product Portfolio
- Recent Developments/ Updates
9. Analyst Recommendations
- Wheel of Fortune
- Analyst View
- Coherent Opportunity Map
10. References and Research Methodology
- References
- Research Methodology
- About us