
|
市場調査レポート
商品コード
1708820
排出権取引市場:取引タイプ別、最終用途別、地域別Emissions Trading Market, By Type Of Trading, By End Use, By Geography |
||||||
カスタマイズ可能
|
|||||||
| 排出権取引市場:取引タイプ別、最終用途別、地域別 |
|
出版日: 2025年03月04日
発行: Coherent Market Insights
ページ情報: 英文 172 Pages
納期: 2~3営業日
|

全表示
- 概要
- 目次
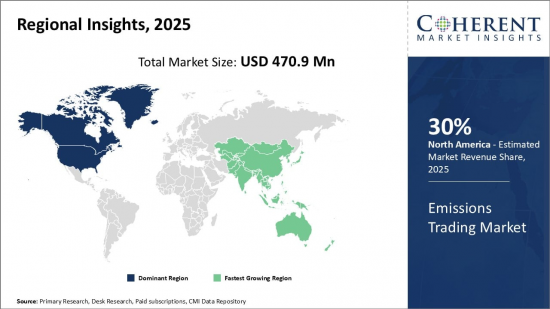
世界の排出権取引市場は、2025年には4億7,090万米ドルと推定され、2032年には15億5,410万米ドルに達すると予測され、2025~2032年のCAGRは18.6%で成長する見込みです。
| レポート範囲 | レポート詳細 | ||
|---|---|---|---|
| 基準年 | 2024年 | 2025年の市場規模 | 4億7,090万米ドル |
| 実績データ | 2020~2024年 | 予測期間 | 2025~2032年 |
| 予測期間:2025~2032年のCAGR | 18.60% | 2032年の金額予測 | 15億5,410万米ドル |
キャップアンドトレードとしても知られる排出権取引は、温室効果ガス排出を制御するための市場ベースのアプローチです。排出権取引は、特定の産業や地域から排出される温室効果ガスの総量に上限を設定することを前提に運営されます。企業には、許容排出量に応じた排出枠が割り当てられます。企業が割り当てられた排出量を下回って排出した場合、その企業は排出枠を超える他の企業に余剰排出枠を売却することができます。この制度は、排出目標達成のための柔軟性を提供すると同時に、企業がコンプライアンスを維持しようと努力することで、排出削減のインセンティブを与えます。排出権取引は、気候変動に対処し、産業間の協力を促進し、よりクリーンな技術への投資を促す重要な手段として、世界的に脚光を浴びています。
排出権取引市場は、環境問題への関心の高まりと気候変動対策への国際的な取り組みに後押しされ、近年著しい成長を遂げています。欧州連合(EU)、中国、米国の一部を含むさまざまな地域で、温室効果ガスの排出を効果的に規制するための排出権取引制度が導入されています。さらに、自主的な炭素市場が登場し、企業や個人が自主的に二酸化炭素排出量を相殺できるようになりました。炭素排出量の削減に取り組む国や企業が増えるにつれ、排出権取引市場は拡大を続け、より持続可能で気候変動に配慮した未来に向けた世界の移行において重要な役割を果たすことになると考えられます。
欧州連合排出権取引制度(EU ETS)は世界最大の炭素市場であり、世界の炭素クレジット取引量の約90%を占めています。EUは2030年までに温室効果ガス排出量を55%削減することを約束しており、EU ETSは今後も成長を続けると予想されています。
市場力学
環境問題や気候変動の緩和、規制の遵守、国際的なコミットメントが、予測期間中の世界の排出権取引市場の成長を促進すると予想されます。さらに、経済効率と費用対効果、クリーン技術と技術革新の促進も、予測期間における排出権取引市場の成長を後押しすると予想されます。排出権取引制度の拡大、排出権取引制度の連結、新たな温室効果ガスの追加、ネットゼロ目標のための市場ベースのソリューションは、予測期間中、排出権取引市場に成長機会をもたらすと予想されます。
しかし、政治的・施策的不確実性、不十分な厳格性、市場操作、価格変動が、予測期間中の排出権取引市場の成長を妨げると予想されます。
本調査の主要特徴
- 本レポートは、排出権取引市場を詳細に分析し、2024年を基準年とした予測期間(2025~2032年)の市場規模と複合年間成長率(CAGR)を記載しています。
- また、さまざまなセグメントにわたる潜在的な収益機会を明らかにし、この市場の魅力的な投資提案マトリックスについて解説しています。
- また、市場の促進要因、抑制要因、機会、新製品の発売や承認、市場動向、地域による展望、主要企業が採用する競争戦略などに関する重要な考察も提供しています。
- 企業ハイライト、製品ポートフォリオ、主要なハイライト、財務実績、戦略などのパラメータに基づいて、排出権取引市場の主要企業をプロファイルしています。
- 本レポートは、投資家、サプライヤー、製品メーカー、流通業者、新規参入者、財務アナリストなど、この産業の様々な利害関係者を対象としています。
- 利害関係者は、排出権取引市場分析に使用される様々な戦略マトリックスを通じて、意思決定が容易になります。
目次
第1章 調査の目的と前提条件
- 調査目的
- 前提条件
- 略語
第2章 市場展望
- レポートの説明
- 市場の定義と範囲
- エグゼクティブサマリー
- 一貫型機会マップ(COM)
第3章 市場力学、規制、動向分析
- 市場力学
- 環境問題と気候変動の緩和
- 規制遵守と国際的な約束
- 経済効率と費用対効果
- クリーン技術とイノベーションの促進
- 大規模排出国の取り組み不足
- 排出枠の無償割り当ての普及
- 炭素漏出リスク
- 排出量取引制度の拡大
- 排出量取引制度の連携
- 新たな温室効果ガスの追加
- ネットゼロ目標に向けた市場ベースのソリューション
- 規制シナリオ
- 製品の発売/承認
- PEST分析
- ポーター分析
- 合併、買収、提携
第4章 排出量取引市場、取引タイプ別、2020~2032年
- イントロダクション
- キャップアンドトレード
- ベースラインとクレジット
第5章 排出量取引市場、用途別、2020~2032年
- イントロダクション
- エネルギー
- 発電
- 産業
- 輸送
- 農業
第6章 排出量取引市場、地域別、2020~2032年
- イントロダクション
- 北米
- 欧州
- アジア太平洋
- ラテンアメリカ
- 中東・アフリカ
第7章 競合情勢
- 企業プロファイル
- BP Plc.
- Royal Dutch Shell Plc
- Total SE
- Chevron Corporation
- ExxonMobil Corporation
- Engie SA
- RWE AG
- ON SE
- Vattenfall AB
- Gazprom
- Mitsubishi UFJ Financial Group(MUFG)
- JPMorgan Chase & Co.
- Goldman Sachs Group, Inc.
- Citigroup Inc.
- Barclays PLC
第8章 セクション
- 参考文献
- 調査手法
- 出版社について
Global Emissions Trading Market is estimated to be valued at USD 470.9 Mn in 2025 and is expected to reach USD 1,554.1 Mn by 2032, growing at a compound annual growth rate (CAGR) of 18.6% from 2025 to 2032.
| Report Coverage | Report Details | ||
|---|---|---|---|
| Base Year: | 2024 | Market Size in 2025: | USD 470.9 Mn |
| Historical Data for: | 2020 To 2024 | Forecast Period: | 2025 To 2032 |
| Forecast Period 2025 to 2032 CAGR: | 18.60% | 2032 Value Projection: | USD 1,554.1 Mn |
Emissions trading, also known as cap-and-trade, is a market-based approach to controlling greenhouse gas emissions. It operates under the premise of setting a cap on the total allowable emissions from specific industries or regions. Companies are allocated emission allowances corresponding to their permitted emission levels. If a company emits below its allotted amount, it can sell the surplus allowances to other companies exceeding their emissions limits. This system incentivizes emissions reductions as companies strive to maintain compliance while providing flexibility in achieving emission targets. Emissions trading has gained prominence globally as a crucial tool in addressing climate change, fostering cooperation among industries, and encouraging investment in cleaner technologies.
The emissions trading market has witnessed significant growth in recent years, spurred by mounting environmental concerns and international efforts to combat climate change. Various regions, including the European Union, China, and parts of the U.S., have implemented emissions trading systems to regulate greenhouse gas emissions effectively. Additionally, the voluntary carbon market has emerged, enabling businesses and individuals to offset their carbon footprint voluntarily. As more countries and companies commit to reducing their carbon emissions, the emissions trading market is likely to continue expanding, playing a vital role in the global transition towards a more sustainable and climate-conscious future.
The European Union Emissions Trading System (EU ETS) is the largest carbon market in the world, accounting for around 90% of global carbon credit trading volume. The EU ETS is expected to continue to grow in the coming years, as the European Union commits to reducing its greenhouse gas emissions by 55% by 2030.
Market Dynamics:
Environmental concerns and climate change mitigation, regulatory compliance and international commitments are anticipated to drive growth of the global emissions trading market over the forecast period. Moreover, economic efficiency and cost-effectiveness, stimulating clean technologies and innovation is also expected to boost the growth of the emissions trading market over the forecast period. Expansion of emissions trading schemes, linking emissions trading systems, inclusion of new greenhouse gases, and market-based solutions for net-zero goals are expected to create growth opportunities for the emissions trading market during the forecast period.
However, political and policy uncertainty, insufficient stringency, market manipulation and price volatility are expected to hamper growth of the emissions trading market over the forecast period.
Key features of the study:
- This report provides in-depth analysis of the emissions trading market, and provides market size (US$ Mn) and compound annual growth rate (CAGR %) for the forecast period (2025-2032), considering 2024 as the base year.
- It elucidates potential revenue opportunities across different segments and explains attractive investment proposition matrices for this market.
- This study also provides key insights about market drivers, restraints, opportunities, new product launches or approval, market trends, regional outlook, and competitive strategies adopted by key players.
- It profiles key players in the emissions trading market based on the following parameters - company highlights, products portfolio, key highlights, financial performance, and strategies.
- Key companies covered as a part of this study include BP Plc., Royal Dutch Shell Plc., Total SE, Chevron Corporation, ExxonMobil Corporation, Engie SA, RWE AG, EON SE, Vattenfall AB, Gazprom, Mitsubishi UFJ Financial Group (MUFG), JPMorgan Chase & Co., Goldman Sachs Group, Inc. Citigroup Inc., and Barclays PLC Insights from this report would allow marketers and the management authorities of the companies to make informed decisions regarding their future product launches, type up-gradation, market expansion, and marketing tactics.
- The emissions trading market report caters to various stakeholders in this industry including investors, suppliers, product manufacturers, distributors, new entrants, and financial analysts.
- Stakeholders would have ease in decision-making through various strategy matrices used in analyzing the emissions trading market.
Detailed Segmentation:
- Emissions Trading Market Segmentation, By Trading Type:
- Cap-and-Trade
- Baseline-and-Credit
- Emissions Trading Market Segmentation, By End Use:
- Energy
- Power Generation
- Industrial
- Transportation
- Agriculture
- Emissions Trading Market Segmentation, By Region:
- North America
- Europe
- Asia Pacific
- Latin America
- Middle East
- Africa
- Company Profiles
- BP Plc.
- Royal Dutch Shell Plc.
- Total SE
- Chevron Corporation
- ExxonMobil Corporation
- Engie SA
- RWE AG
- ON SE
- Vattenfall AB
- Gazprom
- Mitsubishi UFJ Financial Group (MUFG)
- JPMorgan Chase & Co
- Citigroup Inc.
- Barclays PLC
- Goldman Sachs Group, Inc.
Table of Contents
1. Research Objectives and Assumptions
- Research Objectives
- Assumptions
- Abbreviations
2. Market Purview
- Report Description
- Market Definition and Scope
- Executive Summary
- Emissions Trading Market, By Trading Type
- Emissions Trading Market, By End Use
- Emissions Trading Market, By Region
- Coherent Opportunity Map (COM)
3. Market Dynamics, Regulations, and Trends Analysis
- Market Dynamics
- Drivers
- Environmental concerns and climate change mitigation
- Regulatory compliance and international commitments
- Economic efficiency and cost-effectiveness
- Stimulating clean technologies and innovation
- Restraints
- Lack of commitment by large emitters
- Prevalence of free allocation of emissions allowances
- Carbon leakage risk
- Opportunities
- Expansion of emissions trading schemes
- Linking emissions trading systems
- Inclusion of new greenhouse gases
- Market-based solutions for net-Zero goals
- Key Highlights
- Regulatory Scenario
- Recent Trends
- Product Launches/Approvals
- PEST Analysis
- PORTER's Analysis
- Mergers, Acquisitions, and Collaborations
4. Emissions Trading Market, By Trading Type, 2020-2032, (US$ Mn)
- Introduction
- Market Share Analysis, 2025 and 2032 (%)
- Y-o-Y Growth Analysis, 2021 - 2032
- Segment Trends
- Cap-and-Trade
- Introduction
- Market Size and Forecast, and Y-o-Y Growth, 2020-2032,(US$ Mn)
- Baseline-and-Credit
- Introduction
- Market Size and Forecast, and Y-o-Y Growth, 2020-2032,(US$ Mn)
5. Emissions Trading Market, By End Use, 2020-2032, (US$ Mn)
- Introduction
- Market Share Analysis, 2025 and 2032 (%)
- Y-o-Y Growth Analysis, 2021 - 2032
- Segment Trends
- Energy
- Introduction
- Market Size and Forecast, and Y-o-Y Growth, 2020-2032, (US$ Million)
- Power Generation
- Introduction
- Market Size and Forecast, and Y-o-Y Growth, 2020-2032, (US$ Million)
- Industrial
- Introduction
- Market Size and Forecast, and Y-o-Y Growth, 2020-2032, (US$ Million)
- Transportation
- Introduction
- Market Size and Forecast, and Y-o-Y Growth, 2020-2032, (US$ Million)
- Agriculture
- Introduction
- Market Size and Forecast, and Y-o-Y Growth, 2020-2032, (US$ Million)
6. Emission Trading Market, By Region, 2020-2032, (US$ Mn)
- Introduction
- Market Share Analysis, By Sub-region, 2025 and 2032 (%)
- Y-o-Y Growth Analysis, For Sub-region, 2021 - 2032
- Segment Trends
- North America
- Introduction
- Market Size and Forecast, and Y-o-Y Growth, By Trading Type , 2020-2032,(US$ Mn)
- Market Size and Forecast, and Y-o-Y Growth, By End Use, 2020-2032,(US$ Mn)
- Market Size and Forecast, and Y-o-Y Growth, By Country, 2020-2032,(US$ Mn)
- U.S.
- Canada
- Europe
- Introduction
- Market Size and Forecast, and Y-o-Y Growth, By Trading Type , 2020-2032,(US$ Mn)
- Market Size and Forecast, and Y-o-Y Growth, By End Use, 2020-2032,(US$ Mn)
- Market Size and Forecast, and Y-o-Y Growth, By Country, 2020-2032,(US$ Mn)
- Germany
- U.K.
- Spain
- France
- Italy
- Russia
- Rest of Europe
- Asia Pacific
- Introduction
- Market Size and Forecast, and Y-o-Y Growth, By Trading Type , 2020-2032,(US$ Mn)
- Market Size and Forecast, and Y-o-Y Growth, By End Use, 2020-2032,(US$ Mn)
- Market Size and Forecast, and Y-o-Y Growth, By Country, 2020-2032,(US$ Mn)
- China
- India
- Japan
- Australia
- South Korea
- ASEAN
- Rest of Asia Pacific
- Latin America
- Introduction
- Market Size and Forecast, and Y-o-Y Growth, By Trading Type , 2020-2032,(US$ Mn)
- Market Size and Forecast, and Y-o-Y Growth, By End Use, 2020-2032,(US$ Mn)
- Market Size and Forecast, and Y-o-Y Growth, By Country, 2020-2032,(US$ Mn)
- Brazil
- Argentina
- Mexico
- Rest of Latin America
- Middle East & Africa
- Introduction
- Market Size and Forecast, and Y-o-Y Growth, By Trading Type , 2020-2032,(US$ Mn)
- Market Size and Forecast, and Y-o-Y Growth, By End Use, 2020-2032,(US$ Mn)
- Market Size and Forecast, and Y-o-Y Growth, By Country, 2020-2032,(US$ Mn)
- GCC Countries
- Israel
- South Africa
- North Africa
- Central Africa
- Rest of Middle East
7. Competitive Landscape
- Company Profile
- BP Plc.
- Company Highlights
- Product Portfolio
- Key Developments
- Financial Performance
- Strategies
- Royal Dutch Shell Plc
- Company Highlights
- Product Portfolio
- Key Highlights
- Financial Performance
- Strategies
- Total SE
- Company Highlights
- Product Portfolio
- Key Highlights
- Financial Performance
- Strategies
- Chevron Corporation
- Company Highlights
- Product Portfolio
- Key Highlights
- Financial Performance
- Strategies
- ExxonMobil Corporation
- Company Highlights
- Product Portfolio
- Key Highlights
- Financial Performance
- Strategies
- Engie SA
- Company Highlights
- Product Portfolio
- Key Highlights
- Financial Performance
- Strategies
- RWE AG
- Company Highlights
- Product Portfolio
- Key Highlights
- Financial Performance
- Strategies
- ON SE
- Company Highlights
- Product Portfolio
- Key Highlights
- Financial Performance
- Strategies
- Vattenfall AB
- Company Highlights
- Product Portfolio
- Key Highlights
- Financial Performance
- Strategies
- Gazprom
- Company Highlights
- Product Portfolio
- Key Highlights
- Financial Performance
- Strategies
- Mitsubishi UFJ Financial Group (MUFG)
- Company Highlights
- Product Portfolio
- Key Highlights
- Financial Performance
- Strategies
- JPMorgan Chase & Co.
- Company Highlights
- Product Portfolio
- Key Highlights
- Financial Performance
- Strategies
- Goldman Sachs Group, Inc.
- Company Highlights
- Product Portfolio
- Key Highlights
- Financial Performance
- Strategies
- Citigroup Inc.
- Company Highlights
- Product Portfolio
- Key Highlights
- Financial Performance
- Strategies
- Barclays PLC
- Company Highlights
- Product Portfolio
- Key Highlights
- Financial Performance
- Strategies
- Analyst Views
8. Section
- References
- Research Methodology
- About us

