
|
市場調査レポート
商品コード
1708780
グリーンエネルギー市場:製品タイプ別、エンドユーザー別、地域別Green Energy Market, By Product Type, By End User, By Geography |
||||||
カスタマイズ可能
|
|||||||
| グリーンエネルギー市場:製品タイプ別、エンドユーザー別、地域別 |
|
出版日: 2025年03月03日
発行: Coherent Market Insights
ページ情報: 英文 130 Pages
納期: 2~3営業日
|

全表示
- 概要
- 目次
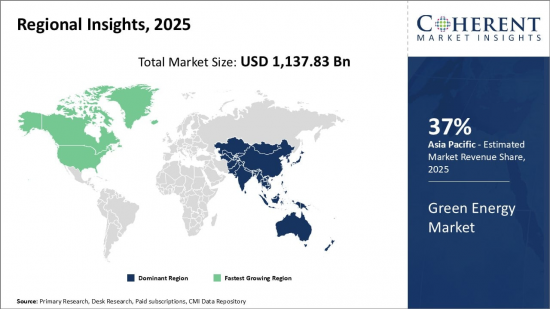
世界のグリーンエネルギー市場は、2025年には1兆1,378億3,000万米ドルと推定され、2032年には2兆8,471億5,000万米ドルに達すると予測され、2025~2032年までの年間平均成長率(CAGR)は14.0%で成長すると予測されています。
| レポート範囲 | レポート詳細 | ||
|---|---|---|---|
| 基準年 | 2024年 | 2025年の市場規模 | 1兆1,378億3,000万米ドル |
| 実績データ | 2020~2024年 | 予測期間 | 2025~2032年 |
| 予測期間:2025~2032年のCAGR | 14.00% | 2032年の金額予測 | 2兆8,471億5,000万米ドル |
世界のグリーンエネルギー市場は、近年2021年に大きな成長を遂げており、2025~2032年までの予測期間中も安定した成長が見込まれています。気候変動の影響増大による環境問題の高まり、クリーンエネルギーの利用を促進する政府の支持的な施策と施策、化石燃料と比較した再生可能技術のコスト低下といった要因が、このセグメントの成長に寄与しています。大手企業は、再生可能エネルギー発電をより効率的でコスト競合ものにするため、研究開発(R&D)に多額の投資を行っています。太陽光発電、風力発電、水力発電など、クリーンで再生可能なエネルギー源からエネルギーを利用することで、大きな進展が見られています。こうした開発は、グリーン技術ソリューションの需要を促進すると予想されます。しかし、再生可能資源が断続的に利用可能であることは課題であり、グリッド・パリティを達成するためには対処が必要です。
市場力学
市場の促進要因としては、環境意識の高まり、政府の施策と規制、再生可能技術のコスト低下などが挙げられます。世界中の様々な政府によって設定された厳しい環境規範と二酸化炭素排出削減目標が、再生可能電力への投資を促進しています。免税、固定価格買取制度、再生可能エネルギー買取義務などの規制施策が、再生可能エネルギー容量の増加を促しています。太陽光発電モジュールや風力タービンのコストは大幅に低下しており、多くの場所で再生可能エネルギーの価格は化石燃料と競合を持つようになっています。しかし、初期設備投資が高く、再生可能資源が断続的であることが、普及の課題となっています。蓄電池システムの技術的進歩は、間欠性の問題を解決し、エネルギーミックスにおける再生可能エネルギーの普及を拡大する大きな機会を記載しています。
本調査の主要特徴
- 当レポートでは、市場を詳細に分析し、2024年を基準年とした予測期間(2025~2032年)の市場規模と複合年間成長率(CAGR)を掲載しています。
- さまざまなセグメントにわたる潜在的な収益成長機会を解明し、この市場の魅力的な投資提案マトリクスを解説しています。
- また、市場の促進要因、抑制要因、機会、新製品の上市や承認、市場動向、地域による展望、主要企業が採用する競争戦略などに関する重要な考察も提供しています。
- 本レポートでは、企業ハイライト、製品ポートフォリオ、主要ハイライト、財務実績、戦略などのパラメータに基づいて、市場の主要企業プロファイルを掲載しています。
- このレポートから洞察により、マーケティング担当者や企業の経営陣は、将来の製品発売、タイプアップ、市場拡大、マーケティング戦術に関して、情報に基づいた意思決定を行うことができます。
- この市場レポートは、投資家、サプライヤー、製品メーカー、流通業者、新規参入者、財務アナリストなど、この産業の様々な利害関係者を対象としています。
- 市場分析に使用される様々な戦略マトリックスを通じて、利害関係者の意思決定が容易になります。
目次
第1章 調査の目的と前提条件
- 調査目的
- 前提条件
- 略語
第2章 市場展望
- レポートの説明
- 市場の定義と範囲
- エグゼクティブサマリー
- 一貫型機会マップ(COM)
第3章 市場力学、規制、動向分析
- 市場力学
- 促進要因
- 政府の施策とインセンティブ
- 高まる環境問題
- 発展途上国の未開拓の潜在力
- 抑制要因
- 初期投資とインフラコストが高い
- 再生可能エネルギー源の間欠性
- 機会
- 研究開発への投資の増加
- グリーン電力の新興市場
- 農村電化の余地
- 規制シナリオ
- 製品の発売/承認
- PEST分析
- ポーター分析
- 合併、買収、提携
第4章 世界のグリーンエネルギー市場-コロナウイルス(COVID-19)パンデミックの影響
- COVID-19疫学
- 供給側と需要側の分析
- 経済への影響
第5章 世界のグリーンエネルギー市場、製品タイプ別、2020~2032年
- イントロダクション
- 太陽光発電
- 風力エネルギー
- 水力発電
- バイオ燃料
- 地熱エネルギー
第6章 世界のグリーンエネルギー市場、エンドユーザー別、2020~2032年
- イントロダクション
- 家庭用
- 業務用
- 産業用
第7章 世界のグリーンエネルギー市場、地域別、2020~2032年
- イントロダクション
- 北米
- 欧州
- アジア太平洋
- ラテンアメリカ
- 中東
- アフリカ
第8章 競合情勢
- 企業プロファイル
- ABB Ltd.
- Alterra Power Corporation
- Kyocera Solar, Inc.
- Nordex SE
- Hanwha Q Cells GmbH
- Sharp Corporation
- Calpine Corporation
- Suzlon Energy Ltd.
- S. Geothermal Inc.
- Yingli Green Energy Holding Co. Ltd.
- Enercon GmbH
- GE Energy
第9章 セクション
- 参考文献
- 調査手法
- 出版社について
Global Green Energy Market is estimated to be valued at USD 1,137.83 Bn in 2025 and is expected to reach USD 2,847.15 Bn by 2032, growing at a compound annual growth rate (CAGR) of 14.0% from 2025 to 2032.
| Report Coverage | Report Details | ||
|---|---|---|---|
| Base Year: | 2024 | Market Size in 2025: | USD 1,137.83 Bn |
| Historical Data for: | 2020 To 2024 | Forecast Period: | 2025 To 2032 |
| Forecast Period 2025 to 2032 CAGR: | 14.00% | 2032 Value Projection: | USD 2,847.15 Bn |
Global green energy market has witnessed significant growth in 2021 recent years and is expected to grow steadily during the forecast period from 2025 to 2032. Factors such as rising environmental concerns due to the increasing effects of climate change, supportive government policies and regulations promoting the use of clean energy, and declining costs of renewable technologies compared to fossil fuels have contributed to the growth of this sector. Major players are investing heavily in research and development (R&D) to make renewable power generation more efficient and cost-competitive. Significant progress has been made in harnessing energy from clean and renewable sources such as solar, wind, hydropower, and others. These developments are expected to drive the demand for green technology solutions. However, intermittent availability of renewable resources poses challenges and needs to be addressed to achieve grid parity.
Market Dynamics:
The key drivers propelling the market include growing environmental awareness, supportive government policies and regulations, and declining costs of renewable technologies. Stringent environmental norms and carbon emission reduction targets set by various governments across the globe are driving investments in renewable power. Regulatory policies including tax exemptions, feed-in tariffs, and renewable purchase obligations have encouraged renewable capacity addition. The costs of solar PV modules and wind turbines have declined substantially, thus making renewable energy prices competitive with fossil fuels in many places. However, high initial capital investments and intermittent nature of renewable resources act as challenges for widespread adoption. Technological advancements in battery storage systems provide significant opportunities to address the intermittency issue and scale up renewable penetration in the energy mix.
Key Features of the Study:
- This report provides an in-depth analysis of the market, and provides market size (US$ Bn) and compound annual growth rate (CAGR %) for the forecast period (2025-2032), considering 2024 as the base year.
- It elucidates potential revenue growth opportunities across different segments and explains attractive investment proposition matrices for this market.
- This study also provides key insights about market drivers, restraints, opportunities, new product launches or approvals, market trends, regional outlook, and competitive strategies adopted by key players.
- It profiles key players in the market based on the following parameters - company highlights, products portfolio, key highlights, financial performance, and strategies.
- Key companies covered as a part of this study include -ABB Ltd., Alterra Power Corporation, Kyocera Solar, Inc., Nordex SE, Hanwha Q Cells GmbH, Sharp Corporation, Calpine Corporation, Suzlon Energy Ltd., U.S. Geothermal Inc., Yingli Green Energy Holding Co. Ltd., Enercon GmbH, and GE Energy.
- Insights from this report would allow marketers and the management authorities of the companies to make informed decisions regarding their future product launches, type up gradation, market expansion, and marketing tactics.
- The market report caters to various stakeholders in this industry including investors, suppliers, product manufacturers, distributors, new entrants, and financial analysts.
- Stakeholders would have ease in decision-making through various strategy matrices used in analyzing the market.
Global Green Energy Market Detailed Segmentation:
- By Product Type
- Solar photovoltaic
- Wind energy
- Hydroelectric power
- Biofuels
- Geothermal energy
- By End User
- Residential
- Commercial
- Industrial
- By Region
- North America
- Europe
- Asia Pacific
- Latin America
- Middle East
- Africa
- Company Profiles
- ABB Ltd.
- Alterra Power Corporation
- Kyocera Solar, Inc.
- Nordex SE
- Hanwha Q Cells GmbH
- Sharp Corporation
- Calpine Corporation
- Suzlon Energy Ltd.
- U.S. Geothermal Inc.
- Yingli Green Energy Holding Co. Ltd.
- Enercon GmbH
- GE Energy
Table of Contents
1. Research Objectives and Assumptions
- Research Objectives
- Assumptions
- Abbreviations
2. Market Purview
- Report Description
- Market Definition and Scope
- Executive Summary
- Market Snippet, By Product Type
- Market Snippet, By End User
- Market Snippet, By Region
- Coherent Opportunity Map (COM)
3. Market Dynamics, Regulations, and Trends Analysis
- Market Dynamics
- Drivers
- Government policies and incentives
- Growing environmental concerns
- Untapped potential in developing nations
- Restraints
- High initial investments and infrastructure costs
- Intermittency in renewable sources
- Opportunities
- Increasing investment in research and development
- Emerging markets for green electricity
- Scope for rural electrification
- Key Highlights
- Regulatory Scenario
- Recent Trends
- Product Launches/Approvals
- PEST Analysis
- PORTER's Analysis
- Mergers, Acquisitions, and Collaborations
4. Global Green Energy Market - Impact of Coronavirus (COVID-19) Pandemic
- COVID-19 Epidemiology
- Supply Side and Demand Side Analysis
- Economic Impact
5. Global Green Energy Market, By Product Type, 2020-2032, (US$ Bn)
- Introduction
- Market Share Analysis, 2025-2032(%)
- Y-o-Y Growth Analysis, 2021- 2032
- Segment Trends
- Solar photovoltaic
- Introduction
- Market Size and Forecast, and Y-o-Y Growth, 2020-2032,(US$ Bn)
- Wind energy
- Introduction
- Market Size and Forecast, and Y-o-Y Growth, 2020-2032,(US$ Bn)
- Hydroelectric power
- Introduction
- Market Size and Forecast, and Y-o-Y Growth, 2020-2032,(US$ Bn)
- Biofuels
- Introduction
- Market Size and Forecast, and Y-o-Y Growth, 2020-2032,(US$ Bn)
- Geothermal energy
- Introduction
- Market Size and Forecast, and Y-o-Y Growth, 2020-2032,(US$ Bn)
6. Global Green Energy Market, By End User, 2020-2032, (US$ Bn)
- Introduction
- Market Share Analysis, 2025-2032(%)
- Y-o-Y Growth Analysis, 2021-2032
- Segment Trends
- Residential
- Introduction
- Market Size and Forecast, and Y-o-Y Growth, 2020-2032,(US$ Bn)
- Commercial
- Introduction
- Market Size and Forecast, and Y-o-Y Growth, 2020-2032,(US$ Bn)
- Industrial
- Introduction
- Market Size and Forecast, and Y-o-Y Growth, 2020-2032,(US$ Bn)
7. Global Green Energy Market, By Region, 2020-2032, (US$ Bn)
- Introduction
- Market Share Analysis, By Region, 2025-2032(%)
- Y-o-Y Growth Analysis, For Region, 2021 - 2032
- Country Trends
- North America
- Introduction
- Market Size and Forecast, and Y-o-Y Growth, By Product Type, 2020-2032,(US$ Bn)
- Market Size and Forecast, and Y-o-Y Growth, By End User, 2020-2032,(US$ Bn)
- Market Size and Forecast, and Y-o-Y Growth, By Country, 2020-2032,(US$ Bn)
- U.S.
- Canada
- Europe
- Introduction
- Market Size and Forecast, and Y-o-Y Growth, By Product Type, 2020-2032,(US$ Bn)
- Market Size and Forecast, and Y-o-Y Growth, By End User, 2020-2032,(US$ Bn)
- Market Size and Forecast, and Y-o-Y Growth, By Country, 2020-2032,(US$ Bn)
- Germany
- U.K.
- Spain
- France
- Italy
- Russia
- Rest of Europe
- Asia Pacific
- Introduction
- Market Size and Forecast, and Y-o-Y Growth, By Product Type, 2020-2032,(US$ Bn)
- Market Size and Forecast, and Y-o-Y Growth, By End User, 2020-2032,(US$ Bn)
- Market Size and Forecast, and Y-o-Y Growth, By Country, 2020-2032,(US$ Bn)
- China
- India
- Japan
- Australia
- South Korea
- ASEAN
- Rest of Asia Pacific
- Latin America
- Introduction
- Market Size and Forecast, and Y-o-Y Growth, By Product Type, 2020-2032,(US$ Bn)
- Market Size and Forecast, and Y-o-Y Growth, By End User, 2020-2032,(US$ Bn)
- Market Size and Forecast, and Y-o-Y Growth, By Country, 2020-2032,(US$ Bn)
- Brazil
- Argentina
- Mexico
- Rest of Latin America
- Middle East
- Introduction
- Market Size and Forecast, and Y-o-Y Growth, By Product Type, 2020-2032,(US$ Bn)
- Market Size and Forecast, and Y-o-Y Growth, By End User, 2020-2032,(US$ Bn)
- Market Size and Forecast, and Y-o-Y Growth, By Country, 2020-2032,(US$ Bn)
- GCC Countries
- Israel
- Rest of Middle East
- Africa
- Introduction
- Market Size and Forecast, and Y-o-Y Growth, By Product Type, 2020-2032,(US$ Bn)
- Market Size and Forecast, and Y-o-Y Growth, By End User, 2020-2032,(US$ Bn)
- Market Size and Forecast, and Y-o-Y Growth, By Country/Region, 2020-2032,(US$ Bn)
- South Africa
- Central Africa
- North Africa
8. Competitive Landscape
- Company Profile
- ABB Ltd.
- Company Highlights
- Product Portfolio
- Key Developments
- Financial Performance
- Strategies
- Alterra Power Corporation
- Company Highlights
- Product Portfolio
- Key Highlights
- Financial Performance
- Strategies
- Kyocera Solar, Inc.
- Company Highlights
- Product Portfolio
- Key Highlights
- Financial Performance
- Strategies
- Nordex SE
- Company Highlights
- Product Portfolio
- Key Highlights
- Financial Performance
- Strategies
- Hanwha Q Cells GmbH
- Company Highlights
- Product Portfolio
- Key Highlights
- Financial Performance
- Strategies
- Sharp Corporation
- Company Highlights
- Product Portfolio
- Key Highlights
- Financial Performance
- Strategies
- Calpine Corporation
- Company Highlights
- Product Portfolio
- Key Highlights
- Financial Performance
- Strategies
- Suzlon Energy Ltd.
- Company Highlights
- Product Portfolio
- Key Developments
- Financial Performance
- Strategies
- S. Geothermal Inc.
- Company Highlights
- Product Portfolio
- Key Highlights
- Financial Performance
- Strategies
- Yingli Green Energy Holding Co. Ltd.
- Company Highlights
- Product Portfolio
- Key Highlights
- Financial Performance
- Strategies
- Enercon GmbH
- Company Highlights
- Product Portfolio
- Key Highlights
- Financial Performance
- Strategies
- GE Energy
- Company Highlights
- Product Portfolio
- Key Highlights
- Financial Performance
- Strategies
- Analyst Views
9. Section
- References
- Research Methodology
- About us

