|
|
市場調査レポート
商品コード
1407978
CPO(Co-Packaged Optics)の世界市場規模調査・予測:タイプ別、データレート別、用途別、地域別分析、2023-2030年Global Co-packaged Optics Market Size study & Forecast, by Type, by Data Rates, by Application (Data Centers and High-performance Computing, Telecommunications and Networking, Others) and Regional Analysis, 2023-2030 |
||||||
|
|||||||
カスタマイズ可能
|
|||||||

| CPO(Co-Packaged Optics)の世界市場規模調査・予測:タイプ別、データレート別、用途別、地域別分析、2023-2030年 |
|
出版日: 2023年12月20日
発行: Bizwit Research & Consulting LLP
ページ情報: 英文
納期: 2~3営業日
|

全表示
- 概要
- 図表
- 目次
CPO(Co-Packaged Optics)の世界市場は、2022年に約1,186万米ドルと評価され、予測期間2023-2030年には26.5%以上の健全な成長率で成長すると予測されています。
CPOは、レーザー、変調器、検出器などの光コンポーネントを半導体チップや電子集積回路に直接集積する技術です。この統合により、コンパクトでエネルギー効率の高い方法で、通常光相互接続を使用した高速データ伝送が可能になります。CPO市場は、データセンターインフラの増加や高解像度ビデオストリーミング需要の急増などの要因により拡大しています。CPOは、より高速で電力効率に優れたデータ通信への需要が高まっているデータセンターやハイパフォーマンスコンピューティング環境で特に有益です。その結果、2023-2030年の予測期間中、国際市場ではCPOの需要が漸増しています。
CPOは、データセンター内の高速データ伝送を可能にします。データセンタートラフィックが増加し続ける中、広帯域の必要性がますます重要になっています。CPOは、高速データレートをサポートすることができ、これは増加するデータ量を処理する上で極めて重要です。Statistaによると、2023年のデータセンター数は米国が世界最多で、5,375施設と報告されています。次いでドイツが522カ所、英国が517カ所となっています。さらに、データセンターシステムに対する世界のIT支出は、2023年末までに2,170億米ドルに達すると推定されています。CPO市場を牽引するもう一つの重要な要因は、HDビデオストリーミング需要の増加です。HDビデオストリーミングの需要が伸び続ける中、データセンタやコンテンツ配信ネットワークは、増加する負荷に対応するためにインフラを拡張する必要があります。CPOは、スケーラビリティをサポートするため、これらの施設では容量拡張が容易になり、より多くのユーザやより高品質のビデオコンテンツに対応できるようになります。また、Statistaによると、世界のビデオストリーミング(SVoD)市場は2023年に958億8,000万米ドルを占めます。さらに、教育やヘルスケア業界におけるIoTやコネクテッドデバイスの需要の高まりや、5Gネットワークの展開の高まりは、予測期間中に市場に有利な成長機会をもたらすと予想されます。しかし、複雑な設計と製造プロセス、高いネットワークの複雑性が、2023-2030年の予測期間を通じて市場全体の成長を阻害することになります。
CPO世界市場調査対象主要地域は、アジア太平洋、北米、欧州、ラテンアメリカ、中東&アフリカ。北米は、主要市場プレーヤのプレゼンスが高まっており、同地域の高度デジタル化に向けて企業のIT支出が増加していることから、2022年に市場を独占しました。この地域の圧倒的な実績は、CPOの需要全体を促進すると予測されています。さらに、アジア太平洋地域は、クラウドコンピューティング、デジタルサービス、eコマース需要の高まりによるデータセンターインフラなどの要因により、予測期間中に最も急成長すると予測されています。
本調査の目的は、近年におけるさまざまなセグメントと国の市場規模を明らかにし、今後数年間の市場規模を予測することです。本レポートは、調査対象国における産業の質的・量的側面の両方を盛り込むよう設計されています。
また、市場の将来的な成長を規定する促進要因や課題などの重要な側面に関する詳細情報も提供しています。さらに、主要企業の競合情勢や製品提供の詳細な分析とともに、利害関係者が投資するためのミクロ市場における潜在的な機会も組み込んでいます。
目次
第1章 エグゼクティブサマリー
第2章 世界のCPO市場の定義と範囲
- 調査目的
- 市場の定義と範囲
- 業界の進化
- 調査範囲
- 調査対象年
- 通貨換算レート
第3章 世界のCPO市場力学
- CPO市場の影響分析(2020-2030年)
- 市場促進要因
- データセンターインフラの増加
- 高解像度ビデオストリーミング需要の急増
- 市場の課題
- 複雑な設計と製造プロセス
- ネットワークの複雑さ
- 市場機会
- 教育やヘルスケア業界におけるIoTやコネクテッドデバイスの需要拡大
- 5Gネットワーク展開の増加
- 市場促進要因
第4章 世界のCPO市場:産業分析
- ポーターの5フォースモデル
- 供給企業の交渉力
- 買い手の交渉力
- 新規参入業者の脅威
- 代替品の脅威
- 競争企業間の敵対関係
- ポーターの5フォース影響分析
- PEST分析
- 政治
- 経済
- 社会
- 技術
- 環境
- 法律
- 主な投資機会
- 主要成功戦略
- COVID-19影響分析
- 破壊的動向
- 業界専門家の視点
- アナリストの結論・提言
第5章 CPOの世界市場:タイプ別
- 市場スナップショット
- CPOの世界市場:タイプ別、実績 - ポテンシャル分析
- CPOの世界市場:タイプ別推定・予測、2020-2030年
- CPOの世界市場、サブセグメント別分析
- CPO
- NPO
第6章 CPOの世界市場:データレート別
- 市場スナップショット
- CPOの世界市場:データレート別、実績 - ポテンシャル分析
- CPOの世界市場:データレート別推定・予測、2020-2030年
- CPO市場、サブセグメント分析
- 1.6T未満、1.6T
- 3.2T
- 6.4T
第7章 CPOの世界市場:用途別
- 市場スナップショット
- CPOの世界市場:用途別、実績 - ポテンシャル分析
- CPOの世界市場、用途別推定・予測、2020-2030年
- CPO市場、サブセグメント分析
- データセンター・ハイパフォーマンスコンピューティング(HPC)
- 通信・ネットワーキング
- その他
第8章 CPOの世界市場:地域別分析
- 主要国
- 主な新興国
- CPO市場、地域別市場スナップショット
- 北米
- 米国
- カナダ
- 欧州
- 英国
- ドイツ
- フランス
- スペイン
- イタリア
- その他欧州
- アジア太平洋
- 中国
- インド
- 日本
- オーストラリア
- 韓国
- その他アジア太平洋地域
- ラテンアメリカ
- ブラジル
- メキシコ
- 中東・アフリカ
- サウジアラビア
- 南アフリカ
- その他中東・アフリカ
第9章 競合情報
- 主要企業のSWOT分析
- 主要市場戦略
- 企業プロファイル
- Broadcom Inc
- 主要情報
- 概要
- 財務(データの入手可能性によります)
- 製品概要
- 最近の動向
- Cisco Systems, Inc
- The International Business Machines Corporation
- Intel Corporation
- Microsoft Corporation
- Furukawa Electric Co., Ltd
- Hisense Broadband Multimedia Technology Co., Ltd
- Huawei Technologies Co., Ltd
- SENKO Advanced Components, Inc
- Sumitomo Electric Industries, Ltd
- Broadcom Inc
第10章 調査プロセス
- 調査プロセス
- データマイニング
- 分析
- 市場推定
- 検証
- 出版
- 調査属性
- 調査前提条件
LIST OF TABLES
- TABLE 1. Global Co-packaged Optics Market, report scope
- TABLE 2. Global Co-packaged Optics Market estimates & forecasts by Region 2020-2030 (USD Million)
- TABLE 3. Global Co-packaged Optics Market estimates & forecasts by Type 2020-2030 (USD Million)
- TABLE 4. Global Co-packaged Optics Market estimates & forecasts by Data Rates 2020-2030 (USD Million)
- TABLE 5. Global Co-packaged Optics Market estimates & forecasts by Application 2020-2030 (USD Million)
- TABLE 6. Global Co-packaged Optics Market by segment, estimates & forecasts, 2020-2030 (USD Million)
- TABLE 7. Global Co-packaged Optics Market by region, estimates & forecasts, 2020-2030 (USD Million)
- TABLE 8. Global Co-packaged Optics Market by segment, estimates & forecasts, 2020-2030 (USD Million)
- TABLE 9. Global Co-packaged Optics Market by region, estimates & forecasts, 2020-2030 (USD Million)
- TABLE 10. Global Co-packaged Optics Market by segment, estimates & forecasts, 2020-2030 (USD Million)
- TABLE 11. Global Co-packaged Optics Market by region, estimates & forecasts, 2020-2030 (USD Million)
- TABLE 12. Global Co-packaged Optics Market by segment, estimates & forecasts, 2020-2030 (USD Million)
- TABLE 13. Global Co-packaged Optics Market by region, estimates & forecasts, 2020-2030 (USD Million)
- TABLE 14. Global Co-packaged Optics Market by segment, estimates & forecasts, 2020-2030 (USD Million)
- TABLE 15. Global Co-packaged Optics Market by region, estimates & forecasts, 2020-2030 (USD Million)
- TABLE 16. U.S. Co-packaged Optics Market estimates & forecasts, 2020-2030 (USD Million)
- TABLE 17. U.S. Co-packaged Optics Market estimates & forecasts by segment 2020-2030 (USD Million)
- TABLE 18. U.S. Co-packaged Optics Market estimates & forecasts by segment 2020-2030 (USD Million)
- TABLE 19. Canada Co-packaged Optics Market estimates & forecasts, 2020-2030 (USD Million)
- TABLE 20. Canada Co-packaged Optics Market estimates & forecasts by segment 2020-2030 (USD Million)
- TABLE 21. Canada Co-packaged Optics Market estimates & forecasts by segment 2020-2030 (USD Million)
- TABLE 22. UK Co-packaged Optics Market estimates & forecasts, 2020-2030 (USD Million)
- TABLE 23. UK Co-packaged Optics Market estimates & forecasts by segment 2020-2030 (USD Million)
- TABLE 24. UK Co-packaged Optics Market estimates & forecasts by segment 2020-2030 (USD Million)
- TABLE 25. Germany Co-packaged Optics Market estimates & forecasts, 2020-2030 (USD Million)
- TABLE 26. Germany Co-packaged Optics Market estimates & forecasts by segment 2020-2030 (USD Million)
- TABLE 27. Germany Co-packaged Optics Market estimates & forecasts by segment 2020-2030 (USD Million)
- TABLE 28. France Co-packaged Optics Market estimates & forecasts, 2020-2030 (USD Million)
- TABLE 29. France Co-packaged Optics Market estimates & forecasts by segment 2020-2030 (USD Million)
- TABLE 30. France Co-packaged Optics Market estimates & forecasts by segment 2020-2030 (USD Million)
- TABLE 31. Italy Co-packaged Optics Market estimates & forecasts, 2020-2030 (USD Million)
- TABLE 32. Italy Co-packaged Optics Market estimates & forecasts by segment 2020-2030 (USD Million)
- TABLE 33. Italy Co-packaged Optics Market estimates & forecasts by segment 2020-2030 (USD Million)
- TABLE 34. Spain Co-packaged Optics Market estimates & forecasts, 2020-2030 (USD Million)
- TABLE 35. Spain Co-packaged Optics Market estimates & forecasts by segment 2020-2030 (USD Million)
- TABLE 36. Spain Co-packaged Optics Market estimates & forecasts by segment 2020-2030 (USD Million)
- TABLE 37. RoE Co-packaged Optics Market estimates & forecasts, 2020-2030 (USD Million)
- TABLE 38. RoE Co-packaged Optics Market estimates & forecasts by segment 2020-2030 (USD Million)
- TABLE 39. RoE Co-packaged Optics Market estimates & forecasts by segment 2020-2030 (USD Million)
- TABLE 40. China Co-packaged Optics Market estimates & forecasts, 2020-2030 (USD Million)
- TABLE 41. China Co-packaged Optics Market estimates & forecasts by segment 2020-2030 (USD Million)
- TABLE 42. China Co-packaged Optics Market estimates & forecasts by segment 2020-2030 (USD Million)
- TABLE 43. India Co-packaged Optics Market estimates & forecasts, 2020-2030 (USD Million)
- TABLE 44. India Co-packaged Optics Market estimates & forecasts by segment 2020-2030 (USD Million)
- TABLE 45. India Co-packaged Optics Market estimates & forecasts by segment 2020-2030 (USD Million)
- TABLE 46. Japan Co-packaged Optics Market estimates & forecasts, 2020-2030 (USD Million)
- TABLE 47. Japan Co-packaged Optics Market estimates & forecasts by segment 2020-2030 (USD Million)
- TABLE 48. Japan Co-packaged Optics Market estimates & forecasts by segment 2020-2030 (USD Million)
- TABLE 49. South Korea Co-packaged Optics Market estimates & forecasts, 2020-2030 (USD Million)
- TABLE 50. South Korea Co-packaged Optics Market estimates & forecasts by segment 2020-2030 (USD Million)
- TABLE 51. South Korea Co-packaged Optics Market estimates & forecasts by segment 2020-2030 (USD Million)
- TABLE 52. Australia Co-packaged Optics Market estimates & forecasts, 2020-2030 (USD Million)
- TABLE 53. Australia Co-packaged Optics Market estimates & forecasts by segment 2020-2030 (USD Million)
- TABLE 54. Australia Co-packaged Optics Market estimates & forecasts by segment 2020-2030 (USD Million)
- TABLE 55. RoAPAC Co-packaged Optics Market estimates & forecasts, 2020-2030 (USD Million)
- TABLE 56. RoAPAC Co-packaged Optics Market estimates & forecasts by segment 2020-2030 (USD Million)
- TABLE 57. RoAPAC Co-packaged Optics Market estimates & forecasts by segment 2020-2030 (USD Million)
- TABLE 58. Brazil Co-packaged Optics Market estimates & forecasts, 2020-2030 (USD Million)
- TABLE 59. Brazil Co-packaged Optics Market estimates & forecasts by segment 2020-2030 (USD Million)
- TABLE 60. Brazil Co-packaged Optics Market estimates & forecasts by segment 2020-2030 (USD Million)
- TABLE 61. Mexico Co-packaged Optics Market estimates & forecasts, 2020-2030 (USD Million)
- TABLE 62. Mexico Co-packaged Optics Market estimates & forecasts by segment 2020-2030 (USD Million)
- TABLE 63. Mexico Co-packaged Optics Market estimates & forecasts by segment 2020-2030 (USD Million)
- TABLE 64. RoLA Co-packaged Optics Market estimates & forecasts, 2020-2030 (USD Million)
- TABLE 65. RoLA Co-packaged Optics Market estimates & forecasts by segment 2020-2030 (USD Million)
- TABLE 66. RoLA Co-packaged Optics Market estimates & forecasts by segment 2020-2030 (USD Million)
- TABLE 67. Saudi Arabia Co-packaged Optics Market estimates & forecasts, 2020-2030 (USD Million)
- TABLE 68. South Africa Co-packaged Optics Market estimates & forecasts by segment 2020-2030 (USD Million)
- TABLE 69. RoMEA Co-packaged Optics Market estimates & forecasts by segment 2020-2030 (USD Million)
- TABLE 70. List of secondary sources, used in the study of global Co-packaged Optics Market
- TABLE 71. List of primary sources, used in the study of global Co-packaged Optics Market
- TABLE 72. Years considered for the study
- TABLE 73. Exchange rates considered
List of tables and figures and dummy in nature, final lists may vary in the final deliverable
LIST OF FIGURES
- FIG 1. Global Co-packaged Optics Market, research methodology
- FIG 2. Global Co-packaged Optics Market, Market estimation techniques
- FIG 3. Global Market size estimates & forecast methods
- FIG 4. Global Co-packaged Optics Market, key trends 2022
- FIG 5. Global Co-packaged Optics Market, growth prospects 2023-2030
- FIG 6. Global Co-packaged Optics Market, porters 5 force model
- FIG 7. Global Co-packaged Optics Market, pest analysis
- FIG 8. Global Co-packaged Optics Market, value chain analysis
- FIG 9. Global Co-packaged Optics Market by segment, 2020 & 2030 (USD Million)
- FIG 10. Global Co-packaged Optics Market by segment, 2020 & 2030 (USD Million)
- FIG 11. Global Co-packaged Optics Market by segment, 2020 & 2030 (USD Million)
- FIG 12. Global Co-packaged Optics Market by segment, 2020 & 2030 (USD Million)
- FIG 13. Global Co-packaged Optics Market by segment, 2020 & 2030 (USD Million)
- FIG 14. Global Co-packaged Optics Market, regional snapshot 2020 & 2030
- FIG 15. North America Co-packaged Optics Market 2020 & 2030 (USD Million)
- FIG 16. Europe Co-packaged Optics Market 2020 & 2030 (USD Million)
- FIG 17. Asia pacific Co-packaged Optics Market 2020 & 2030 (USD Million)
- FIG 18. Latin America Co-packaged Optics Market 2020 & 2030 (USD Million)
- FIG 19. Middle East & Africa Co-packaged Optics Market 2020 & 2030 (USD Million)
List of tables and figures and dummy in nature, final lists may vary in the final deliverable
Global Co-packaged Optics Market is valued at approximately USD 11.86 million in 2022 and is anticipated to grow with a healthy growth rate of more than 26.5% over the forecast period 2023-2030. Co-packaged optics is a technology that integrates optical components such as lasers, modulators, and detectors directly with semiconductor chips or electronic integrated circuits. This integration enables high-speed data transmission, typically using optical interconnects, in a compact and energy-efficient manner. The Co-packaged Optics Market is expanding because of factors such as the rising number of data center infrastructures and the surge in demand for high-definition video streaming. Co-packaged optics can be particularly beneficial in data centers and high-performance computing environments where there is a growing demand for faster and more power-efficient data communication. As a result, the demand for Co-packaged Optics has progressively increased in the international market during the forecast period 2023-2030.
Co-packaged optics enables faster data transmission within data centers. As data center traffic continues to grow, the need for higher bandwidth becomes increasingly critical. Co-packaged optics can support high-speed data rates, which is crucial for handling the increasing volume of data. According to Statista, in 2023, the United States accounts for the highest number of data centers globally, with a reported total of 5,375 facilities. Germany followed with 522 data centers, and the United Kingdom had 517 data centers in operation during the same period. Furthermore, global IT spending on data centre systems is estimated to reach USD 217 billion by the year-end of 2023. Another important factor that drives the Co-packaged Optics Market is the increasing demand for high-definition video streaming. As the demand for HD video streaming continues to grow, data centers and content delivery networks need to scale their infrastructure to handle the increased load. Co-packaged optics support scalability, making it easier for these facilities to expand their capacity and accommodate more users and higher-quality video content. In addition, as per Statista, the global Video Streaming (SVoD) market accounts for USD 95.88 billion in 2023. Moreover, the growing demand for IoT and connected devices in the education and healthcare industry and the rising deployment of 5G networks are anticipated to create lucrative growth opportunities for the market over the forecast period. However, the complicated design and fabrication process and high network complexity are going to impede overall market growth throughout the forecast period of 2023-2030.
The key regions considered for the Global Co-packaged Optics Market study includes Asia Pacific, North America, Europe, Latin America, and Middle East & Africa. North America dominated the market in 2022 owing to the increasing presence of key market players and rising IT spending by enterprises towards advanced digitalization in the region. The region's dominant performance is anticipated to propel the overall demand for Co-packaged Optics. Furthermore, Asia Pacific is expected to grow fastest over the forecast period, owing to factors such as data center infrastructure due to the rising demand for cloud computing, digital services, and e-commerce in the region.
Major market player included in this report are:
- Broadcom Inc
- Cisco Systems, Inc
- The International Business Machines Corporation
- Intel Corporation
- Microsoft Corporation
- Furukawa Electric Co., Ltd
- Hisense Broadband Multimedia Technology Co., Ltd
- Huawei Technologies Co., Ltd
- SENKO Advanced Components, Inc
- Sumitomo Electric Industries, Ltd
Recent Developments in the Market:
- In July 2022, Senko Advanced Components acquired CudoForm, a renowned company specializing in the design and production of high-precision micro-optic components used in various sectors, including data communications, consumer photonics, and biosafety. This strategic acquisition of two prominent global industry leaders, synergizing their product offerings and expertise, is poised to accelerate the adoption of cutting-edge and inventive optical interconnect solutions.
Global Co-packaged Optics Market Report Scope:
- Historical Data - 2020 - 2021
- Base Year for Estimation - 2022
- Forecast period - 2023-2030
- Report Coverage - Revenue forecast, Company Ranking, Competitive Landscape, Growth factors, and Trends
- Segments Covered - Type, Data Rates, Application, Region
- Regional Scope - North America; Europe; Asia Pacific; Latin America; Middle East & Africa
- Customization Scope - Free report customization (equivalent up to 8 analyst's working hours) with purchase. Addition or alteration to country, regional & segment scope*
The objective of the study is to define market sizes of different segments & countries in recent years and to forecast the values to the coming years. The report is designed to incorporate both qualitative and quantitative aspects of the industry within countries involved in the study.
The report also caters detailed information about the crucial aspects such as driving factors & challenges which will define the future growth of the market. Additionally, it also incorporates potential opportunities in micro markets for stakeholders to invest along with the detailed analysis of competitive landscape and product offerings of key players. The detailed segments and sub-segment of the market are explained below:
By Type
- CPO
- NPO
By Data Rates
- Less than 1.6 T & 1.6 T
- 3.2 T
- 6.4 T
By Application
- Data Centers and High-performance Computing (HPC)
- Telecommunications and Networking
- Others
By Region:
- North America
- U.S.
- Canada
- Europe
- UK
- Germany
- France
- Spain
- Italy
- ROE
- Asia Pacific
- China
- India
- Japan
- Australia
- South Korea
- RoAPAC
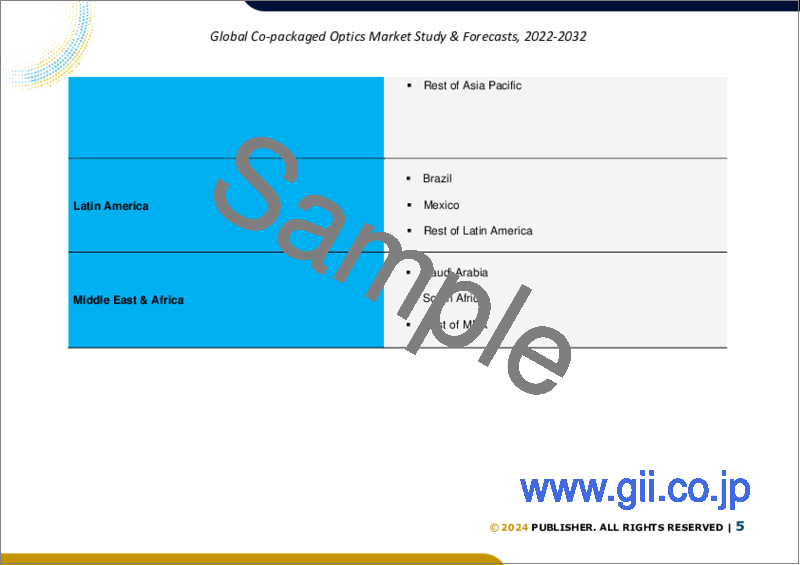
- Latin America
- Brazil
- Mexico
- Middle East & Africa
- Saudi Arabia
- South Africa
- Rest of Middle East & Africa
Table of Contents
Chapter 1. Executive Summary
- 1.1. Market Snapshot
- 1.2. Global & Segmental Market Estimates & Forecasts, 2020-2030 (USD Million)
- 1.2.1. Co-packaged Optics Market, by Region, 2020-2030 (USD Million)
- 1.2.2. Co-packaged Optics Market, by Type, 2020-2030 (USD Million)
- 1.2.3. Co-packaged Optics Market, by Data Rates, 2020-2030 (USD Million)
- 1.2.4. Co-packaged Optics Market, by Application, 2020-2030 (USD Million)
- 1.3. Key Trends
- 1.4. Estimation Methodology
- 1.5. Research Assumption
Chapter 2. Global Co-packaged Optics Market Definition and Scope
- 2.1. Objective of the Study
- 2.2. Market Definition & Scope
- 2.2.1. Industry Evolution
- 2.2.2. Scope of the Study
- 2.3. Years Considered for the Study
- 2.4. Currency Conversion Rates
Chapter 3. Global Co-packaged Optics Market Dynamics
- 3.1. Co-packaged Optics Market Impact Analysis (2020-2030)
- 3.1.1. Market Drivers
- 3.1.1.1. Rising number of data center infrastructure
- 3.1.1.2. Surge in demand for high-definition video streaming
- 3.1.2. Market Challenges
- 3.1.2.1. Complicated design and fabrication process
- 3.1.2.2. High network complexity
- 3.1.3. Market Opportunities
- 3.1.3.1. Growing demand for IoT and connected devices in education and healthcare industry
- 3.1.3.2. Rising deployment of 5G networks
- 3.1.1. Market Drivers
Chapter 4. Global Co-packaged Optics Market Industry Analysis
- 4.1. Porter's 5 Force Model
- 4.1.1. Bargaining Power of Suppliers
- 4.1.2. Bargaining Power of Buyers
- 4.1.3. Threat of New Entrants
- 4.1.4. Threat of Substitutes
- 4.1.5. Competitive Rivalry
- 4.2. Porter's 5 Force Impact Analysis
- 4.3. PEST Analysis
- 4.3.1. Political
- 4.3.2. Economical
- 4.3.3. Social
- 4.3.4. Technological
- 4.3.5. Environmental
- 4.3.6. Legal
- 4.4. Top investment opportunity
- 4.5. Top winning strategies
- 4.6. COVID-19 Impact Analysis
- 4.7. Disruptive Trends
- 4.8. Industry Expert Perspective
- 4.9. Analyst Recommendation & Conclusion
Chapter 5. Global Co-packaged Optics Market, by Type
- 5.1. Market Snapshot
- 5.2. Global Co-packaged Optics Market by Type, Performance - Potential Analysis
- 5.3. Global Co-packaged Optics Market Estimates & Forecasts by Type 2020-2030 (USD Million)
- 5.4. Co-packaged Optics Market, Sub Segment Analysis
- 5.4.1. CPO
- 5.4.2. NPO
Chapter 6. Global Co-packaged Optics Market, by Data Rates
- 6.1. Market Snapshot
- 6.2. Global Co-packaged Optics Market by Data Rates, Performance - Potential Analysis
- 6.3. Global Co-packaged Optics Market Estimates & Forecasts by Data Rates 2020-2030 (USD Million)
- 6.4. Co-packaged Optics Market, Sub Segment Analysis
- 6.4.1. Less than 1.6 T & 1.6 T
- 6.4.2. 3.2 T
- 6.4.3. 6.4 T
Chapter 7. Global Co-packaged Optics Market, by Application
- 7.1. Market Snapshot
- 7.2. Global Co-packaged Optics Market by Application, Performance - Potential Analysis
- 7.3. Global Co-packaged Optics Market Estimates & Forecasts by Application 2020-2030 (USD Million)
- 7.4. Co-packaged Optics Market, Sub Segment Analysis
- 7.4.1. Data Centers and High-performance Computing (HPC)
- 7.4.2. Telecommunications and Networking
- 7.4.3. Others
Chapter 8. Global Co-packaged Optics Market, Regional Analysis
- 8.1. Top Leading Countries
- 8.2. Top Emerging Countries
- 8.3. Co-packaged Optics Market, Regional Market Snapshot
- 8.4. North America Co-packaged Optics Market
- 8.4.1. U.S. Co-packaged Optics Market
- 8.4.1.1. Type breakdown estimates & forecasts, 2020-2030
- 8.4.1.2. Data Rates breakdown estimates & forecasts, 2020-2030
- 8.4.1.3. Application breakdown estimates & forecasts, 2020-2030
- 8.4.2. Canada Co-packaged Optics Market
- 8.4.1. U.S. Co-packaged Optics Market
- 8.5. Europe Co-packaged Optics Market Snapshot
- 8.5.1. U.K. Co-packaged Optics Market
- 8.5.2. Germany Co-packaged Optics Market
- 8.5.3. France Co-packaged Optics Market
- 8.5.4. Spain Co-packaged Optics Market
- 8.5.5. Italy Co-packaged Optics Market
- 8.5.6. Rest of Europe Co-packaged Optics Market
- 8.6. Asia-Pacific Co-packaged Optics Market Snapshot
- 8.6.1. China Co-packaged Optics Market
- 8.6.2. India Co-packaged Optics Market
- 8.6.3. Japan Co-packaged Optics Market
- 8.6.4. Australia Co-packaged Optics Market
- 8.6.5. South Korea Co-packaged Optics Market
- 8.6.6. Rest of Asia Pacific Co-packaged Optics Market
- 8.7. Latin America Co-packaged Optics Market Snapshot
- 8.7.1. Brazil Co-packaged Optics Market
- 8.7.2. Mexico Co-packaged Optics Market
- 8.8. Middle East & Africa Co-packaged Optics Market
- 8.8.1. Saudi Arabia Co-packaged Optics Market
- 8.8.2. South Africa Co-packaged Optics Market
- 8.8.3. Rest of Middle East & Africa Co-packaged Optics Market
Chapter 9. Competitive Intelligence
- 9.1. Key Company SWOT Analysis
- 9.1.1. Company 1
- 9.1.2. Company 2
- 9.1.3. Company 3
- 9.2. Top Market Strategies
- 9.3. Company Profiles
- 9.3.1. Broadcom Inc
- 9.3.1.1. Key Information
- 9.3.1.2. Overview
- 9.3.1.3. Financial (Subject to Data Availability)
- 9.3.1.4. Product Summary
- 9.3.1.5. Recent Developments
- 9.3.2. Cisco Systems, Inc
- 9.3.3. The International Business Machines Corporation
- 9.3.4. Intel Corporation
- 9.3.5. Microsoft Corporation
- 9.3.6. Furukawa Electric Co., Ltd
- 9.3.7. Hisense Broadband Multimedia Technology Co., Ltd
- 9.3.8. Huawei Technologies Co., Ltd
- 9.3.9. SENKO Advanced Components, Inc
- 9.3.10. Sumitomo Electric Industries, Ltd
- 9.3.1. Broadcom Inc
Chapter 10. Research Process
- 10.1. Research Process
- 10.1.1. Data Mining
- 10.1.2. Analysis
- 10.1.3. Market Estimation
- 10.1.4. Validation
- 10.1.5. Publishing
- 10.2. Research Attributes
- 10.3. Research Assumption

