|
|
市場調査レポート
商品コード
1389162
グリーンアンモニアの世界市場規模調査&予測、技術別、用途別、地域別分析、2023~2030年Global Green Ammonia Market Size study & Forecast, by Technology by Application and Regional Analysis, 2023-2030 |
||||||
|
|
|||||||
カスタマイズ可能
|
|||||||


| グリーンアンモニアの世界市場規模調査&予測、技術別、用途別、地域別分析、2023~2030年 |
|
出版日: 2023年10月30日
発行: Bizwit Research & Consulting LLP
ページ情報: 英文
納期: 2~3営業日
|

- 全表示
- 概要
- 図表
- 目次
世界のグリーンアンモニア市場は、2022年に約1億7,000万米ドルと評価され、予測期間2023年から2030年にかけて72.90%以上の健全な成長率で成長すると予測されています。
グリーンアンモニアは、化石燃料の代わりに太陽光発電や風力発電などの再生可能エネルギーを使って生産されます。アンモニア(NH3)は窒素と水素からなる化合物で、農業、冷凍、化学製造など様々な産業で一般的に使用されています。市場成長を促進する主な要因は、農業生産の増加に伴う環境に優しい肥料へのニーズの高まり、温室効果ガス排出削減のための規制政策の施行とインセンティブの提供、環境問題、および予測期間中の市場成長をサポートすると予想される再生可能エネルギーの長期保存の必要性です。
さらに、再生可能エネルギーへの投資の拡大は、グリーンアンモニア市場の成長を支える重要な役割を果たしています。グリーンアンモニアは、電気を使用して水を水素と酸素に分解する電気分解と呼ばれるプロセスを通じて生産されます。このプロセスで使用される電力は、太陽光発電、風力発電、水力発電などの再生可能エネルギーから得ることができます。再生可能エネルギーへの投資が増えるにつれ、電気分解に使用する低コストでクリーンな電力の入手可能性も高まり、グリーンアンモニア製造は経済的に実行可能なものとなります。Statistaによると、2020年の世界の再生可能エネルギーへの新規投資額は3,630億米ドルで、投資額は大幅に増加し、2022年には4,950億米ドルに達しました。さらに、海洋燃料としてのアンモニアの可能性と、水素ベースの経済構築への注目の高まりは、予測期間中に市場に有利な機会を生み出すと予想されます。しかし、グリーンアンモニアプラントを設置するための初期コストが高いことが、2023年から2030年の予測期間を通じて市場の成長を阻害しています。
グリーンアンモニアの世界市場調査において考慮した主要地域は、アジア太平洋、北米、欧州、ラテンアメリカ、中東・アフリカです。北米は、再生可能エネルギーへの関心の高まり、政府の支援と政策、技術の進歩、国際的な協力と貿易の機会により、2022年の市場を独占しました。一方、アジア太平洋は、政府の取り組みや規制、再生可能エネルギーの開発、産業部門における脱炭素化の取り組み、技術の進歩やコスト削減などの要因により、予測期間中に最も高いCAGRで成長すると予想されます。
本調査の目的は、近年におけるさまざまなセグメントと国の市場規模を明らかにし、今後数年間の市場規模を予測することです。本レポートは、調査対象国における産業の質的・量的側面を盛り込むよう設計されています。
また、市場の将来的な成長を規定する促進要因や課題などの重要な側面に関する詳細情報も提供しています。さらに、主要企業の競合情勢や製品提供の詳細な分析とともに、利害関係者が投資するためのミクロ市場における潜在的な機会も組み込んでいます。
目次
第1章 エグゼクティブサマリー
第2章 世界のグリーンアンモニア市場の定義と範囲
- 調査目的
- 市場の定義と範囲
- 産業の進化
- 調査範囲
- 調査対象年
- 通貨換算レート
第3章 グリーンアンモニアの世界市場力学
- グリーンアンモニア市場の影響分析(2020~2030年)
- 市場の促進要因
- 農業生産の増加に伴う環境に優しい肥料へのニーズの高まり、規制政策の施行
- 温室効果ガス排出削減のためのインセンティブ提供
- 市場の課題
- グリーンアンモニア工場設立のための初期コストの高さ
- 市場機会
- 海洋燃料としてのアンモニアの可能性
- 水素ベースの経済構築への注目の高まり
- 市場の促進要因
第4章 世界のグリーンアンモニア市場産業分析
- ポーターの5フォースモデル
- 供給企業の交渉力
- 買い手の交渉力
- 新規参入業者の脅威
- 代替品の脅威
- 競争企業間の敵対関係
- ポーターの5フォース影響分析
- PEST分析
- 政治
- 経済
- 社会
- 技術
- 環境
- 法律
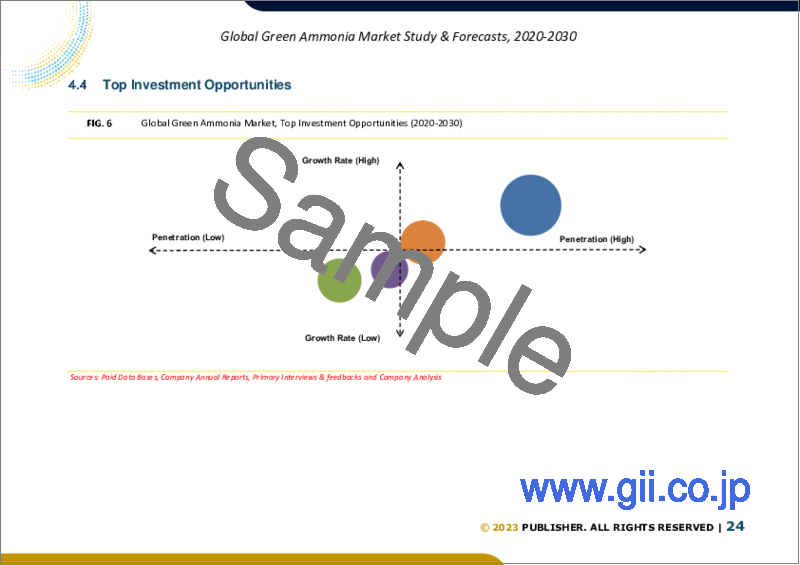
- 主な投資機会
- 主要成功戦略
- COVID-19影響分析
- 破壊的動向
- 業界専門家の視点
- アナリストの結論・提言
第5章 グリーンアンモニアの世界市場:技術別
- 市場スナップショット
- グリーンアンモニアの世界市場:技術別、実績・ポテンシャル分析
- グリーンアンモニアの世界市場:技術別、推定・予測、2020~2030年
- グリーンアンモニアの世界市場、サブセグメント分析
- プロトン交換膜
- アルカリ水電解
- 固体酸化物電解
第6章 グリーンアンモニアの世界市場:用途別
- 市場スナップショット
- グリーンアンモニアの世界市場:用途別、実績・ポテンシャル分析
- グリーンアンモニアの世界市場:用途別、推定・予測、2020~2030年
- グリーンアンモニアの世界市場、サブセグメント分析
- 輸送
- 発電
- 工業用原料
- その他
第7章 グリーンアンモニアの世界市場、地域分析
- 主要国
- 主な新興国
- グリーンアンモニア市場の地域別市場スナップショット
- 北米
- 米国
- 技術別、推定・予測、2020~2030年
- 用途別、推定・予測、2020~2030年
- カナダ
- 米国
- 欧州のグリーンアンモニア市場スナップショット
- 英国
- ドイツ
- フランス
- スペイン
- イタリア
- その他の欧州
- アジア太平洋のグリーンアンモニア市場スナップショット
- 中国
- インド
- 日本
- オーストラリア
- 韓国
- その他のアジア太平洋
- ラテンアメリカのグリーンアンモニア市場スナップショット
- ブラジル
- メキシコ
- 中東・アフリカ
- サウジアラビア
- 南アフリカ
- その他の中東およびアフリカ
第8章 競合情報
- 主要企業のSWOT分析
- 主要市場戦略
- 企業プロファイル
- Fuelpositive Corporation
- Haldor Topsoe,
- NEL ASA
- ThyssenKrupp AG
- Siemens AG
- CF Industries Holdings, Inc.,
- Yara International
- BASF SE
- Queensland Nitrates Pty Ltd
- AMMPower Corp
第9章 調査プロセス
- 調査プロセス
- データ鉱業
- 分析
- 市場推定
- 検証
- 出版
- 調査属性
- 調査前提条件
LIST OF TABLES
- TABLE 1. Global Green Ammonia Market, report scope
- TABLE 2. Global Green Ammonia Market estimates & forecasts by region 2020-2030 (USD Billion)
- TABLE 3. Global Green Ammonia Market estimates & forecasts by Technology 2020-2030 (USD Billion)
- TABLE 4. Global Green Ammonia Market estimates & forecasts by Application 2020-2030 (USD Billion)
- TABLE 5. Global Green Ammonia Market by segment, estimates & forecasts, 2020-2030 (USD Billion)
- TABLE 6. Global Green Ammonia Market by region, estimates & forecasts, 2020-2030 (USD Billion)
- TABLE 7. Global Green Ammonia Market by segment, estimates & forecasts, 2020-2030 (USD Billion)
- TABLE 8. Global Green Ammonia Market by region, estimates & forecasts, 2020-2030 (USD Billion)
- TABLE 9. Global Green Ammonia Market by segment, estimates & forecasts, 2020-2030 (USD Billion)
- TABLE 10. Global Green Ammonia Market by region, estimates & forecasts, 2020-2030 (USD Billion)
- TABLE 11. Global Green Ammonia Market by segment, estimates & forecasts, 2020-2030 (USD Billion)
- TABLE 12. Global Green Ammonia Market by region, estimates & forecasts, 2020-2030 (USD Billion)
- TABLE 13. Global Green Ammonia Market by segment, estimates & forecasts, 2020-2030 (USD Billion)
- TABLE 14. Global Green Ammonia Market by region, estimates & forecasts, 2020-2030 (USD Billion)
- TABLE 15. U.S. Green Ammonia Market estimates & forecasts, 2020-2030 (USD Billion)
- TABLE 16. U.S. Green Ammonia Market estimates & forecasts by segment 2020-2030 (USD Billion)
- TABLE 17. U.S. Green Ammonia Market estimates & forecasts by segment 2020-2030 (USD Billion)
- TABLE 18. Canada Green Ammonia Market estimates & forecasts, 2020-2030 (USD Billion)
- TABLE 19. Canada Green Ammonia Market estimates & forecasts by segment 2020-2030 (USD Billion)
- TABLE 20. Canada Green Ammonia Market estimates & forecasts by segment 2020-2030 (USD Billion)
- TABLE 21. UK Green Ammonia Market estimates & forecasts, 2020-2030 (USD Billion)
- TABLE 22. UK Green Ammonia Market estimates & forecasts by segment 2020-2030 (USD Billion)
- TABLE 23. UK Green Ammonia Market estimates & forecasts by segment 2020-2030 (USD Billion)
- TABLE 24. Germany Green Ammonia Market estimates & forecasts, 2020-2030 (USD Billion)
- TABLE 25. Germany Green Ammonia Market estimates & forecasts by segment 2020-2030 (USD Billion)
- TABLE 26. Germany Green Ammonia Market estimates & forecasts by segment 2020-2030 (USD Billion)
- TABLE 27. France Green Ammonia Market estimates & forecasts, 2020-2030 (USD Billion)
- TABLE 28. France Green Ammonia Market estimates & forecasts by segment 2020-2030 (USD Billion)
- TABLE 29. France Green Ammonia Market estimates & forecasts by segment 2020-2030 (USD Billion)
- TABLE 30. Italy Green Ammonia Market estimates & forecasts, 2020-2030 (USD Billion)
- TABLE 31. Italy Green Ammonia Market estimates & forecasts by segment 2020-2030 (USD Billion)
- TABLE 32. Italy Green Ammonia Market estimates & forecasts by segment 2020-2030 (USD Billion)
- TABLE 33. Spain Green Ammonia Market estimates & forecasts, 2020-2030 (USD Billion)
- TABLE 34. Spain Green Ammonia Market estimates & forecasts by segment 2020-2030 (USD Billion)
- TABLE 35. Spain Green Ammonia Market estimates & forecasts by segment 2020-2030 (USD Billion)
- TABLE 36. RoE Green Ammonia Market estimates & forecasts, 2020-2030 (USD Billion)
- TABLE 37. RoE Green Ammonia Market estimates & forecasts by segment 2020-2030 (USD Billion)
- TABLE 38. RoE Green Ammonia Market estimates & forecasts by segment 2020-2030 (USD Billion)
- TABLE 39. China Green Ammonia Market estimates & forecasts, 2020-2030 (USD Billion)
- TABLE 40. China Green Ammonia Market estimates & forecasts by segment 2020-2030 (USD Billion)
- TABLE 41. China Green Ammonia Market estimates & forecasts by segment 2020-2030 (USD Billion)
- TABLE 42. India Green Ammonia Market estimates & forecasts, 2020-2030 (USD Billion)
- TABLE 43. India Green Ammonia Market estimates & forecasts by segment 2020-2030 (USD Billion)
- TABLE 44. India Green Ammonia Market estimates & forecasts by segment 2020-2030 (USD Billion)
- TABLE 45. Japan Green Ammonia Market estimates & forecasts, 2020-2030 (USD Billion)
- TABLE 46. Japan Green Ammonia Market estimates & forecasts by segment 2020-2030 (USD Billion)
- TABLE 47. Japan Green Ammonia Market estimates & forecasts by segment 2020-2030 (USD Billion)
- TABLE 48. South Korea Green Ammonia Market estimates & forecasts, 2020-2030 (USD Billion)
- TABLE 49. South Korea Green Ammonia Market estimates & forecasts by segment 2020-2030 (USD Billion)
- TABLE 50. South Korea Green Ammonia Market estimates & forecasts by segment 2020-2030 (USD Billion)
- TABLE 51. Australia Green Ammonia Market estimates & forecasts, 2020-2030 (USD Billion)
- TABLE 52. Australia Green Ammonia Market estimates & forecasts by segment 2020-2030 (USD Billion)
- TABLE 53. Australia Green Ammonia Market estimates & forecasts by segment 2020-2030 (USD Billion)
- TABLE 54. RoAPAC Green Ammonia Market estimates & forecasts, 2020-2030 (USD Billion)
- TABLE 55. RoAPAC Green Ammonia Market estimates & forecasts by segment 2020-2030 (USD Billion)
- TABLE 56. RoAPAC Green Ammonia Market estimates & forecasts by segment 2020-2030 (USD Billion)
- TABLE 57. Brazil Green Ammonia Market estimates & forecasts, 2020-2030 (USD Billion)
- TABLE 58. Brazil Green Ammonia Market estimates & forecasts by segment 2020-2030 (USD Billion)
- TABLE 59. Brazil Green Ammonia Market estimates & forecasts by segment 2020-2030 (USD Billion)
- TABLE 60. Mexico Green Ammonia Market estimates & forecasts, 2020-2030 (USD Billion)
- TABLE 61. Mexico Green Ammonia Market estimates & forecasts by segment 2020-2030 (USD Billion)
- TABLE 62. Mexico Green Ammonia Market estimates & forecasts by segment 2020-2030 (USD Billion)
- TABLE 63. RoLA Green Ammonia Market estimates & forecasts, 2020-2030 (USD Billion)
- TABLE 64. RoLA Green Ammonia Market estimates & forecasts by segment 2020-2030 (USD Billion)
- TABLE 65. RoLA Green Ammonia Market estimates & forecasts by segment 2020-2030 (USD Billion)
- TABLE 66. Saudi Arabia Green Ammonia Market estimates & forecasts, 2020-2030 (USD Billion)
- TABLE 67. South Africa Green Ammonia Market estimates & forecasts by segment 2020-2030 (USD Billion)
- TABLE 68. RoMEA Green Ammonia Market estimates & forecasts by segment 2020-2030 (USD Billion)
- TABLE 69. List of secondary sources, used in the study of global Green Ammonia Market
- TABLE 70. List of primary sources, used in the study of global Green Ammonia Market
- TABLE 71. Years considered for the study
- TABLE 72. Exchange rates considered
List of tables and figures and dummy in nature, final lists may vary in the final deliverable
LIST OF FIGURES
- FIG 1. Global Green Ammonia Market, research methodology
- FIG 2. Global Green Ammonia Market, Market estimation techniques
- FIG 3. Global Market size estimates & forecast methods
- FIG 4. Global Green Ammonia Market, key trends 2022
- FIG 5. Global Green Ammonia Market, growth prospects 2023-2030
- FIG 6. Global Green Ammonia Market, porters 5 force model
- FIG 7. Global Green Ammonia Market, pest analysis
- FIG 8. Global Green Ammonia Market, value chain analysis
- FIG 9. Global Green Ammonia Market by segment, 2020 & 2030 (USD Billion)
- FIG 10. Global Green Ammonia Market by segment, 2020 & 2030 (USD Billion)
- FIG 11. Global Green Ammonia Market by segment, 2020 & 2030 (USD Billion)
- FIG 12. Global Green Ammonia Market by segment, 2020 & 2030 (USD Billion)
- FIG 13. Global Green Ammonia Market by segment, 2020 & 2030 (USD Billion)
- FIG 14. Global Green Ammonia Market, regional snapshot 2020 & 2030
- FIG 15. North America Green Ammonia Market 2020 & 2030 (USD Billion)
- FIG 16. Europe Green Ammonia Market 2020 & 2030 (USD Billion)
- FIG 17. Asia pacific Green Ammonia Market 2020 & 2030 (USD Billion)
- FIG 18. Latin America Green Ammonia Market 2020 & 2030 (USD Billion)
- FIG 19. Middle East & Africa Green Ammonia Market 2020 & 2030 (USD Billion)
List of tables and figures and dummy in nature, final lists may vary in the final deliverable
Global Green Ammonia Market is valued approximately USD 0.17 billion in 2022 and is anticipated to grow with a healthy growth rate of more than 72.90% over the forecast period 2023-2030. Green ammonia is produced using renewable energy sources, such as solar or wind power, instead of fossil fuels. Ammonia (NH3) is a compound made up of nitrogen and hydrogen and is commonly used in various industries, including agriculture, refrigeration, and chemical manufacturing. The key factors driving the market growth is increased need for eco-friendly fertilizers with rising agricultural production, enforcement of regulatory policies and provision of incentives to reduce GHG emissions, environmental concerns, and need to store renewable energy for longer term that anticipated to support the market growth during forecast period.
Moreover, growing investment in renewable energy plays a crucial role in supporting the growth of the Green Ammonia market. The Green Ammonia is produced through a process called electrolysis, that involves splitting water into hydrogen and oxygen using electricity. The electricity used in this process can be derived from renewable energy sources such as solar, wind, or hydroelectric power. As the investment in renewable energy increases, the availability of low-cost and clean electricity for electrolysis also increases, making Green Ammonia production more economically viable. According to Statista, in 2020 the new investment in renewable energy worldwide was USD 363 billion and the investment increased significantly and reached USD 495 billion in 2022. Additionally, potential of ammonia as maritime fuel and increasing focus on building hydrogen-based economy is anticipated to create the lucrative opportunity for the market during forecast period. However, the high initial cost to set up green ammonia plant stifles market growth throughout the forecast period of 2023-2030.
The key regions considered for the Global Green Ammonia Market study includes Asia Pacific, North America, Europe, Latin America, and Middle East & Africa. North America dominated the market in 2022 owing to the growing focus on renewable energy, government support and policies, technological advancements and international collaboration and trade opportunities. Whereas, the Asia Pacific is expected to grow with the highest CAGR during the forecast period, owing to factors such as the government initiatives and regulations, renewable energy development, decarbonization efforts in industrial sectors, and technological advancements and cost reductions.
Major market player included in this report are:
- Fuelpositive Corporation
- Haldor Topsoe Inc.
- NEL ASA
- ThyssenKrupp AG
- Siemens AG
- CF Industries Holdings, Inc.,
- Yara International ASA
- BASF SE
- Queensland Nitrates Pty Ltd
- AMMPower Corp
Recent Developments in the Market:
- In August 2022, Uniper SE and EverWind Fuels signed a Memorandum of Understanding for acquiring green ammonia from EverWind's inaugural manufacturing facility in Nova Scotia.
Global Green Ammonia Market Report Scope:
- Historical Data: 2020 - 2021
- Base Year for Estimation: 2022
- Forecast period: 2023-2030
- Report Coverage: Revenue forecast, Company Ranking, Competitive Landscape, Growth factors, and Trends
- Segments Covered: Technology, Application, Region
- Regional Scope: North America; Europe; Asia Pacific; Latin America; Middle East & Africa
- Customization Scope: Free report customization (equivalent up to 8 analyst's working hours) with purchase. Addition or alteration to country, regional & segment scope*
The objective of the study is to define market sizes of different segments & countries in recent years and to forecast the values to the coming years. The report is designed to incorporate both qualitative and quantitative aspects of the industry within countries involved in the study.
The report also caters detailed information about the crucial aspects such as driving factors & challenges which will define the future growth of the market. Additionally, it also incorporates potential opportunities in micro markets for stakeholders to invest along with the detailed analysis of competitive landscape and product offerings of key players. The detailed segments and sub-segment of the market are explained below:
By Technology:
- Proton Exchange Membrane
- Alkaline Water Electrolysis
- Solid Oxide Electrolysis
By Application:
- Transportation
- Power Generation
- Industrial Feedstock
- Others
By Region:
- North America
- U.S.
- Canada
- Europe
- UK
- Germany
- France
- Spain
- Italy
- ROE
- Asia Pacific
- China
- India
- Japan
- Australia
- South Korea
- RoAPAC
- Latin America
- Brazil
- Mexico
- Middle East & Africa
- Saudi Arabia
- South Africa
- Rest of Middle East & Africa
Table of Contents
Chapter 1. Executive Summary
- 1.1. Market Snapshot
- 1.2. Global & Segmental Market Estimates & Forecasts, 2020-2030 (USD Billion)
- 1.2.1. Green Ammonia Market, by Region, 2020-2030 (USD Billion)
- 1.2.2. Green Ammonia Market, by Technology, 2020-2030 (USD Billion)
- 1.2.3. Green Ammonia Market, by Application, 2020-2030 (USD Billion)
- 1.3. Key Trends
- 1.4. Estimation Methodology
- 1.5. Research Assumption
Chapter 2. Global Green Ammonia Market Definition and Scope
- 2.1. Objective of the Study
- 2.2. Market Definition & Scope
- 2.2.1. Industry Evolution
- 2.2.2. Scope of the Study
- 2.3. Years Considered for the Study
- 2.4. Currency Conversion Rates
Chapter 3. Global Green Ammonia Market Dynamics
- 3.1. Green Ammonia Market Impact Analysis (2020-2030)
- 3.1.1. Market Drivers
- 3.1.1.1. Increased need for eco-friendly fertilizers with rising agricultural production, enforcement of regulatory policies
- 3.1.1.2. Provision of incentives to reduce GHG emissions
- 3.1.2. Market Challenges
- 3.1.2.1. High initial cost to set up green ammonia plant
- 3.1.3. Market Opportunities
- 3.1.3.1. Potential of ammonia as maritime fuel
- 3.1.3.2. Increasing focus on building hydrogen-based economy
- 3.1.1. Market Drivers
Chapter 4. Global Green Ammonia Market Industry Analysis
- 4.1. Porter's 5 Force Model
- 4.1.1. Bargaining Power of Suppliers
- 4.1.2. Bargaining Power of Buyers
- 4.1.3. Threat of New Entrants
- 4.1.4. Threat of Substitutes
- 4.1.5. Competitive Rivalry
- 4.2. Porter's 5 Force Impact Analysis
- 4.3. PEST Analysis
- 4.3.1. Political
- 4.3.2. Economical
- 4.3.3. Social
- 4.3.4. Technological
- 4.3.5. Environmental
- 4.3.6. Legal
- 4.4. Top investment opportunity
- 4.5. Top winning strategies
- 4.6. COVID-19 Impact Analysis
- 4.7. Disruptive Trends
- 4.8. Industry Expert Perspective
- 4.9. Analyst Recommendation & Conclusion
Chapter 5. Global Green Ammonia Market, by Technology
- 5.1. Market Snapshot
- 5.2. Global Green Ammonia Market by Technology, Performance - Potential Analysis
- 5.3. Global Green Ammonia Market Estimates & Forecasts by Technology 2020-2030 (USD Billion)
- 5.4. Green Ammonia Market, Sub Segment Analysis
- 5.4.1. Proton Exchange Membrane
- 5.4.2. Alkaline Water Electrolysis
- 5.4.3. Solid Oxide Electrolysis
Chapter 6. Global Green Ammonia Market, by Application
- 6.1. Market Snapshot
- 6.2. Global Green Ammonia Market by Application, Performance - Potential Analysis
- 6.3. Global Green Ammonia Market Estimates & Forecasts by Application 2020-2030 (USD Billion)
- 6.4. Green Ammonia Market, Sub Segment Analysis
- 6.4.1. Transportation
- 6.4.2. Power Generation
- 6.4.3. Industrial Feedstock
- 6.4.4. Others
Chapter 7. Global Green Ammonia Market, Regional Analysis
- 7.1. Top Leading Countries
- 7.2. Top Emerging Countries
- 7.3. Green Ammonia Market, Regional Market Snapshot
- 7.4. North America Green Ammonia Market
- 7.4.1. U.S. Green Ammonia Market
- 7.4.1.1. Technology breakdown estimates & forecasts, 2020-2030
- 7.4.1.2. Application breakdown estimates & forecasts, 2020-2030
- 7.4.2. Canada Green Ammonia Market
- 7.4.1. U.S. Green Ammonia Market
- 7.5. Europe Green Ammonia Market Snapshot
- 7.5.1. U.K. Green Ammonia Market
- 7.5.2. Germany Green Ammonia Market
- 7.5.3. France Green Ammonia Market
- 7.5.4. Spain Green Ammonia Market
- 7.5.5. Italy Green Ammonia Market
- 7.5.6. Rest of Europe Green Ammonia Market
- 7.6. Asia-Pacific Green Ammonia Market Snapshot
- 7.6.1. China Green Ammonia Market
- 7.6.2. India Green Ammonia Market
- 7.6.3. Japan Green Ammonia Market
- 7.6.4. Australia Green Ammonia Market
- 7.6.5. South Korea Green Ammonia Market
- 7.6.6. Rest of Asia Pacific Green Ammonia Market
- 7.7. Latin America Green Ammonia Market Snapshot
- 7.7.1. Brazil Green Ammonia Market
- 7.7.2. Mexico Green Ammonia Market
- 7.8. Middle East & Africa Green Ammonia Market
- 7.8.1. Saudi Arabia Green Ammonia Market
- 7.8.2. South Africa Green Ammonia Market
- 7.8.3. Rest of Middle East & Africa Green Ammonia Market
Chapter 8. Competitive Intelligence
- 8.1. Key Company SWOT Analysis
- 8.1.1. Company 1
- 8.1.2. Company 2
- 8.1.3. Company 3
- 8.2. Top Market Strategies
- 8.3. Company Profiles
- 8.3.1. Fuelpositive Corporation
- 8.3.1.1. Key Information
- 8.3.1.2. Overview
- 8.3.1.3. Financial (Subject to Data Availability)
- 8.3.1.4. Product Summary
- 8.3.1.5. Recent Developments
- 8.3.2. Haldor Topsoe,
- 8.3.3. NEL ASA
- 8.3.4. ThyssenKrupp AG
- 8.3.5. Siemens AG
- 8.3.6. CF Industries Holdings, Inc.,
- 8.3.7. Yara International
- 8.3.8. BASF SE
- 8.3.9. Queensland Nitrates Pty Ltd
- 8.3.10. AMMPower Corp
- 8.3.1. Fuelpositive Corporation
Chapter 9. Research Process
- 9.1. Research Process
- 9.1.1. Data Mining
- 9.1.2. Analysis
- 9.1.3. Market Estimation
- 9.1.4. Validation
- 9.1.5. Publishing
- 9.2. Research Attributes
- 9.3. Research Assumption
