
|
市場調査レポート
商品コード
1885922
グリーンアンモニア市場の機会、成長要因、業界動向分析、および2024年から2032年までの予測Green Ammonia Market Opportunity, Growth Drivers, Industry Trend Analysis, and Forecast 2024 - 2032 |
||||||
カスタマイズ可能
|
|||||||
| グリーンアンモニア市場の機会、成長要因、業界動向分析、および2024年から2032年までの予測 |
|
出版日: 2025年11月26日
発行: Global Market Insights Inc.
ページ情報: 英文 190 Pages
納期: 2~3営業日
|

概要
世界のグリーンアンモニア市場は、2024年に5億2,000万米ドルと評価され、2034年までにCAGR65.6%で成長し、835億米ドルに達すると予測されています。
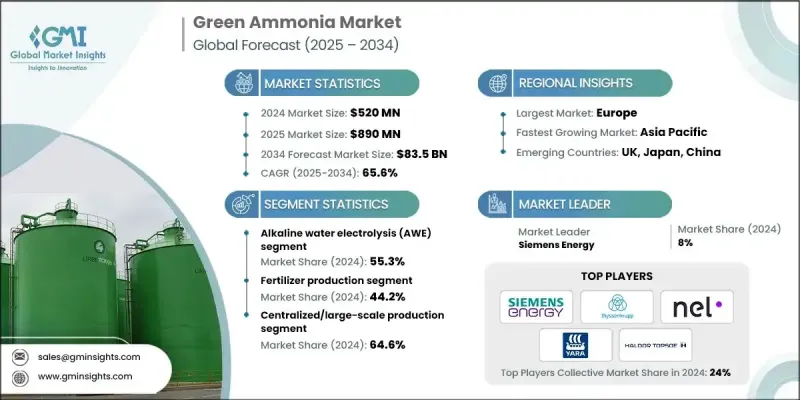
グリーンアンモニアは、水素貯蔵の実現、再生可能エネルギーとの連携、海運など脱炭素化が困難な分野におけるゼロカーボン燃料としての役割を通じて、エネルギー・化学バリューチェーンにおいて重要な役割を果たし、世界のエネルギー転換の基盤として急速に台頭しています。その戦略的重要性は、既存のアンモニアインフラを活用して規模拡大を加速させつつ、脱炭素化目標を達成できる点にあります。市場成長は、支援的な政策枠組み、気候中立目標、グリーンエネルギー認証制度によって推進されています。特に再生可能エネルギーによる電解水素製造技術の発展により、コスト効率と運用性能が向上しています。エネルギー大手、肥料メーカー、海運事業者による企業コミットメントが投資をさらに促進し、グリーンアンモニアを長期的な持続可能性戦略の重要要素として位置づけています。地域別動向では、アジア太平洋が再生可能エネルギー設備容量と輸出プロジェクトで主導的立場にあり、欧州は規制支援と確立されたグリーン水素回廊の恩恵を受けています。
| 市場範囲 | |
|---|---|
| 開始年 | 2024年 |
| 予測年度 | 2025-2034 |
| 開始時価値 | 5億2,000万米ドル |
| 予測金額 | 835億米ドル |
| CAGR | 65.6% |
アルカリ性水電解(AWE)セグメントは2024年に55.3%のシェアを占め、2034年までCAGR60.3%で成長すると予測されています。AWEは、大規模な再生可能エネルギー連動プロジェクトにおいて、最も費用対効果が高く成熟した技術であり続けています。プロトン交換膜(PEM)電解は、運用上の柔軟性と変動する再生可能電力への迅速な対応を提供するため、系統連系型およびハイブリッドエネルギーシステムに最適です。
肥料生産セグメントは2024年に44.2%のシェアを占め、2034年までにCAGR 56.2%で成長すると予測されています。発酵ベースのアプローチはバイオプラットフォーム化学品の生産において確立されており、高い選択性、穏やかな操作条件、複雑な分子の大規模かつ効率的な生産を実現します。
北米のグリーンアンモニア市場は2024年に25.9%のシェアを占めました。同地域は豊富な再生可能エネルギー資源、支援政策、既存のアンモニアインフラを背景に主要生産拠点として台頭しており、低炭素代替技術の迅速な導入を促進しています。
よくあるご質問
目次
第1章 調査手法と範囲
第2章 エグゼクティブサマリー
第3章 業界考察
- エコシステム分析
- サプライヤーの情勢
- 利益率
- 各段階における付加価値
- バリューチェーンに影響を与える要因
- ディスラプション
- 業界への影響要因
- 促進要因
- 世界の脱炭素化目標とネットゼロ公約
- 海運業界のゼロカーボン燃料への移行
- 政府の奨励策及び補助金プログラム
- 業界の潜在的リスク&課題
- 高額な資本投資要件
- 技術的成熟度とスケールアップの課題
- 市場機会
- 既存アンモニア生産設備の改修
- 小規模分散型生産システム
- 促進要因
- 成長可能性分析
- 規制情勢
- 北米
- 欧州
- アジア太平洋地域
- ラテンアメリカ
- 中東・アフリカ
- ポーター分析
- PESTEL分析
- 価格動向
- 地域別
- 電解装置技術タイプ別
- 将来の市場動向
- 技術とイノベーションの動向
- 現在の技術動向
- 新興技術
- 特許状況
- 貿易統計(HSコード)(注:貿易統計は主要国のみ提供されます)
- 主要輸入国
- 主要輸出国
- 持続可能性と環境面
- 持続可能な取り組み
- 廃棄物削減戦略
- 生産におけるエネルギー効率
- 環境に配慮した取り組み
- カーボンフットプリントへの配慮
第4章 競合情勢
- イントロダクション
- 企業の市場シェア分析
- 地域別
- 北米
- 欧州
- アジア太平洋地域
- ラテンアメリカ
- 中東・アフリカ地域
- 地域別
- 企業マトリクス分析
- 主要市場企業の競合分析
- 競合ポジショニングマトリックス
- 主な発展
- 合併・買収
- 提携・協業
- 新製品の発売
- 事業拡大計画
第5章 市場推計・予測:技術タイプ別、2021-2034
- 主要動向
- アルカリ性水電解(AWE)
- プロトン交換膜(PEM)電解
- 固体酸化物電解セル(SOEC)
- 陰イオン交換膜(AEM)
第6章 市場推計・予測:用途別、2021-2034
- 主要動向
- 肥料生産
- 船舶燃料・海運
- 水素輸送・貯蔵
- 工業原料・化学品
- 発電・エネルギー貯蔵
第7章 市場推計・予測:生産方式別、2021-2034
- 主要動向
- オンサイト/分散型生産
- 集中型/大規模生産
第8章 市場推計・予測:地域別、2021-2034
- 主要動向
- 北米
- 米国
- カナダ
- 欧州
- ドイツ
- 英国
- フランス
- スペイン
- イタリア
- その他欧州地域
- アジア太平洋地域
- 中国
- インド
- 日本
- オーストラリア
- 韓国
- その他アジア太平洋地域
- ラテンアメリカ
- ブラジル
- メキシコ
- アルゼンチン
- その他ラテンアメリカ地域
- 中東・アフリカ
- サウジアラビア
- 南アフリカ
- アラブ首長国連邦
- その他中東・アフリカ地域
第9章 企業プロファイル
- Siemens Energy
- ThyssenKrupp AG
- Nel ASA(Hydrogenics)
- Yara International
- Haldor Topsoe
- Air Products Inc
- BASF SE
- Hiringa Energy
- Hydrogenics
- Kapsom
- MAN Energy Solutions
- Starfire Energy
- Technip Energies NV
- Uniper ENGIE

