|
|
市場調査レポート
商品コード
1311156
産業用コンピュータ断層撮影の世界市場規模調査&予測:オファリング別、用途別、業界別、地域別分析、2023-2030年Global Industrial Computed Tomography Market Size study & Forecast, by Offering, by Application, by Vertical and Regional Analysis, 2023-2030 |
||||||
|
|
|||||||
カスタマイズ可能
|
|||||||


| 産業用コンピュータ断層撮影の世界市場規模調査&予測:オファリング別、用途別、業界別、地域別分析、2023-2030年 |
|
出版日: 2023年07月11日
発行: Bizwit Research & Consulting LLP
ページ情報: 英文
納期: 2~3営業日
|

- 全表示
- 概要
- 図表
- 目次
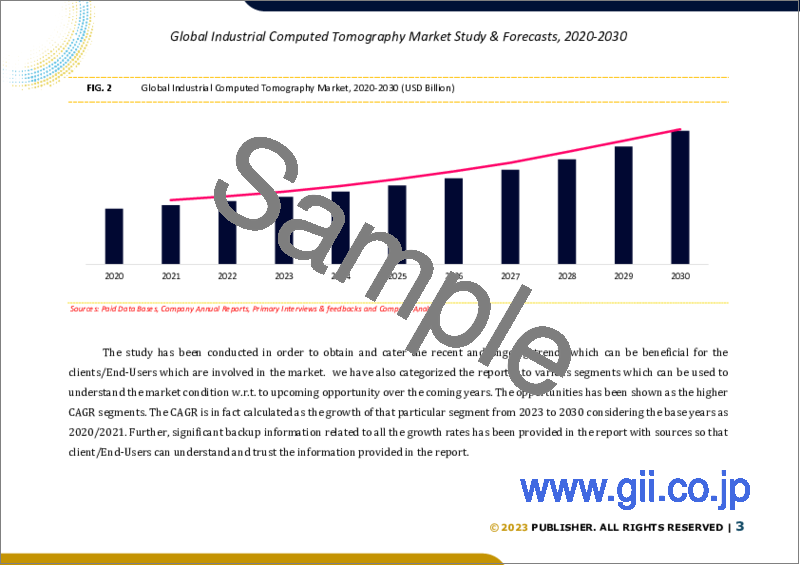
産業用コンピュータ断層撮影の世界市場は、2022年に約4億9,621万米ドルと評価され、予測期間2023-2030年には7.50%以上の堅調な成長率で成長すると予測されています。
産業用コンピュータ断層撮影(CT)は、X線画像技術を使用して物体や部品の3次元表現を作成する非破壊検査技術です。製造業、航空宇宙、自動車、電子機器などさまざまな産業で、品質管理、製品開発、故障解析などに使用される強力なツールです。CTの基本原理は医療用CTスキャンと似ています。対象物や部品の周囲で、さまざまな角度から一連のX線画像を撮影します。これらのX線画像をコンピューターで処理し、対象物の内部と外部の特徴の3Dモデルを再構築します。さらに、製造生産量の増加と3Dプリンティング市場の成長が、この市場の成長促進要因になると予測されています。さらに、CT技術の技術進歩の高まりと急速な工業化の進展が、予測期間2023-2030年の市場の成長機会として浮上しています。
2022年の国連工業開発機関(UNIDO)によると、世界の製造業生産高は前年比3~4%の安定した成長率を示しました。この情報は、2023年から2030年の予測期間中、世界の製造業が一貫して拡大したことを示しています。この安定した成長率は、良好な経済状況と様々な産業における製造品への持続的な需要を反映しています。また、パンデミックや世界のサプライチェーンの混乱といった課題に直面した製造業の回復力と適応力も浮き彫りにしています。製造業の生産高が着実に伸びていることは、世界の経済や業界にとって明るい兆しであり、業界情勢が堅調であることを示しています。2022年のStatistaによると、3Dプリンティング製品とサービスの世界市場は2020年に約126億米ドルの規模に達し、2020年から2023年にかけてCAGRは約17%になると予測されています。しかし、高い価格とメンテナンスコスト、熟練労働者の限られた利用可能性が、2023年から2030年の予測期間中の市場の成長を妨げる可能性があります。
産業用コンピュータ断層撮影の世界市場調査において考慮した主要地域は、アジア太平洋、北米、欧州、ラテンアメリカ、中東・アフリカです。北米は産業用コンピュータ断層撮影の世界市場で優位を占めており、先端技術への投資、自動車産業とエレクトロニクス産業の繁栄、Baker Hughes Co.、Nikon Metrology NV、Yxlon International GmbHなどの主要市場プレイヤーの存在によって、今後も大きな速度で拡大すると予測されています。アジア太平洋地域は、産業用コンピュータ断層撮影(コンピュータ断層検査)市場で最も急成長している地域です。この成長の原動力は、電子機器、自動車、航空宇宙、防衛などの産業で、試験や検査を目的としたCTシステムの採用が増加していることです。同地域は、自動車およびエレクトロニクス製造企業の主要拠点となっています。この地域の盛んな製造・生産活動は、市場拡大に寄与する主な要因です。
本調査の目的は、近年のさまざまなセグメントと国の市場規模を明らかにし、今後数年間の市場規模を予測することです。本レポートは、調査対象国における産業の質的・量的側面の両方を盛り込むよう設計されています。
また、市場の将来的な成長を規定する促進要因や課題などの重要な側面に関する詳細情報も提供しています。さらに、主要企業の競合情勢や製品提供の詳細な分析とともに、利害関係者が投資するためのミクロ市場における潜在的な機会も組み込んでいます。
目次
第1章 エグゼクティブサマリー
- 市場スナップショット
- 世界市場・セグメント別市場推計・予測、2020-2030年
- 産業用コンピュータ断層撮影市場:地域別、2020~2030年
- 産業用コンピュータ断層撮影市場:オファリング別、2020~2030年
- 産業用コンピュータ断層撮影市場:用途別、2020~2030年
- 産業用コンピュータ断層撮影市場:業界別、2020~2030年
- 主要動向
- 調査手法
- 調査前提
第2章 産業用コンピュータ断層撮影の世界市場の定義と範囲
- 調査目的
- 市場の定義と範囲
- 産業の進化
- 調査範囲
- 調査対象年
- 通貨換算レート
第3章 産業用コンピュータ断層撮影の世界市場力学
- 産業用コンピュータ断層撮影市場のインパクト分析(2020-2030年)
- 市場促進要因
- 製造業生産高の増加
- 3Dプリンティング市場の成長
- 市場の課題
- 高い価格とメンテナンスコスト
- 熟練労働力の不足
- 市場機会
- 高まる技術進歩
- 急速な工業化の進展
- 市場促進要因
第4章 産業用コンピュータ断層撮影の世界市場:産業分析
- ポーターの5フォースモデル
- 供給企業の交渉力
- 買い手の交渉力
- 新規参入業者の脅威
- 代替品の脅威
- 競争企業間の敵対関係
- ポーターの5フォース影響分析
- PEST分析
- 政治
- 経済
- 社会
- 技術
- 環境
- 法律
- 主な投資機会
- 主要成功戦略
- COVID-19影響分析
- 破壊的動向
- 業界専門家の視点
- アナリストの結論・提言
第5章 産業用コンピュータ断層撮影の世界市場:オファリング別
- 市場スナップショット
- 産業用コンピュータ断層撮影の世界市場:オファリング別、実績、潜在能力分析
- 産業用コンピュータ断層撮影の世界市場:オファリング別推定・予測2020-2030年
- 産業用コンピュータ断層撮影の世界市場、サブセグメント別分析
- 装置
- サービス
第6章 産業用コンピュータ断層撮影の世界市場:用途別
- 市場スナップショット
- 産業用コンピュータ断層撮影の世界市場:用途別、実績、ポテンシャル分析
- 産業用コンピュータ断層撮影の世界市場:用途別推定・予測、2020-2030年
- 産業用コンピュータ断層撮影の世界市場、サブセグメント別分析
- 欠陥検出と検査
- 故障解析
- アセンブリ解析
- 寸法・公差解析
- その他
第7章 産業用コンピュータ断層撮影の世界市場:業界別
- 市場スナップショット
- 産業用コンピュータ断層撮影の世界市場:業界別、実績 - ポテンシャル分析
- 産業用コンピュータ断層撮影の世界市場:業界別、推定・予測2020~2030年
- 産業用コンピュータ断層撮影の世界市場、サブセグメント別分析
- 石油・ガス
- 航空宇宙・防衛
- 自動車
- エレクトロニクス
- その他
第8章 産業用コンピュータ断層撮影の世界市場:地域別分析
- 主要国
- 主要新興国
- 産業用コンピュータ断層撮影の世界市場、地域別市場スナップショット
- 北米
- 米国
- 推定・予測、2020-2030年
- アプリケーションの推定・予測、2020-2030年
- 業界別の推定・予測、2020-2030年
- カナダ
- 米国
- 欧州産業用コンピュータ断層撮影市場スナップショット
- 英国
- ドイツ
- フランス
- スペイン
- イタリア
- その他欧州
- アジア太平洋産業用コンピュータ断層撮影市場のスナップショット
- 中国
- インド
- 日本
- オーストラリア
- 韓国
- その他アジア太平洋地域
- ラテンアメリカの産業用コンピュータ断層撮影市場スナップショット
- ブラジル
- メキシコ
- 中東・アフリカ
- サウジアラビア
- 南アフリカ
- その他中東とアフリカ
第9章 競合情報
- 主要企業のSWOT分析
- 主要市場戦略
- 企業プロファイル
- Nikon Metrology Inc.
- 主要情報
- 概要
- 財務(データの入手可能性によります)
- 製品概要
- 最近の動向
- OMRON Corp.
- Baker Hughes Company
- YXLON International GmbH.
- ZEISS Group
- VJ Group
- Rigaku Corporation
- Shimadzu Corporation
- Werth Inc.
- North Star Imaging Inc.
- Nikon Metrology Inc.
第10章 調査プロセス
- 調査プロセス
- データマイニング
- 分析
- 市場推定
- 検証
- 出版
- 調査属性
- 調査前提
LIST OF TABLES
- TABLE 1. Global Industrial Computed Tomography Market, report scope
- TABLE 2. Global Industrial Computed Tomography Market estimates & forecasts by Region 2020-2030 (USD Million)
- TABLE 3. Global Industrial Computed Tomography Market estimates & forecasts by Offering 2020-2030 (USD Million)
- TABLE 4. Global Industrial Computed Tomography Market estimates & forecasts by Application 2020-2030 (USD Million)
- TABLE 5. Global Industrial Computed Tomography Market estimates & forecasts by Vertical 2020-2030 (USD Million)
- TABLE 6. Global Industrial Computed Tomography Market by segment, estimates & forecasts, 2020-2030 (USD Million)
- TABLE 7. Global Industrial Computed Tomography Market by region, estimates & forecasts, 2020-2030 (USD Million)
- TABLE 8. Global Industrial Computed Tomography Market by segment, estimates & forecasts, 2020-2030 (USD Million)
- TABLE 9. Global Industrial Computed Tomography Market by region, estimates & forecasts, 2020-2030 (USD Million)
- TABLE 10. Global Industrial Computed Tomography Market by segment, estimates & forecasts, 2020-2030 (USD Million)
- TABLE 11. Global Industrial Computed Tomography Market by region, estimates & forecasts, 2020-2030 (USD Million)
- TABLE 12. Global Industrial Computed Tomography Market by segment, estimates & forecasts, 2020-2030 (USD Million)
- TABLE 13. Global Industrial Computed Tomography Market by region, estimates & forecasts, 2020-2030 (USD Million)
- TABLE 14. Global Industrial Computed Tomography Market by segment, estimates & forecasts, 2020-2030 (USD Million)
- TABLE 15. Global Industrial Computed Tomography Market by region, estimates & forecasts, 2020-2030 (USD Million)
- TABLE 16. U.S. Industrial Computed Tomography Market estimates & forecasts, 2020-2030 (USD Million)
- TABLE 17. U.S. Industrial Computed Tomography Market estimates & forecasts by segment 2020-2030 (USD Million)
- TABLE 18. U.S. Industrial Computed Tomography Market estimates & forecasts by segment 2020-2030 (USD Million)
- TABLE 19. Canada Industrial Computed Tomography Market estimates & forecasts, 2020-2030 (USD Million)
- TABLE 20. Canada Industrial Computed Tomography Market estimates & forecasts by segment 2020-2030 (USD Million)
- TABLE 21. Canada Industrial Computed Tomography Market estimates & forecasts by segment 2020-2030 (USD Million)
- TABLE 22. UK Industrial Computed Tomography Market estimates & forecasts, 2020-2030 (USD Million)
- TABLE 23. UK Industrial Computed Tomography Market estimates & forecasts by segment 2020-2030 (USD Million)
- TABLE 24. UK Industrial Computed Tomography Market estimates & forecasts by segment 2020-2030 (USD Million)
- TABLE 25. Germany Industrial Computed Tomography Market estimates & forecasts, 2020-2030 (USD Million)
- TABLE 26. Germany Industrial Computed Tomography Market estimates & forecasts by segment 2020-2030 (USD Million)
- TABLE 27. Germany Industrial Computed Tomography Market estimates & forecasts by segment 2020-2030 (USD Million)
- TABLE 28. France Industrial Computed Tomography Market estimates & forecasts, 2020-2030 (USD Million)
- TABLE 29. France Industrial Computed Tomography Market estimates & forecasts by segment 2020-2030 (USD Million)
- TABLE 30. France Industrial Computed Tomography Market estimates & forecasts by segment 2020-2030 (USD Million)
- TABLE 31. Italy Industrial Computed Tomography Market estimates & forecasts, 2020-2030 (USD Million)
- TABLE 32. Italy Industrial Computed Tomography Market estimates & forecasts by segment 2020-2030 (USD Million)
- TABLE 33. Italy Industrial Computed Tomography Market estimates & forecasts by segment 2020-2030 (USD Million)
- TABLE 34. Spain Industrial Computed Tomography Market estimates & forecasts, 2020-2030 (USD Million)
- TABLE 35. Spain Industrial Computed Tomography Market estimates & forecasts by segment 2020-2030 (USD Million)
- TABLE 36. Spain Industrial Computed Tomography Market estimates & forecasts by segment 2020-2030 (USD Million)
- TABLE 37. RoE Industrial Computed Tomography Market estimates & forecasts, 2020-2030 (USD Million)
- TABLE 38. RoE Industrial Computed Tomography Market estimates & forecasts by segment 2020-2030 (USD Million)
- TABLE 39. RoE Industrial Computed Tomography Market estimates & forecasts by segment 2020-2030 (USD Million)
- TABLE 40. China Industrial Computed Tomography Market estimates & forecasts, 2020-2030 (USD Million)
- TABLE 41. China Industrial Computed Tomography Market estimates & forecasts by segment 2020-2030 (USD Million)
- TABLE 42. China Industrial Computed Tomography Market estimates & forecasts by segment 2020-2030 (USD Million)
- TABLE 43. India Industrial Computed Tomography Market estimates & forecasts, 2020-2030 (USD Million)
- TABLE 44. India Industrial Computed Tomography Market estimates & forecasts by segment 2020-2030 (USD Million)
- TABLE 45. India Industrial Computed Tomography Market estimates & forecasts by segment 2020-2030 (USD Million)
- TABLE 46. Japan Industrial Computed Tomography Market estimates & forecasts, 2020-2030 (USD Million)
- TABLE 47. Japan Industrial Computed Tomography Market estimates & forecasts by segment 2020-2030 (USD Million)
- TABLE 48. Japan Industrial Computed Tomography Market estimates & forecasts by segment 2020-2030 (USD Million)
- TABLE 49. South Korea Industrial Computed Tomography Market estimates & forecasts, 2020-2030 (USD Million)
- TABLE 50. South Korea Industrial Computed Tomography Market estimates & forecasts by segment 2020-2030 (USD Million)
- TABLE 51. South Korea Industrial Computed Tomography Market estimates & forecasts by segment 2020-2030 (USD Million)
- TABLE 52. Australia Industrial Computed Tomography Market estimates & forecasts, 2020-2030 (USD Million)
- TABLE 53. Australia Industrial Computed Tomography Market estimates & forecasts by segment 2020-2030 (USD Million)
- TABLE 54. Australia Industrial Computed Tomography Market estimates & forecasts by segment 2020-2030 (USD Million)
- TABLE 55. RoAPAC Industrial Computed Tomography Market estimates & forecasts, 2020-2030 (USD Million)
- TABLE 56. RoAPAC Industrial Computed Tomography Market estimates & forecasts by segment 2020-2030 (USD Million)
- TABLE 57. RoAPAC Industrial Computed Tomography Market estimates & forecasts by segment 2020-2030 (USD Million)
- TABLE 58. Brazil Industrial Computed Tomography Market estimates & forecasts, 2020-2030 (USD Million)
- TABLE 59. Brazil Industrial Computed Tomography Market estimates & forecasts by segment 2020-2030 (USD Million)
- TABLE 60. Brazil Industrial Computed Tomography Market estimates & forecasts by segment 2020-2030 (USD Million)
- TABLE 61. Mexico Industrial Computed Tomography Market estimates & forecasts, 2020-2030 (USD Million)
- TABLE 62. Mexico Industrial Computed Tomography Market estimates & forecasts by segment 2020-2030 (USD Million)
- TABLE 63. Mexico Industrial Computed Tomography Market estimates & forecasts by segment 2020-2030 (USD Million)
- TABLE 64. RoLA Industrial Computed Tomography Market estimates & forecasts, 2020-2030 (USD Million)
- TABLE 65. RoLA Industrial Computed Tomography Market estimates & forecasts by segment 2020-2030 (USD Million)
- TABLE 66. RoLA Industrial Computed Tomography Market estimates & forecasts by segment 2020-2030 (USD Million)
- TABLE 67. Saudi Arabia Industrial Computed Tomography Market estimates & forecasts, 2020-2030 (USD Million)
- TABLE 68. South Africa Industrial Computed Tomography Market estimates & forecasts by segment 2020-2030 (USD Million)
- TABLE 69. RoMEA Industrial Computed Tomography Market estimates & forecasts by segment 2020-2030 (USD Million)
- TABLE 70. List of secondary sources, used in the study of global Industrial Computed Tomography Market
- TABLE 71. List of primary sources, used in the study of global Industrial Computed Tomography Market
- TABLE 72. Years considered for the study
- TABLE 73. Exchange rates considered
List of tables and figures are dummy in nature, final lists may vary in the final deliverable
LIST OF FIGURES
- FIG 1. Global Industrial Computed Tomography Market, research methodology
- FIG 2. Global Industrial Computed Tomography Market, Market estimation techniques
- FIG 3. Global Market size estimates & forecast methods
- FIG 4. Global Industrial Computed Tomography Market, key trends 2022
- FIG 5. Global Industrial Computed Tomography Market, growth prospects 2023-2030
- FIG 6. Global Industrial Computed Tomography Market, porters 5 force model
- FIG 7. Global Industrial Computed Tomography Market, pest analysis
- FIG 8. Global Industrial Computed Tomography Market, value chain analysis
- FIG 9. Global Industrial Computed Tomography Market by segment, 2020 & 2030 (USD Million)
- FIG 10. Global Industrial Computed Tomography Market by segment, 2020 & 2030 (USD Million)
- FIG 11. Global Industrial Computed Tomography Market by segment, 2020 & 2030 (USD Million)
- FIG 12. Global Industrial Computed Tomography Market by segment, 2020 & 2030 (USD Million)
- FIG 13. Global Industrial Computed Tomography Market by segment, 2020 & 2030 (USD Million)
- FIG 14. Global Industrial Computed Tomography Market, regional snapshot 2020 & 2030
- FIG 15. North America Industrial Computed Tomography Market 2020 & 2030 (USD Million)
- FIG 16. Europe Industrial Computed Tomography Market 2020 & 2030 (USD Million)
- FIG 17. Asia pacific Industrial Computed Tomography Market 2020 & 2030 (USD Million)
- FIG 18. Latin America Industrial Computed Tomography Market 2020 & 2030 (USD Million)
- FIG 19. Middle East & Africa Industrial Computed Tomography Market 2020 & 2030 (USD Million)
List of tables and figures are dummy in nature, final lists may vary in the final deliverable
Global Industrial Computed Tomography Market is valued at approximately USD 496.21 million in 2022 and is anticipated to grow with a healthy growth rate of more than 7.50% over the forecast period 2023-2030. Industrial Computed Tomography (CT) is a non-destructive testing technique that uses X-ray imaging technology to create three-dimensional representations of objects or components. It is a powerful tool used in various industries, including manufacturing, aerospace, automotive, and electronics, for quality control, product development, and failure analysis. The basic principle of CT is similar to medical CT scanning. It involves taking a series of X-ray images from different angles around an object or component. These X-ray images are then processed by a computer to reconstruct a 3D model of the internal and external features of the object. Moreover, rising manufacturing output and a growing 3D printing market are anticipated to be the growth drivers of this market. Furthermore, growing technological advancement in CT technology and growing rapid industrialization emerged as growth opportunities in the market during the forecasted period 2023-2030.
According to the United Nations Industrial Development Organization (UNIDO) in 2022, the global manufacturing output demonstrated a steady year-over-year growth rate of between 3 and 4 percent. This information indicates that the manufacturing sector worldwide experienced consistent expansion during forecasted period of 2023-2030. The stable growth rate reflects positive economic conditions and sustained demand for manufactured goods across various industries. It also highlights the resilience and adaptability of the manufacturing sector in the face of challenges such as the COVID-19 pandemic and global supply chain disruptions. The steady growth in manufacturing output is a positive sign for economies and industries worldwide, indicating a robust industrial landscape. According to Statista in 2022, the global market for 3D printing products and services reached a value of approximately USD 12.6 billion in 2020 and is projected to experience a compound annual growth rate of around 17 percent from 2020 to 2023. However, high affordability & maintenance cost and limited availability of skilled workforce may hamper the growth of the market during the forecasted period of 2023-2030.
The key regions considered for the Global Industrial Computed Tomography Market study includes Asia Pacific, North America, Europe, Latin America, and Middle East & Africa. North America dominated the global industrial computed tomography market, it is expected to continue expanding at a significant rate, driven by investments in advanced technologies, the prospering automotive and electronics industries, and the presence of key market players such as Baker Hughes Co., Nikon Metrology NV, and Yxlon International GmbH. Asia Pacific region is expected to be the fastest-growing region in the industrial computed tomography market. This growth is driven by the increasing adoption of CT systems in industries such as electronics, automotive, aerospace, and defense for testing and inspection purposes. The region serves as a major hub for automotive and electronics manufacturing companies. The region's thriving manufacturing and production activities are key factors contributing to the expansion of the market.
Major market player included in this report are:
- Nikon Metrology Inc.
- OMRON Corp.
- Baker Hughes Company
- YXLON International GmbH.
- ZEISS Group
- VJ Group
- Rigaku Corporation
- Shimadzu Corporation
- Werth Inc.
- North Star Imaging Inc.
Recent Developments in the Market:
- In June 2022, Shimadzu Corporation introduced the AA-7800 series automatic absorption spectrometer, which is a versatile analytical tool offering continuous analysis with remote data capabilities. This application utilizes network connections to enhance operator flexibility in their work.
- In June 2022, Werth Inc. developed a new technology that allows for the measurement of workpieces while they are in motion. This innovative approach utilizes X-ray computed tomography (CT) to capture workpieces at high speeds and with great precision. To overcome the challenge, the implementation of 2D radiography provides valuable information on high-density workpieces, facilitating the development of three-dimensional (3D) workpieces.
Global Industrial Computed Tomography Market Report Scope:
- Historical Data: 2020 - 2021
- Base Year for Estimation: 2022
- Forecast period: 2023-2030
- Report Coverage: Revenue forecast, Company Ranking, Competitive Landscape, Growth factors, and Trends
- Segments Covered - Offering, Application, Vertical, Region
- Regional Scope: North America; Europe; Asia Pacific; Latin America; Middle East & Africa
- Customization Scope: Free report customization (equivalent up to 8 analyst's working hours) with purchase. Addition or alteration to country, regional & segment scope*
The objective of the study is to define market sizes of different segments & countries in recent years and to forecast the values to the coming years. The report is designed to incorporate both qualitative and quantitative aspects of the industry within countries involved in the study.
The report also caters detailed information about the crucial aspects such as driving factors & challenges which will define the future growth of the market. Additionally, it also incorporates potential opportunities in micro markets for stakeholders to invest along with the detailed analysis of competitive landscape and product offerings of key players. The detailed segments and sub-segment of the market are explained below:
By Offering:
- Equipment
- Services
By Application:
- Flaw Detection & Inspection
- Failure Analysis
- Assembly Analysis
- Dimensioning & Tolerancing Analysis
- Others
By Vertical:
- Oil & Gas
- Aerospace and Defence
- Automotive
- Electronics
- Others
By Region:
- North America
- U.S.
- Canada
- Europe
- UK
- Germany
- France
- Spain
- Italy
- ROE
- Asia Pacific
- China
- India
- Japan
- Australia
- South Korea
- RoAPAC
- Latin America
- Brazil
- Mexico
- Middle East & Africa
- Saudi Arabia
- South Africa
- Rest of Middle East & Africa
Table of Contents
Chapter 1. Executive Summary
- 1.1. Market Snapshot
- 1.2. Global & Segmental Market Estimates & Forecasts, 2020-2030 (USD Million)
- 1.2.1. Industrial Computed Tomography Market, by Region, 2020-2030 (USD Million)
- 1.2.2. Industrial Computed Tomography Market, by Offering, 2020-2030 (USD Million)
- 1.2.3. Industrial Computed Tomography Market, by Application, 2020-2030 (USD Million)
- 1.2.4. Industrial Computed Tomography Market, by Vertical, 2020-2030 (USD Million)
- 1.3. Key Trends
- 1.4. Estimation Methodology
- 1.5. Research Assumption
Chapter 2. Global Industrial Computed Tomography Market Definition and Scope
- 2.1. Objective of the Study
- 2.2. Market Definition & Scope
- 2.2.1. Industry Evolution
- 2.2.2. Scope of the Study
- 2.3. Years Considered for the Study
- 2.4. Currency Conversion Rates
Chapter 3. Global Industrial Computed Tomography Market Dynamics
- 3.1. Industrial Computed Tomography Market Impact Analysis (2020-2030)
- 3.1.1. Market Drivers
- 3.1.1.1. Rising Manufacturing Output
- 3.1.1.2. Growing 3D Printing Market
- 3.1.2. Market Challenges
- 3.1.2.1. High Affordability & Maintenance Cost
- 3.1.2.2. Limited Availability of Skilled Workforce
- 3.1.3. Market Opportunities
- 3.1.3.1. Growing Technological Advancement
- 3.1.3.2. Growing Rapid Industrialization
- 3.1.1. Market Drivers
Chapter 4. Global Industrial Computed Tomography Market Industry Analysis
- 4.1. Porter's 5 Force Model
- 4.1.1. Bargaining Power of Suppliers
- 4.1.2. Bargaining Power of Buyers
- 4.1.3. Threat of New Entrants
- 4.1.4. Threat of Substitutes
- 4.1.5. Competitive Rivalry
- 4.2. Porter's 5 Force Impact Analysis
- 4.3. PEST Analysis
- 4.3.1. Political
- 4.3.2. Economical
- 4.3.3. Social
- 4.3.4. Technological
- 4.3.5. Environmental
- 4.3.6. Legal
- 4.4. Top investment opportunity
- 4.5. Top winning strategies
- 4.6. COVID-19 Impact Analysis
- 4.7. Disruptive Trends
- 4.8. Industry Expert Perspective
- 4.9. Analyst Recommendation & Conclusion
Chapter 5. Global Industrial Computed Tomography Market, by Offering
- 5.1. Market Snapshot
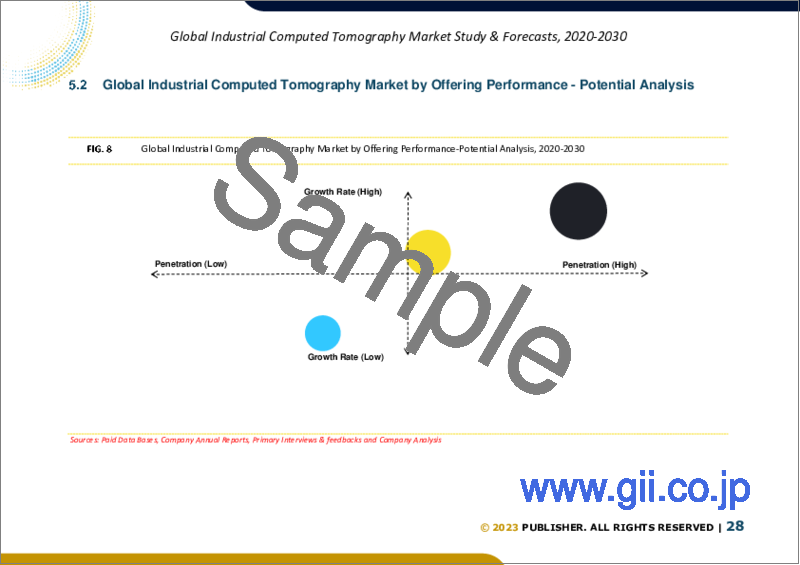
- 5.2. Global Industrial Computed Tomography Market by Offering, Performance - Potential Analysis
- 5.3. Global Industrial Computed Tomography Market Estimates & Forecasts by Offering 2020-2030 (USD Million)
- 5.4. Industrial Computed Tomography Market, Sub Segment Analysis
- 5.4.1. Equipment
- 5.4.2. Services
Chapter 6. Global Industrial Computed Tomography Market, by Application
- 6.1. Market Snapshot
- 6.2. Global Industrial Computed Tomography Market by Application, Performance - Potential Analysis
- 6.3. Global Industrial Computed Tomography Market Estimates & Forecasts by Application 2020-2030 (USD Million)
- 6.4. Industrial Computed Tomography Market, Sub Segment Analysis
- 6.4.1. Flaw Detection & Inspection
- 6.4.2. Failure Analysis
- 6.4.3. Assembly Analysis
- 6.4.4. Dimensioning & Tolerancing Analysis
- 6.4.5. Others
Chapter 7. Global Industrial Computed Tomography Market, by Vertical
- 7.1. Market Snapshot
- 7.2. Global Industrial Computed Tomography Market by Vertical, Performance - Potential Analysis
- 7.3. Global Industrial Computed Tomography Market Estimates & Forecasts by Vertical 2020-2030 (USD Million)
- 7.4. Industrial Computed Tomography Market, Sub Segment Analysis
- 7.4.1. Oil & Gas
- 7.4.2. Aerospace and Defence
- 7.4.3. Automotive
- 7.4.4. Electronics
- 7.4.5. Others
Chapter 8. Global Industrial Computed Tomography Market, Regional Analysis
- 8.1. Top Leading Countries
- 8.2. Top Emerging Countries
- 8.3. Industrial Computed Tomography Market, Regional Market Snapshot
- 8.4. North America Industrial Computed Tomography Market
- 8.4.1. U.S. Industrial Computed Tomography Market
- 8.4.1.1. Offering breakdown estimates & forecasts, 2020-2030
- 8.4.1.2. Application breakdown estimates & forecasts, 2020-2030
- 8.4.1.3. Vertical breakdown estimates & forecasts, 2020-2030
- 8.4.2. Canada Industrial Computed Tomography Market
- 8.4.1. U.S. Industrial Computed Tomography Market
- 8.5. Europe Industrial Computed Tomography Market Snapshot
- 8.5.1. U.K. Industrial Computed Tomography Market
- 8.5.2. Germany Industrial Computed Tomography Market
- 8.5.3. France Industrial Computed Tomography Market
- 8.5.4. Spain Industrial Computed Tomography Market
- 8.5.5. Italy Industrial Computed Tomography Market
- 8.5.6. Rest of Europe Industrial Computed Tomography Market
- 8.6. Asia-Pacific Industrial Computed Tomography Market Snapshot
- 8.6.1. China Industrial Computed Tomography Market
- 8.6.2. India Industrial Computed Tomography Market
- 8.6.3. Japan Industrial Computed Tomography Market
- 8.6.4. Australia Industrial Computed Tomography Market
- 8.6.5. South Korea Industrial Computed Tomography Market
- 8.6.6. Rest of Asia Pacific Industrial Computed Tomography Market
- 8.7. Latin America Industrial Computed Tomography Market Snapshot
- 8.7.1. Brazil Industrial Computed Tomography Market
- 8.7.2. Mexico Industrial Computed Tomography Market
- 8.8. Middle East & Africa Industrial Computed Tomography Market
- 8.8.1. Saudi Arabia Industrial Computed Tomography Market
- 8.8.2. South Africa Industrial Computed Tomography Market
- 8.8.3. Rest of Middle East & Africa Industrial Computed Tomography Market
Chapter 9. Competitive Intelligence
- 9.1. Key Company SWOT Analysis
- 9.1.1. Company 1
- 9.1.2. Company 2
- 9.1.3. Company 3
- 9.2. Top Market Strategies
- 9.3. Company Profiles
- 9.3.1. Nikon Metrology Inc.
- 9.3.1.1. Key Information
- 9.3.1.2. Overview
- 9.3.1.3. Financial (Subject to Data Availability)
- 9.3.1.4. Product Summary
- 9.3.1.5. Recent Developments
- 9.3.2. OMRON Corp.
- 9.3.3. Baker Hughes Company
- 9.3.4. YXLON International GmbH.
- 9.3.5. ZEISS Group
- 9.3.6. VJ Group
- 9.3.7. Rigaku Corporation
- 9.3.8. Shimadzu Corporation
- 9.3.9. Werth Inc.
- 9.3.10. North Star Imaging Inc.
- 9.3.1. Nikon Metrology Inc.
Chapter 10. Research Process
- 10.1. Research Process
- 10.1.1. Data Mining
- 10.1.2. Analysis
- 10.1.3. Market Estimation
- 10.1.4. Validation
- 10.1.5. Publishing
- 10.2. Research Attributes
- 10.3. Research Assumption