|
|
市場調査レポート
商品コード
1279843
クリーン水素の世界市場規模調査&予測、タイプ別(ブルー水素、グリーン水素)、方式別(電気分解、炭素回収)、用途別(産業、輸送、電力、その他)、地域分析、2022-2029年Global Clean Hydrogen Market Size study & Forecast, by Type (Blue Hydrogen and Green Hydrogen), by Method (Electrolysis and Carbon Capture), by Application (Industrial, Transportation, Power and Others) and Regional Analysis, 2022-2029 |
||||||
|
|
|||||||
カスタマイズ可能
|
|||||||


| クリーン水素の世界市場規模調査&予測、タイプ別(ブルー水素、グリーン水素)、方式別(電気分解、炭素回収)、用途別(産業、輸送、電力、その他)、地域分析、2022-2029年 |
|
出版日: 2023年05月15日
発行: Bizwit Research & Consulting LLP
ページ情報: 英文
納期: 2~3営業日
|

- 全表示
- 概要
- 図表
- 目次
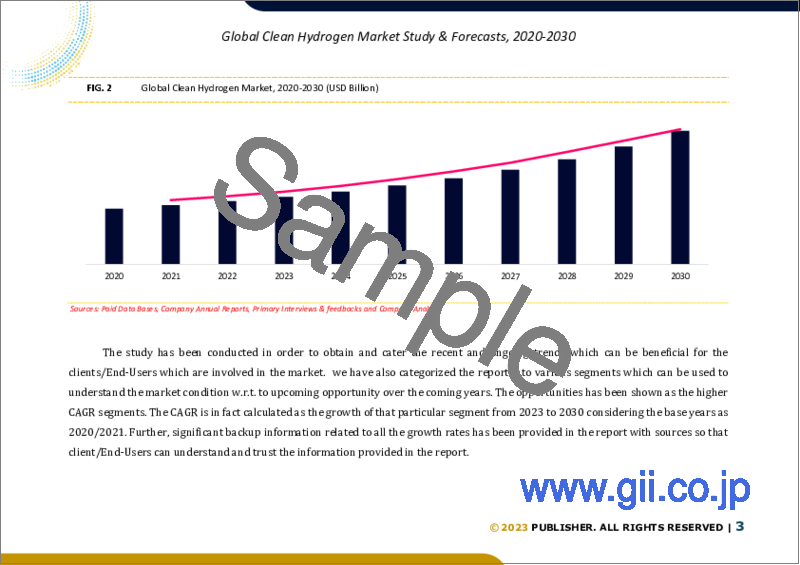
世界のクリーン水素市場は、2021年に約33億2,000万米ドルと評価され、予測期間2022-2029年には14.5%以上の堅調な成長率で成長すると予測されています。
水素は、天然ガスとして知られているメタンの代替品です。クリーンな水素は、環境への二酸化炭素の排出がゼロの状態で製造されます。クリーンな水素ガスは、化石燃料の優れた代替品として、発電、建築、産業、輸送など様々な分野で使用される予定です。輸送分野におけるクリーン水素の需要増が、予測期間中の市場成長をもたらす主要因となっています。
燃料電池車の需要が増加するにつれて、輸送分野におけるクリーン水素ガスの成長も増加し、市場の成長を高めています。国際エネルギー機関によると、2021年には、世界の燃料電池電気自動車の増加に伴い、世界中で730以上の水素補給ステーションが開設されており、2025年には3000の補給ステーションに上昇すると予想されています。また、二酸化炭素排出に関する意識の高まりや、工業化・近代化の進展が、予測期間中、市場に有利な成長見通しを生み出しています。さらに、政府のさまざまな政策がクリーン水素市場の成長を後押ししており、技術的な進歩が市場に明るい展望をもたらすと予想されます。しかし、国際貿易が限られているため、2022-2029年の予測期間を通じて市場の成長が阻害されます。
クリーン水素市場の調査対象地域は、アジア太平洋地域、北米、欧州、中南米、その他ラテンアメリカで、主要地域は以下の通りです。北米は、主要プレーヤーによるクリーン水素ガスの生産量の増加、自動車および産業分野におけるクリア水素の需要の増加により、収益シェアでクリーン水素市場を独占しています。欧州は、主要企業による研究開発資金の増加により、予測期間中に最も高いCAGRで成長すると予想されます。例えば、欧州連合によると、欧州のグリーン水素の容量は、2025年までに2.7ギガワットに達するとされています。また、EUは2021年から30年にかけて、水素プロジェクトに対して年間45億6,000万米ドルの資金を提供する可能性があります。
本調査の目的は、近年の様々なセグメント&国の市場規模を定義し、その値を今後数年間予測することです。本レポートは、調査対象国において、業界の質的・量的な側面を取り入れるよう設計されています。
また、市場の将来的な成長を規定する促進要因や課題など、重要な側面に関する詳細情報も提供しています。さらに、主要企業の競合情勢や製品提供の詳細な分析とともに、利害関係者が投資するためのミクロ市場での潜在的な機会も組み込んでいます。
目次
第1章 エグゼクティブサマリー
- マーケットスナップショット
- 世界・セグメント別市場推計・予測、2019年~2029年
- クリーン水素市場、地域別、2019年~2029年
- クリーン水素市場、タイプ別、2019-2029年
- クリーン水素市場:方法別、2019年~2029年
- クリーン水素市場、用途別、2019年~2029年
- 主な動向
- 予測手法
- 調査の前提条件
第2章 クリーン水素の世界市場の定義と範囲
- 調査目的
- 市場の定義と範囲
- 本調査の対象範囲
- 産業の進化
- 調査対象年
- 通貨換算レート
第3章 クリーン水素の世界市場力学
- クリーン水素市場の影響分析(2019年~2029年)
- 市場促進要因
- 電気自動車セクターの成長
- 二酸化炭素排出に関する意識の高まり
- 市場の課題
- 国際貿易の制限
- 市場機会
- 技術的進歩の拡大
- 研究開発のための資金調達の増加
- 市場促進要因
第4章 世界のクリーン水素市場の産業分析
- ポーターの5フォースモデル
- 供給企業の交渉力
- 買い手の交渉力
- 新規参入業者の脅威
- 代替品の脅威
- 競争企業間の敵対関係
- ポーターの5フォースモデルの未来的アプローチ(2019年~2029年)
- PEST分析
- 政治的
- 経済的
- 社会的
- 技術的
- 投資採用モデル
- アナリストの結論・提言
- トップクラスの投資機会
- 主要成功戦略
第5章 リスクアセスメント:COVID-19の影響
- COVID-19が業界に与える全体的な影響についてのアセスメント
- COVID-19以前とCOVID-19以後の市場シナリオ
第6章 クリーン水素の世界市場、タイプ別
- 市場スナップショット
- クリーン水素の世界市場:タイプ別、実績 - ポテンシャル分析
- クリーン水素の世界市場タイプ別、推定・予測2019-2029
- クリーン水素の世界市場、サブセグメント別分析
- ブルー水素
- グリーン水素
第7章 クリーン水素の世界市場:方式別
- 市場スナップショット
- クリーン水素の世界市場:方式別、実績、ポテンシャル分析
- クリーン水素の世界市場、方式別、推定・予測2019-2029
- クリーン水素市場、サブセグメント別分析
- 電気分解
- 炭素回収
第8章 クリーン水素の世界市場:用途別
- 市場スナップショット
- クリーン水素の世界市場:用途別、実績、ポテンシャル分析
- クリーン水素の世界市場、用途別、推定・予測2019-2029
- クリーン水素の世界市場、サブセグメント別分析
- 産業用
- 輸送用
- 電力
- その他
第9章 クリーン水素の世界市場:地域別分析
- クリーン水素市場、地域別市場スナップショット
- 北米
- 米国
- タイプ別の推定・予測、2019年~2029年
- 方式別の推定・予測、2019年~2029年
- 用途別の推定・予測、2019年~2029年
- カナダ
- 米国
- 欧州クリーン水素市場スナップショット
- 英国
- ドイツ
- フランス
- スペイン
- イタリア
- その他欧州
- アジア太平洋のクリーン水素市場スナップショット
- 中国
- インド
- 日本
- オーストラリア
- 韓国
- その他アジア太平洋地域
- ラテンアメリカのクリーン水素市場スナップショット
- ブラジル
- メキシコ
- 世界のその他の地域
第10章 競合情報
- トップ市場戦略
- 企業プロファイル
- Saudi Aramco
- 主要情報
- 概要
- 財務(データの入手が可能な場合のみ)
- タイプ別概要
- 最近の開発状況
- Iberdrola SA
- China Petroleum & Chemical Corporation
- Linde plc
- ExxonMobil
- FuelCell Energy Inc
- Air Products & Chemicals Inc
- Plug Power Inc.
- Orsted A/S
- Saudi Aramco
10.2.10エネル・グリーン・パワー社
第11章 調査プロセス
- 調査プロセス
- データマイニング
- 分析
- 市場推定
- バリデーション
- 出版
- 調査の特徴
- 調査の前提条件
LIST OF TABLES
- TABLE 1. Global Clean Hydrogen Market, report scope
- TABLE 2. Global Clean Hydrogen Market estimates & forecasts by Region 2019-2029 (USD Billion)
- TABLE 3. Global Clean Hydrogen Market estimates & forecasts by Type 2019-2029 (USD Billion)
- TABLE 4. Global Clean Hydrogen Market estimates & forecasts by Method 2019-2029 (USD Billion)
- TABLE 5. Global Clean Hydrogen Market estimates & forecasts by Application 2019-2029 (USD Billion)
- TABLE 6. Global Clean Hydrogen Market by segment, estimates & forecasts, 2019-2029 (USD Billion)
- TABLE 7. Global Clean Hydrogen Market by region, estimates & forecasts, 2019-2029 (USD Billion)
- TABLE 8. Global Clean Hydrogen Market by segment, estimates & forecasts, 2019-2029 (USD Billion)
- TABLE 9. Global Clean Hydrogen Market by region, estimates & forecasts, 2019-2029 (USD Billion)
- TABLE 10. Global Clean Hydrogen Market by segment, estimates & forecasts, 2019-2029 (USD Billion)
- TABLE 11. Global Clean Hydrogen Market by region, estimates & forecasts, 2019-2029 (USD Billion)
- TABLE 12. Global Clean Hydrogen Market by segment, estimates & forecasts, 2019-2029 (USD Billion)
- TABLE 13. Global Clean Hydrogen Market by region, estimates & forecasts, 2019-2029 (USD Billion)
- TABLE 14. Global Clean Hydrogen Market by segment, estimates & forecasts, 2019-2029 (USD Billion)
- TABLE 15. Global Clean Hydrogen Market by region, estimates & forecasts, 2019-2029 (USD Billion)
- TABLE 16. U.S. Clean Hydrogen Market estimates & forecasts, 2019-2029 (USD Billion)
- TABLE 17. U.S. Clean Hydrogen Market estimates & forecasts by segment 2019-2029 (USD Billion)
- TABLE 18. U.S. Clean Hydrogen Market estimates & forecasts by segment 2019-2029 (USD Billion)
- TABLE 19. Canada Clean Hydrogen Market estimates & forecasts, 2019-2029 (USD Billion)
- TABLE 20. Canada Clean Hydrogen Market estimates & forecasts by segment 2019-2029 (USD Billion)
- TABLE 21. Canada Clean Hydrogen Market estimates & forecasts by segment 2019-2029 (USD Billion)
- TABLE 22. UK Clean Hydrogen Market estimates & forecasts, 2019-2029 (USD Billion)
- TABLE 23. UK Clean Hydrogen Market estimates & forecasts by segment 2019-2029 (USD Billion)
- TABLE 24. UK Clean Hydrogen Market estimates & forecasts by segment 2019-2029 (USD Billion)
- TABLE 25. Germany Clean Hydrogen Market estimates & forecasts, 2019-2029 (USD Billion)
- TABLE 26. Germany Clean Hydrogen Market estimates & forecasts by segment 2019-2029 (USD Billion)
- TABLE 27. Germany Clean Hydrogen Market estimates & forecasts by segment 2019-2029 (USD Billion)
- TABLE 28. France Clean Hydrogen Market estimates & forecasts, 2019-2029 (USD Billion)
- TABLE 29. France Clean Hydrogen Market estimates & forecasts by segment 2019-2029 (USD Billion)
- TABLE 30. France Clean Hydrogen Market estimates & forecasts by segment 2019-2029 (USD Billion)
- TABLE 31. Italy Clean Hydrogen Market estimates & forecasts, 2019-2029 (USD Billion)
- TABLE 32. Italy Clean Hydrogen Market estimates & forecasts by segment 2019-2029 (USD Billion)
- TABLE 33. Italy Clean Hydrogen Market estimates & forecasts by segment 2019-2029 (USD Billion)
- TABLE 34. Spain Clean Hydrogen Market estimates & forecasts, 2019-2029 (USD Billion)
- TABLE 35. Spain Clean Hydrogen Market estimates & forecasts by segment 2019-2029 (USD Billion)
- TABLE 36. Spain Clean Hydrogen Market estimates & forecasts by segment 2019-2029 (USD Billion)
- TABLE 37. RoE Clean Hydrogen Market estimates & forecasts, 2019-2029 (USD Billion)
- TABLE 38. RoE Clean Hydrogen Market estimates & forecasts by segment 2019-2029 (USD Billion)
- TABLE 39. RoE Clean Hydrogen Market estimates & forecasts by segment 2019-2029 (USD Billion)
- TABLE 40. China Clean Hydrogen Market estimates & forecasts, 2019-2029 (USD Billion)
- TABLE 41. China Clean Hydrogen Market estimates & forecasts by segment 2019-2029 (USD Billion)
- TABLE 42. China Clean Hydrogen Market estimates & forecasts by segment 2019-2029 (USD Billion)
- TABLE 43. India Clean Hydrogen Market estimates & forecasts, 2019-2029 (USD Billion)
- TABLE 44. India Clean Hydrogen Market estimates & forecasts by segment 2019-2029 (USD Billion)
- TABLE 45. India Clean Hydrogen Market estimates & forecasts by segment 2019-2029 (USD Billion)
- TABLE 46. Japan Clean Hydrogen Market estimates & forecasts, 2019-2029 (USD Billion)
- TABLE 47. Japan Clean Hydrogen Market estimates & forecasts by segment 2019-2029 (USD Billion)
- TABLE 48. Japan Clean Hydrogen Market estimates & forecasts by segment 2019-2029 (USD Billion)
- TABLE 49. South Korea Clean Hydrogen Market estimates & forecasts, 2019-2029 (USD Billion)
- TABLE 50. South Korea Clean Hydrogen Market estimates & forecasts by segment 2019-2029 (USD Billion)
- TABLE 51. South Korea Clean Hydrogen Market estimates & forecasts by segment 2019-2029 (USD Billion)
- TABLE 52. Australia Clean Hydrogen Market estimates & forecasts, 2019-2029 (USD Billion)
- TABLE 53. Australia Clean Hydrogen Market estimates & forecasts by segment 2019-2029 (USD Billion)
- TABLE 54. Australia Clean Hydrogen Market estimates & forecasts by segment 2019-2029 (USD Billion)
- TABLE 55. RoAPAC Clean Hydrogen Market estimates & forecasts, 2019-2029 (USD Billion)
- TABLE 56. RoAPAC Clean Hydrogen Market estimates & forecasts by segment 2019-2029 (USD Billion)
- TABLE 57. RoAPAC Clean Hydrogen Market estimates & forecasts by segment 2019-2029 (USD Billion)
- TABLE 58. Brazil Clean Hydrogen Market estimates & forecasts, 2019-2029 (USD Billion)
- TABLE 59. Brazil Clean Hydrogen Market estimates & forecasts by segment 2019-2029 (USD Billion)
- TABLE 60. Brazil Clean Hydrogen Market estimates & forecasts by segment 2019-2029 (USD Billion)
- TABLE 61. Mexico Clean Hydrogen Market estimates & forecasts, 2019-2029 (USD Billion)
- TABLE 62. Mexico Clean Hydrogen Market estimates & forecasts by segment 2019-2029 (USD Billion)
- TABLE 63. Mexico Clean Hydrogen Market estimates & forecasts by segment 2019-2029 (USD Billion)
- TABLE 64. RoLA Clean Hydrogen Market estimates & forecasts, 2019-2029 (USD Billion)
- TABLE 65. RoLA Clean Hydrogen Market estimates & forecasts by segment 2019-2029 (USD Billion)
- TABLE 66. RoLA Clean Hydrogen Market estimates & forecasts by segment 2019-2029 (USD Billion)
- TABLE 67. Row Clean Hydrogen Market estimates & forecasts, 2019-2029 (USD Billion)
- TABLE 68. Row Clean Hydrogen Market estimates & forecasts by segment 2019-2029 (USD Billion)
- TABLE 69. Row Clean Hydrogen Market estimates & forecasts by segment 2019-2029 (USD Billion)
- TABLE 70. List of secondary sources, used in the study of global Clean Hydrogen Market
- TABLE 71. List of primary sources, used in the study of global Clean Hydrogen Market
- TABLE 72. Years considered for the study
- TABLE 73. Exchange rates considered
List of tables and figures and dummy in nature, final lists may vary in the final deliverable
LIST OF FIGURES
List of figures
- FIG 1. Global Clean Hydrogen Market, research methodology
- FIG 2. Global Clean Hydrogen Market, Market estimation techniques
- FIG 3. Global Market size estimates & forecast methods
- FIG 4. Global Clean Hydrogen Market, key trends 2021
- FIG 5. Global Clean Hydrogen Market, growth prospects 2022-2029
- FIG 6. Global Clean Hydrogen Market, porters 5 force model
- FIG 7. Global Clean Hydrogen Market, pest analysis
- FIG 8. Global Clean Hydrogen Market, value chain analysis
- FIG 9. Global Clean Hydrogen Market by segment, 2019 & 2029 (USD Billion)
- FIG 10. Global Clean Hydrogen Market by segment, 2019 & 2029 (USD Billion)
- FIG 11. Global Clean Hydrogen Market by segment, 2019 & 2029 (USD Billion)
- FIG 12. Global Clean Hydrogen Market by segment, 2019 & 2029 (USD Billion)
- FIG 13. Global Clean Hydrogen Market by segment, 2019 & 2029 (USD Billion)
- FIG 14. Global Clean Hydrogen Market, regional snapshot 2019 & 2029
- FIG 15. North America Clean Hydrogen Market 2019 & 2029 (USD Billion)
- FIG 16. Europe Clean Hydrogen Market 2019 & 2029 (USD Billion)
- FIG 17. Asia pacific Clean Hydrogen Market 2019 & 2029 (USD Billion)
- FIG 18. Latin America Clean Hydrogen Market 2019 & 2029 (USD Billion)
- FIG 19. Global Clean Hydrogen Market, company Market share analysis (2021)
List of tables and figures and dummy in nature, final lists may vary in the final deliverable
Global Clean Hydrogen Market is valued at approximately USD 3.32 billion in 2021 and is anticipated to grow with a healthy growth rate of more than 14.5% over the forecast period 2022-2029. Hydrogen is an alternative to methane, also known as natural gas. Clean hydrogen is produced with zero emission of carbon dioxide into the environment. Clean hydrogen gas is a great alternative to fossil fuels that will be used in various sectors such as power generation, building, industry, and transportation. The increased demand for clean hydrogen in the transport sector is the key factor responsible for the market growth over the forecast period.
As the demand for fuel cell vehicles increases, the growth of clean hydrogen gas in the transporter sector also increases which raises the market growth. According to the International Energy Agency, in 2021, more than 730 hydrogen refueling stations are open across the world with the rise in global fuel cell electric vehicles and expected to rise to 3000 refilling stations by 2025. Also, the increased awareness regarding carbon emissions and growing industrialization and modernization are creating a lucrative growth prospectus for the market over the forecast period. Moreover, various government policies are supporting the growth of the clean hydrogen market and technological advancements are anticipated to create a positive outlook for the market. However, limited international trade stifle market growth throughout the forecast period of 2022-2029.
The key regions considered for the Clean Hydrogen Market study includes Asia Pacific, North America, Europe, Latin America, and Rest of the World. North America dominated the Clean Hydrogen Market in terms of revenue share, owing to the increased production of clean hydrogen gas by major players and increasing the demand for clear hydrogen in the automobile and industrial sector. Europe is expected to grow with the highest CAGR during the forecast period, due to increased funding for research and development by key players. For instance-according to the European Union, Europe's green hydrogen capacity is set to reach 2.7 gigawatts by 2025. And the EU has $4.56 billion of annual funding potential for hydrogen projects in 2021-30.
Major market players included in this report are:
- Saudi Aramco
- Iberdrola SA
- China Petroleum & Chemical Corporation
- Linde plc
- ExxonMobil
- FuelCell Energy Inc
- Air Products & Chemicals Inc
- Plug Power Inc.
- Orsted A/S
- Enel Green Power Spa
Recent Developments in the Market:
- In June 2022, Siemens Energy and Air Liquide S.A. formed a joint venture to produce renewable hydrogen electrolyzers to scale the industrial sector. This production is expected to begin in the half of 2023, with a capacity of three gigatons per year by 2025.
Global Clean Hydrogen Market Report Scope:
- Historical Data: 2019-2020-2021
- Base Year for Estimation: 2021
- Forecast period: 2022-2029
- Report Coverage: Revenue forecast, Company Ranking, Competitive Landscape, Growth factors, and Trends
- Segments Covered: Type, Method, Application, Region
- Regional Scope: North America; Europe; Asia Pacific; Latin America; Rest of the World
- Customization Scope: Free report customization (equivalent up to 8 analyst's working hours) with purchase. Addition or alteration to country, regional & segment scope*
The objective of the study is to define market sizes of different segments & countries in recent years and to forecast the values to the coming years. The report is designed to incorporate both qualitative and quantitative aspects of the industry within countries involved in the study.
The report also caters detailed information about the crucial aspects such as driving factors & challenges which will define the future growth of the market. Additionally, it also incorporates potential opportunities in micro markets for stakeholders to invest along with the detailed analysis of competitive landscape and product offerings of key players. The detailed segments and sub-segment of the market are explained below.
By Type:
- Blue Hydrogen
- Green Hydrogen
By Method:
- Electrolysis
- Carbon Capture
By Application:
- Industrial,
- Transportation
- Power
- Others
By Region:
- North America
- U.S.
- Canada
- Europe
- UK
- Germany
- France
- Spain
- Italy
- ROE
- Asia Pacific
- China
- India
- Japan
- Australia
- South Korea
- RoAPAC
- Latin America
- Brazil
- Mexico
- Rest of the World
Table of Contents
Chapter 1. Executive Summary
- 1.1. Market Snapshot
- 1.2. Global & Segmental Market Estimates & Forecasts, 2019-2029 (USD Billion)
- 1.2.1. Clean Hydrogen Market, by Region, 2019-2029 (USD Billion)
- 1.2.2. Clean Hydrogen Market, by Type, 2019-2029 (USD Billion)
- 1.2.3. Clean Hydrogen Market, by Method, 2019-2029 (USD Billion)
- 1.2.4. Clean Hydrogen Market, by Application, 2019-2029 (USD Billion)
- 1.3. Key Trends
- 1.4. Estimation Methodology
- 1.5. Research Assumption
Chapter 2. Global Clean Hydrogen Market Definition and Scope
- 2.1. Objective of the Study
- 2.2. Market Definition & Scope
- 2.2.1. Scope of the Study
- 2.2.2. Industry Evolution
- 2.3. Years Considered for the Study
- 2.4. Currency Conversion Rates
Chapter 3. Global Clean Hydrogen Market Dynamics
- 3.1. Clean Hydrogen Market Impact Analysis (2019-2029)
- 3.1.1. Market Drivers
- 3.1.1.1. Growing electric Vehicle Sector
- 3.1.1.2. Increase awareness regarding carbon emission
- 3.1.2. Market Challenges
- 3.1.2.1. Limited international trade
- 3.1.3. Market Opportunities
- 3.1.3.1. Growing technological advancements
- 3.1.3.2. Increase in funding for research and development.
- 3.1.1. Market Drivers
Chapter 4. Global Clean Hydrogen Market Industry Analysis
- 4.1. Porter's 5 Force Model
- 4.1.1. Bargaining Power of Suppliers
- 4.1.2. Bargaining Power of Buyers
- 4.1.3. Threat of New Entrants
- 4.1.4. Threat of Substitutes
- 4.1.5. Competitive Rivalry
- 4.2. Futuristic Approach to Porter's 5 Force Model (2019-2029)
- 4.3. PEST Analysis
- 4.3.1. Political
- 4.3.2. Economical
- 4.3.3. Social
- 4.3.4. Technological
- 4.4. Investment Adoption Model
- 4.5. Analyst Recommendation & Conclusion
- 4.6. Top investment opportunity
- 4.7. Top winning strategies
Chapter 5. Risk Assessment: COVID-19 Impact
- 5.1. Assessment of the overall impact of COVID-19 on the industry
- 5.2. Pre COVID-19 and post COVID-19 Market scenario
Chapter 6. Global Clean Hydrogen Market, by Type
- 6.1. Market Snapshot
- 6.2. Global Clean Hydrogen Market by Type, Performance - Potential Analysis
- 6.3. Global Clean Hydrogen Market Estimates & Forecasts by Type 2019-2029 (USD Billion)
- 6.4. Clean Hydrogen Market, Sub Segment Analysis
- 6.4.1.1. Blue Hydrogen
- 6.4.1.2. Green Hydrogen
Chapter 7. Global Clean Hydrogen Market, by Method
- 7.1. Market Snapshot
- 7.2. Global Clean Hydrogen Market by Method, Performance - Potential Analysis
- 7.3. Global Clean Hydrogen Market Estimates & Forecasts by Method 2019-2029 (USD Billion)
- 7.4. Clean Hydrogen Market, Sub Segment Analysis
- 7.4.1. Electrolysis
- 7.4.2. Carbon Capture
Chapter 8. Global Clean Hydrogen Market, by Application
- 8.1. Market Snapshot
- 8.2. Global Clean Hydrogen Market by Application , Performance - Potential Analysis
- 8.3. Global Clean Hydrogen Market Estimates & Forecasts by Application 2019-2029 (USD Billion)
- 8.4. Clean Hydrogen Market, Sub Segment Analysis
- 8.4.1. Industrial
- 8.4.2. Transportation
- 8.4.3. Power
- 8.4.4. Others
Chapter 9. Global Clean Hydrogen Market, Regional Analysis
- 9.1. Clean Hydrogen Market, Regional Market Snapshot
- 9.2. North America Clean Hydrogen Market
- 9.2.1. U.S. Clean Hydrogen Market
- 9.2.1.1. Type breakdown estimates & forecasts, 2019-2029
- 9.2.1.2. Method breakdown estimates & forecasts, 2019-2029
- 9.2.1.3. Application breakdown estimates & forecasts, 2019-2029
- 9.2.2. Canada Clean Hydrogen Market
- 9.2.1. U.S. Clean Hydrogen Market
- 9.3. Europe Clean Hydrogen Market Snapshot
- 9.3.1. U.K. Clean Hydrogen Market
- 9.3.2. Germany Clean Hydrogen Market
- 9.3.3. France Clean Hydrogen Market
- 9.3.4. Spain Clean Hydrogen Market
- 9.3.5. Italy Clean Hydrogen Market
- 9.3.6. Rest of Europe Clean Hydrogen Market
- 9.4. Asia-Pacific Clean Hydrogen Market Snapshot
- 9.4.1. China Clean Hydrogen Market
- 9.4.2. India Clean Hydrogen Market
- 9.4.3. Japan Clean Hydrogen Market
- 9.4.4. Australia Clean Hydrogen Market
- 9.4.5. South Korea Clean Hydrogen Market
- 9.4.6. Rest of Asia Pacific Clean Hydrogen Market
- 9.5. Latin America Clean Hydrogen Market Snapshot
- 9.5.1. Brazil Clean Hydrogen Market
- 9.5.2. Mexico Clean Hydrogen Market
- 9.6. Rest of The World Clean Hydrogen Market
Chapter 10. Competitive Intelligence
- 10.1. Top Market Strategies
- 10.2. Company Profiles
- 10.2.1. Saudi Aramco
- 10.2.1.1. Key Information
- 10.2.1.2. Overview
- 10.2.1.3. Financial (Subject to Data Availability)
- 10.2.1.4. Type Summary
- 10.2.1.5. Recent Developments
- 10.2.2. Iberdrola SA
- 10.2.3. China Petroleum & Chemical Corporation
- 10.2.4. Linde plc
- 10.2.5. ExxonMobil
- 10.2.6. FuelCell Energy Inc
- 10.2.7. Air Products & Chemicals Inc
- 10.2.8. Plug Power Inc.
- 10.2.9. Orsted A/S
- 10.2.1. Saudi Aramco
10.2.10 Enel Green Power Sp
Chapter 11. Research Process
- 11.1. Research Process
- 11.1.1. Data Mining
- 11.1.2. Analysis
- 11.1.3. Market Estimation
- 11.1.4. Validation
- 11.1.5. Publishing
- 11.2. Research Attributes
- 11.3. Research Assumption