|
|
市場調査レポート
商品コード
1226467
ライブセルイメージングの世界市場規模調査&予測:製品&サービス別、アプリケーション別、エンドユーザー別、地域別分析、2022-2029年Global Live Cell Imaging Market Size study & Forecast, by Products & Services, by Application, by End-User and Regional Analysis, 2022-2029 |
||||||
|
|
|||||||
|
● お客様のご希望に応じて、既存データの加工や未掲載情報(例:国別セグメント)の追加などの対応が可能です。 詳細はお問い合わせください。 |
|||||||


| ライブセルイメージングの世界市場規模調査&予測:製品&サービス別、アプリケーション別、エンドユーザー別、地域別分析、2022-2029年 |
|
出版日: 2023年02月18日
発行: Bizwit Research & Consulting LLP
ページ情報: 英文
納期: 2~3営業日
|
- 全表示
- 概要
- 図表
- 目次
ライブセルイメージングとは、細胞分析装置や顕微鏡などの分析システムやハイコンテンツスクリーニング、イメージングシステムを用いた生きた細胞の研究であると定義することができます。
これらの技術は、組織や細胞の本質的な機能に対する重要な洞察を提供する多くの調査で利用されています。ライブセルイメージングシステムは、ヘルスケア産業においてより一般的になってきています。がんの発生率の増加、創薬におけるハイコンテントスクリーニング技術の採用の急増、研究資金への投資の増加は、予測期間中の市場の高いCAGRの原因となっているいくつかの要因です。
例えば、国際がん研究機関(IARC)によると、2020年には国連地域で約1,930万件の新規がん症例が報告されるとされています。2040年には、約2,840万人の症例が発生すると予測されています。このように、世界的にがんの罹患率は上昇傾向にあり、ライブセルイメージングに対するニーズは世界中で高まっていると予想されます。また、個別化医療におけるハイコンテンツスクリーニング(HCS)の応用の拡大や新薬開発の進展は、今後数年間で市場に有利な成長機会をもたらす可能性がある主要因となっています。しかし、ハイコンテンツスクリーニングシステムの高コストと熟練した専門家の不足が、2022年から2029年の予測期間を通じて市場成長を阻害します。
世界のライブセルイメージング市場の調査において考慮された主要地域は、アジア太平洋、北米、欧州、中南米、世界のその他の地域です。北米は、ライフサイエンス研究のための政府資金が利用可能であること、ライブセルイメージング技術の進歩が進んでいること、同地域でのがんの発生率が上昇していることなどから、市場シェアの点で世界的に優位な地域となっています。一方、アジア太平洋地域は、がん罹患率の増加、研究開発のためのアウトソーシング活動の普及、がん検出技術の需要の増加などの要因により、予測期間中に高い成長率を示すと予想され、アジア太平洋地域のライブセルイメージング市場に有利な成長見通しを創出するでしょう。
市場における最近の開拓
- 2021年9月、ラボ機器の開発・設計・製造で市場をリードするPHCホールディングス株式会社の子会社であるPHC株式会社は、このほどSCREEN Holdings Co. Ltd.との協業を発表しました。本提携は、SCREEN Cell3iMagerシリーズのライブセルイメージング機器を北米で販売することを目的としています。
世界のライブセルイメージング市場調査範囲。
- 過去データ:2019年~2020年~2021年
- 基本推定年:2021年
- 予測期間:2022年~2029年
- レポート対象範囲収益予測、企業ランキング、競合情勢、成長要因、動向など
- カバーするセグメント製品・サービス,アプリケーション,エンドユーザー,地域
- 地域別の範囲北米;欧州;アジア太平洋;ラテンアメリカ;その他世界のその他の地域
- カスタマイズ範囲レポートのカスタマイズは無料です(アナリストの作業時間8時間相当)。国、地域、セグメント範囲の追加または変更*。
本調査の目的は、近年における様々なセグメントおよび国の市場規模を定義し、今後数年間の値を予測することです。本レポートは、調査対象国における産業の質的・量的な側面を取り入れるよう設計されています。
また、市場の将来的な成長を規定する促進要因や課題などの重要な側面に関する詳細な情報も提供しています。さらに、主要企業の競合情勢や製品提供の詳細な分析とともに、利害関係者が投資するためのミクロ市場の潜在的な機会も組み込んでいます。
製品・サービス別
- インスツルメンツ
- 消耗品
- ソフトウェア
- サービス
アプリケーション別
- セルバイオロジー
- 幹細胞
- 発生生物学
- 創薬
エンドユーザー別
- 製薬・バイオテクノロジー企業
- 学術・研究機関
- 受託研究機関
地域別
- 北米
- 米国
- カナダ
- 欧州
- 英国
- ドイツ
- フランス
- スペイン
- イタリア
- ROE
- アジア太平洋地域
- 中国
- インド
- 日本
- オーストラリア
- 韓国
- ロアパック
- ラテンアメリカ
- ブラジル
- メキシコ
- RoLA
- 世界のその他の地域
目次
第1章 エグゼクティブサマリー
- 市場スナップショット
- 世界・セグメント別市場推定・予測、2019年~2029年
- ライブセルイメージング市場、地域別、2019-2029年
- ライブセルイメージング市場:製品・サービス別、2019年~2029年
- ライブセルイメージング市場、アプリケーション別、2019-2029年
- ライブセルイメージング市場、エンドユーザー別、2019-2029年
- 主な動向
- 調査手法
- 調査前提条件
第2章 ライブセルイメージングの世界市場:定義と範囲
- 調査の目的
- 市場の定義と範囲
- 調査対象範囲
- 産業の進化
- 調査対象年
- 通貨換算レート
第3章 世界のライブセルイメージング市場力学
- ライブセルイメージング市場のインパクト分析(2019-2029年)
- 市場促進要因
- 創薬におけるハイコンテンツスクリーニング技術の採用の増加
- がんの発生率の増加
- 市場の課題
- ハイコンテントスクリーニングシステムの高コスト
- 市場機会
- 個別化医療におけるHCSのアプリケーションの増加
- 市場促進要因
第4章 ライブセルイメージングの世界市場の産業分析
- ポーターの5フォースモデル
- 供給企業の交渉力
- 買い手の交渉力
- 新規参入業者の脅威
- 代替品の脅威
- 競争企業間の敵対関係
- ポーターの5フォースモデルへの未来的アプローチ(2019-2029年)
- PEST分析
- 政治的
- 経済的
- 社会的
- 技術的
- トップ投資機会
- 主要成功戦略
- 業界専門家別展望
- アナリストの結論・提言
第5章 リスク評価:COVID-19のインパクト
- COVID-19が業界に与える全体的な影響の評価
- COVID-19以前とCOVID-19以後の市場シナリオ
第6章 ライブセルイメージングの世界市場:製品・サービス別
- 市場スナップショット
- ライブセルイメージングの世界市場:製品・サービス別、パフォーマンス-ポテンシャル分析
- ライブセルイメージングの世界市場、製品・サービス別推定・予測(2019-2029年
- ライブセルイメージング市場、サブセグメント分析
- 機器
- 消耗品
- ソフトウェア
- サービス
第7章 ライブセルイメージングの世界市場:アプリケーション別
- 市場スナップショット
- ライブセルイメージングの世界市場:アプリケーション別、パフォーマンス、ポテンシャル分析
- ライブセルイメージングの世界市場、アプリケーション別推定・予測2019-2029
- ライブセルイメージング市場、サブセグメント分析
- 細胞生物学
- 幹細胞
- 発生生物学
- 創薬分野
第8章 ライブセルイメージングの世界市場、エンドユーザー別
- 市場スナップショット
- ライブセルイメージングの世界市場:エンドユーザー別、パフォーマンス、ポテンシャル分析
- ライブセルイメージングの世界市場、エンドユーザー別推定・予測2019-2029
- ライブセルイメージング市場、サブセグメント分析
- 製薬会社・バイオテクノロジー企業
- 学術・研究機関
- 受託研究機関
第9章 ライブセルイメージングの世界市場:地域別分析
- ライブセルイメージング市場、地域別市場スナップショット
- 北米
- 米国
- 製品・サービス別の推定・予測、2019年~2029年
- アプリケーション別の推定・予測、2019年~2029年
- エンドユーザー別の推定・予測、2019年~2029年
- カナダ
- 米国
- 欧州ライブセルイメージング市場スナップショット
- 英国
- ドイツ
- フランス
- スペイン
- イタリア
- その他の欧州地域
- アジア太平洋地域のライブセルイメージング市場のスナップショット
- 中国
- インド
- 日本
- オーストラリア
- 韓国
- その他アジア太平洋地域
- ラテンアメリカのライブセルイメージング市場のスナップショット
- ブラジル
- メキシコ
- その他のラテンアメリカ地域
- 世界のその他の地域
第10章 競合情報
- トップ市場戦略
- 企業プロファイル
- Danaher Corporation
- 主要情報
- 概要
- 財務情報(データの入手状況により異なります)
- 製品概要
- 最近の動向
- Carl Zeiss AG
- Nikon Corporation
- Olympus Corporation
- Perkinelmer
- GE Healthcare
- Thermo Fisher Scientific
- Sartorius AG
- Cytosmart Technologies
- Biotek Instruments
- Danaher Corporation
第11章 調査プロセス
- 調査プロセス
- データマイニング
- 分析
- 市場推定
- バリデーション
- 出版
- 調査属性
- 調査の前提条件
LIST OF TABLES
- TABLE 1. Global Live Cell Imaging Market, report scope
- TABLE 2. Global Live Cell Imaging Market estimates & forecasts by Region 2019-2029 (USD Billion)
- TABLE 3. Global Live Cell Imaging Market estimates & forecasts by Products & Services 2019-2029 (USD Billion)
- TABLE 4. Global Live Cell Imaging Market estimates & forecasts by Application 2019-2029 (USD Billion)
- TABLE 5. Global Live Cell Imaging Market estimates & forecasts by End-User 2019-2029 (USD Billion)
- TABLE 6. Global Live Cell Imaging Market by segment, estimates & forecasts, 2019-2029 (USD Billion)
- TABLE 7. Global Live Cell Imaging Market by region, estimates & forecasts, 2019-2029 (USD Billion)
- TABLE 8. Global Live Cell Imaging Market by segment, estimates & forecasts, 2019-2029 (USD Billion)
- TABLE 9. Global Live Cell Imaging Market by region, estimates & forecasts, 2019-2029 (USD Billion)
- TABLE 10. Global Live Cell Imaging Market by segment, estimates & forecasts, 2019-2029 (USD Billion)
- TABLE 11. Global Live Cell Imaging Market by region, estimates & forecasts, 2019-2029 (USD Billion)
- TABLE 12. Global Live Cell Imaging Market by segment, estimates & forecasts, 2019-2029 (USD Billion)
- TABLE 13. Global Live Cell Imaging Market by region, estimates & forecasts, 2019-2029 (USD Billion)
- TABLE 14. Global Live Cell Imaging Market by segment, estimates & forecasts, 2019-2029 (USD Billion)
- TABLE 15. Global Live Cell Imaging Market by region, estimates & forecasts, 2019-2029 (USD Billion)
- TABLE 16. U.S. Live Cell Imaging Market estimates & forecasts, 2019-2029 (USD Billion)
- TABLE 17. U.S. Live Cell Imaging Market estimates & forecasts by segment 2019-2029 (USD Billion)
- TABLE 18. U.S. Live Cell Imaging Market estimates & forecasts by segment 2019-2029 (USD Billion)
- TABLE 19. Canada Live Cell Imaging Market estimates & forecasts, 2019-2029 (USD Billion)
- TABLE 20. Canada Live Cell Imaging Market estimates & forecasts by segment 2019-2029 (USD Billion)
- TABLE 21. Canada Live Cell Imaging Market estimates & forecasts by segment 2019-2029 (USD Billion)
- TABLE 22. UK Live Cell Imaging Market estimates & forecasts, 2019-2029 (USD Billion)
- TABLE 23. UK Live Cell Imaging Market estimates & forecasts by segment 2019-2029 (USD Billion)
- TABLE 24. UK Live Cell Imaging Market estimates & forecasts by segment 2019-2029 (USD Billion)
- TABLE 25. Germany Live Cell Imaging Market estimates & forecasts, 2019-2029 (USD Billion)
- TABLE 26. Germany Live Cell Imaging Market estimates & forecasts by segment 2019-2029 (USD Billion)
- TABLE 27. Germany Live Cell Imaging Market estimates & forecasts by segment 2019-2029 (USD Billion)
- TABLE 28. France Live Cell Imaging Market estimates & forecasts, 2019-2029 (USD Billion)
- TABLE 29. France Live Cell Imaging Market estimates & forecasts by segment 2019-2029 (USD Billion)
- TABLE 30. France Live Cell Imaging Market estimates & forecasts by segment 2019-2029 (USD Billion)
- TABLE 31. Italy Live Cell Imaging Market estimates & forecasts, 2019-2029 (USD Billion)
- TABLE 32. Italy Live Cell Imaging Market estimates & forecasts by segment 2019-2029 (USD Billion)
- TABLE 33. Italy Live Cell Imaging Market estimates & forecasts by segment 2019-2029 (USD Billion)
- TABLE 34. Spain Live Cell Imaging Market estimates & forecasts, 2019-2029 (USD Billion)
- TABLE 35. Spain Live Cell Imaging Market estimates & forecasts by segment 2019-2029 (USD Billion)
- TABLE 36. Spain Live Cell Imaging Market estimates & forecasts by segment 2019-2029 (USD Billion)
- TABLE 37. RoE Live Cell Imaging Market estimates & forecasts, 2019-2029 (USD Billion)
- TABLE 38. RoE Live Cell Imaging Market estimates & forecasts by segment 2019-2029 (USD Billion)
- TABLE 39. RoE Live Cell Imaging Market estimates & forecasts by segment 2019-2029 (USD Billion)
- TABLE 40. China Live Cell Imaging Market estimates & forecasts, 2019-2029 (USD Billion)
- TABLE 41. China Live Cell Imaging Market estimates & forecasts by segment 2019-2029 (USD Billion)
- TABLE 42. China Live Cell Imaging Market estimates & forecasts by segment 2019-2029 (USD Billion)
- TABLE 43. India Live Cell Imaging Market estimates & forecasts, 2019-2029 (USD Billion)
- TABLE 44. India Live Cell Imaging Market estimates & forecasts by segment 2019-2029 (USD Billion)
- TABLE 45. India Live Cell Imaging Market estimates & forecasts by segment 2019-2029 (USD Billion)
- TABLE 46. Japan Live Cell Imaging Market estimates & forecasts, 2019-2029 (USD Billion)
- TABLE 47. Japan Live Cell Imaging Market estimates & forecasts by segment 2019-2029 (USD Billion)
- TABLE 48. Japan Live Cell Imaging Market estimates & forecasts by segment 2019-2029 (USD Billion)
- TABLE 49. South Korea Live Cell Imaging Market estimates & forecasts, 2019-2029 (USD Billion)
- TABLE 50. South Korea Live Cell Imaging Market estimates & forecasts by segment 2019-2029 (USD Billion)
- TABLE 51. South Korea Live Cell Imaging Market estimates & forecasts by segment 2019-2029 (USD Billion)
- TABLE 52. Australia Live Cell Imaging Market estimates & forecasts, 2019-2029 (USD Billion)
- TABLE 53. Australia Live Cell Imaging Market estimates & forecasts by segment 2019-2029 (USD Billion)
- TABLE 54. Australia Live Cell Imaging Market estimates & forecasts by segment 2019-2029 (USD Billion)
- TABLE 55. RoAPAC Live Cell Imaging Market estimates & forecasts, 2019-2029 (USD Billion)
- TABLE 56. RoAPAC Live Cell Imaging Market estimates & forecasts by segment 2019-2029 (USD Billion)
- TABLE 57. RoAPAC Live Cell Imaging Market estimates & forecasts by segment 2019-2029 (USD Billion)
- TABLE 58. Brazil Live Cell Imaging Market estimates & forecasts, 2019-2029 (USD Billion)
- TABLE 59. Brazil Live Cell Imaging Market estimates & forecasts by segment 2019-2029 (USD Billion)
- TABLE 60. Brazil Live Cell Imaging Market estimates & forecasts by segment 2019-2029 (USD Billion)
- TABLE 61. Mexico Live Cell Imaging Market estimates & forecasts, 2019-2029 (USD Billion)
- TABLE 62. Mexico Live Cell Imaging Market estimates & forecasts by segment 2019-2029 (USD Billion)
- TABLE 63. Mexico Live Cell Imaging Market estimates & forecasts by segment 2019-2029 (USD Billion)
- TABLE 64. RoLA Live Cell Imaging Market estimates & forecasts, 2019-2029 (USD Billion)
- TABLE 65. RoLA Live Cell Imaging Market estimates & forecasts by segment 2019-2029 (USD Billion)
- TABLE 66. RoLA Live Cell Imaging Market estimates & forecasts by segment 2019-2029 (USD Billion)
- TABLE 67. Row Live Cell Imaging Market estimates & forecasts, 2019-2029 (USD Billion)
- TABLE 68. Row Live Cell Imaging Market estimates & forecasts by segment 2019-2029 (USD Billion)
- TABLE 69. Row Live Cell Imaging Market estimates & forecasts by segment 2019-2029 (USD Billion)
- TABLE 70. List of secondary sources, used in the study of global Live Cell Imaging Market
- TABLE 71. List of primary sources, used in the study of global Live Cell Imaging Market
- TABLE 72. Years considered for the study
- TABLE 73. Exchange rates considered
List of tables and figures and dummy in nature, final lists may vary in the final deliverable
LIST OF FIGURES
List of figures
- FIG 1. Global Live Cell Imaging Market, research methodology
- FIG 2. Global Live Cell Imaging Market, Market estimation techniques
- FIG 3. Global Market size estimates & forecast methods
- FIG 4. Global Live Cell Imaging Market, key trends 2021
- FIG 5. Global Live Cell Imaging Market, growth prospects 2022-2029
- FIG 6. Global Live Cell Imaging Market, porters 5 force model
- FIG 7. Global Live Cell Imaging Market, pest analysis
- FIG 8. Global Live Cell Imaging Market, value chain analysis
- FIG 9. Global Live Cell Imaging Market by segment, 2019 & 2029 (USD Billion)
- FIG 10. Global Live Cell Imaging Market by segment, 2019 & 2029 (USD Billion)
- FIG 11. Global Live Cell Imaging Market by segment, 2019 & 2029 (USD Billion)
- FIG 12. Global Live Cell Imaging Market by segment, 2019 & 2029 (USD Billion)
- FIG 13. Global Live Cell Imaging Market by segment, 2019 & 2029 (USD Billion)
- FIG 14. Global Live Cell Imaging Market, regional snapshot 2019 & 2029
- FIG 15. North America Live Cell Imaging Market 2019 & 2029 (USD Billion)
- FIG 16. Europe Live Cell Imaging Market 2019 & 2029 (USD Billion)
- FIG 17. Asia pacific Live Cell Imaging Market 2019 & 2029 (USD Billion)
- FIG 18. Latin America Live Cell Imaging Market 2019 & 2029 (USD Billion)
- FIG 19. Global Live Cell Imaging Market, company Market share analysis (2021)
List of tables and figures and dummy in nature, final lists may vary in the final deliverable
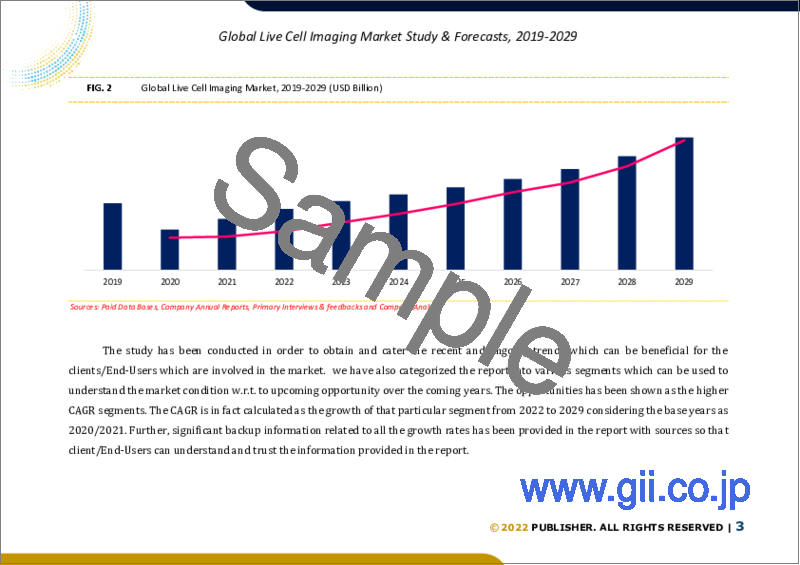
Global Live Cell Imaging Market is valued approximately USD XXX billion in 2021 and is anticipated to grow with a healthy growth rate of more than XX% over the forecast period 2022-2029. Live cell imaging can be defined as the study of living cells via analysis systems or high content screening and imaging systems such as cell analyzers, microscopes and many more. These technologies are utilized in number of investigations that offer critical insights into the essential nature of tissue and cellular function. The live cell imaging system has become more popular in the healthcare industry. Rising incidence of cancer, surging adoption of high-content screening techniques in drug discovery, and increasing investments made in research funding are the few factors responsible for high CAGR of the market over the forecast period.
For instance, according to International Agency for Research on Cancer (IARC), approx. 19.3 million new cases of cancer are reported in UN regions in 2020. In the year 2040, it is anticipated that there would be about 28.4 million cases. Thus, the prevalence of cancer is on surging trend across the globe thereby, the need for live cell imaging is expected to increase around the world. Additionally, increasing application of high content screening (HCS) in personalized medicine and growing development of new drugs are the major factors likely to create lucrative growth opportunity to the market in the upcoming years. However, the high cost of high-content screening systems and the shortage of skilled professionals' stifles market growth throughout the forecast period of 2022-2029.
The key regions considered for the Global Live Cell Imaging Market study includes Asia Pacific, North America, Europe, Latin America, and Rest of the World. North America is the dominating region across the world in terms of market share, owing to the availability of government funding for life science research, growing advancements in live cell imaging techniques and the rising incidence of cancer in the region. Whereas, Asia Pacific is also anticipated to exhibit highest growth rate over the forecast period, owing to factors such as increase in cancer prevalence, widespread outsourcing activities for research and development and growth in the demand for cancer detection techniques that would create lucrative growth prospects for the Live Cell Imaging market across Asia Pacific region.
Major market players included in this report are:
- Danaher Corporation
- Carl Zeiss AG
- Nikon Corporation
- Olympus Corporation
- Perkinelmer
- GE Healthcare
- Thermo Fisher Scientific
- Sartorius AG
- Cytosmart Technologies
- Biotek Instruments
Recent Developments in the Market:
- In Sept. 2021, PHC Holdings Corporation's subsidiary PHC Corporation, a market leader in the development, design, and production of lab equipment, recently announced a collaboration with SCREEN Holdings Co. Ltd. The collaboration aims to market live-cell imaging instruments from the SCREEN Cell3iMager line in North America.
Global Live Cell Imaging Market Report Scope:
- Historical Data: 2019-2020-2021
- Base Year for Estimation: 2021
- Forecast period: 2022-2029
- Report Coverage: Revenue forecast, Company Ranking, Competitive Landscape, Growth factors, and Trends
- Segments Covered: Products & Services, Application, End-User, Region
- Regional Scope: North America; Europe; Asia Pacific; Latin America; Rest of the World
- Customization Scope: Free report customization (equivalent up to 8 analyst's working hours) with purchase. Addition or alteration to country, regional & segment scope*
The objective of the study is to define market sizes of different segments & countries in recent years and to forecast the values to the coming years. The report is designed to incorporate both qualitative and quantitative aspects of the industry within countries involved in the study.
The report also caters detailed information about the crucial aspects such as driving factors & challenges which will define the future growth of the market. Additionally, it also incorporates potential opportunities in micro markets for stakeholders to invest along with the detailed analysis of competitive landscape and product offerings of key players. The detailed segments and sub-segment of the market are explained below:
By Products & Services:
- Instruments
- Consumables
- Software
- Services
By Application:
- Cell Biology
- Stem Cells
- Developmental Biology
- Drug Discovery
By End-User:
- Pharmaceutical & Biotechnology Companies
- Academic & Research Institutes
- Contract Research Organizations
By Region:
- North America
- U.S.
- Canada
- Europe
- UK
- Germany
- France
- Spain
- Italy
- ROE
- Asia Pacific
- China
- India
- Japan
- Australia
- South Korea
- RoAPAC
- Latin America
- Brazil
- Mexico
- RoLA
- Rest of the World
Table of Contents
Chapter 1. Executive Summary
- 1.1. Market Snapshot
- 1.2. Global & Segmental Market Estimates & Forecasts, 2019-2029 (USD Billion)
- 1.2.1. Live Cell Imaging Market, by Region, 2019-2029 (USD Billion)
- 1.2.2. Live Cell Imaging Market, by Products & Services, 2019-2029 (USD Billion)
- 1.2.3. Live Cell Imaging Market, by Application, 2019-2029 (USD Billion)
- 1.2.4. Live Cell Imaging Market, by End-User, 2019-2029 (USD Billion)
- 1.3. Key Trends
- 1.4. Estimation Methodology
- 1.5. Research Assumption
Chapter 2. Global Live Cell Imaging Market Definition and Scope
- 2.1. Objective of the Study
- 2.2. Market Definition & Scope
- 2.2.1. Scope of the Study
- 2.2.2. Industry Evolution
- 2.3. Years Considered for the Study
- 2.4. Currency Conversion Rates
Chapter 3. Global Live Cell Imaging Market Dynamics
- 3.1. Live Cell Imaging Market Impact Analysis (2019-2029)
- 3.1.1. Market Drivers
- 3.1.1.1. Rising adoption of high-content screening techniques in drug discovery
- 3.1.1.2. Growing incidence of cancer
- 3.1.2. Market Challenges
- 3.1.2.1. High cost of high-content screening systems
- 3.1.3. Market Opportunities
- 3.1.3.1. Increasing application of HCS in personalized medicine
- 3.1.1. Market Drivers
Chapter 4. Global Live Cell Imaging Market Industry Analysis
- 4.1. Porter's 5 Force Model
- 4.1.1. Bargaining Power of Suppliers
- 4.1.2. Bargaining Power of Buyers
- 4.1.3. Threat of New Entrants
- 4.1.4. Threat of Substitutes
- 4.1.5. Competitive Rivalry
- 4.2. Futuristic Approach to Porter's 5 Force Model (2019-2029)
- 4.3. PEST Analysis
- 4.3.1. Political
- 4.3.2. Economical
- 4.3.3. Social
- 4.3.4. Technological
- 4.4. Top investment opportunity
- 4.5. Top winning strategies
- 4.6. Industry Experts Prospective
- 4.7. Analyst Recommendation & Conclusion
Chapter 5. Risk Assessment: COVID-19 Impact
- 5.1. Assessment of the overall impact of COVID-19 on the industry
- 5.2. Pre COVID-19 and post COVID-19 Market scenario
Chapter 6. Global Live Cell Imaging Market, by Products & Services
- 6.1. Market Snapshot
- 6.2. Global Live Cell Imaging Market by Products & Services, Performance - Potential Analysis
- 6.3. Global Live Cell Imaging Market Estimates & Forecasts by Products & Services 2019-2029 (USD Billion)
- 6.4. Live Cell Imaging Market, Sub Segment Analysis
- 6.4.1. Instruments
- 6.4.2. Consumables
- 6.4.3. Software
- 6.4.4. Services
Chapter 7. Global Live Cell Imaging Market, by Application
- 7.1. Market Snapshot
- 7.2. Global Live Cell Imaging Market by Application, Performance - Potential Analysis
- 7.3. Global Live Cell Imaging Market Estimates & Forecasts by Application 2019-2029 (USD Billion)
- 7.4. Live Cell Imaging Market, Sub Segment Analysis
- 7.4.1. Cell Biology
- 7.4.2. Stem Cells
- 7.4.3. Developmental Biology
- 7.4.4. Drug Discovery
Chapter 8. Global Live Cell Imaging Market, by End-User
- 8.1. Market Snapshot
- 8.2. Global Live Cell Imaging Market by End-User, Performance - Potential Analysis
- 8.3. Global Live Cell Imaging Market Estimates & Forecasts by End-User 2019-2029 (USD Billion)
- 8.4. Live Cell Imaging Market, Sub Segment Analysis
- 8.4.1. Pharmaceutical & Biotechnology Companies
- 8.4.2. Academic & Research Institutes
- 8.4.3. Contract Research Organizations
Chapter 9. Global Live Cell Imaging Market, Regional Analysis
- 9.1. Live Cell Imaging Market, Regional Market Snapshot
- 9.2. North America Live Cell Imaging Market
- 9.2.1. U.S. Live Cell Imaging Market
- 9.2.1.1. Products & Services breakdown estimates & forecasts, 2019-2029
- 9.2.1.2. Application breakdown estimates & forecasts, 2019-2029
- 9.2.1.3. End-User breakdown estimates & forecasts, 2019-2029
- 9.2.2. Canada Live Cell Imaging Market
- 9.2.1. U.S. Live Cell Imaging Market
- 9.3. Europe Live Cell Imaging Market Snapshot
- 9.3.1. U.K. Live Cell Imaging Market
- 9.3.2. Germany Live Cell Imaging Market
- 9.3.3. France Live Cell Imaging Market
- 9.3.4. Spain Live Cell Imaging Market
- 9.3.5. Italy Live Cell Imaging Market
- 9.3.6. Rest of Europe Live Cell Imaging Market
- 9.4. Asia-Pacific Live Cell Imaging Market Snapshot
- 9.4.1. China Live Cell Imaging Market
- 9.4.2. India Live Cell Imaging Market
- 9.4.3. Japan Live Cell Imaging Market
- 9.4.4. Australia Live Cell Imaging Market
- 9.4.5. South Korea Live Cell Imaging Market
- 9.4.6. Rest of Asia Pacific Live Cell Imaging Market
- 9.5. Latin America Live Cell Imaging Market Snapshot
- 9.5.1. Brazil Live Cell Imaging Market
- 9.5.2. Mexico Live Cell Imaging Market
- 9.5.3. Rest of Latin America Live Cell Imaging Market
- 9.6. Rest of The World Live Cell Imaging Market
Chapter 10. Competitive Intelligence
- 10.1. Top Market Strategies
- 10.2. Company Profiles
- 10.2.1. Danaher Corporation
- 10.2.1.1. Key Information
- 10.2.1.2. Overview
- 10.2.1.3. Financial (Subject to Data Availability)
- 10.2.1.4. Product Summary
- 10.2.1.5. Recent Developments
- 10.2.2. Carl Zeiss AG
- 10.2.3. Nikon Corporation
- 10.2.4. Olympus Corporation
- 10.2.5. Perkinelmer
- 10.2.6. GE Healthcare
- 10.2.7. Thermo Fisher Scientific
- 10.2.8. Sartorius AG
- 10.2.9. Cytosmart Technologies
- 10.2.10. Biotek Instruments
- 10.2.1. Danaher Corporation
Chapter 11. Research Process
- 11.1. Research Process
- 11.1.1. Data Mining
- 11.1.2. Analysis
- 11.1.3. Market Estimation
- 11.1.4. Validation
- 11.1.5. Publishing
- 11.2. Research Attributes
- 11.3. Research Assumption